Build a Model Solution 11/26/2018
Chapter: 7 Valuation of Stocks and Corporations
Problem: 26 Value Drivers in the Free Cash Flow Valuation Model
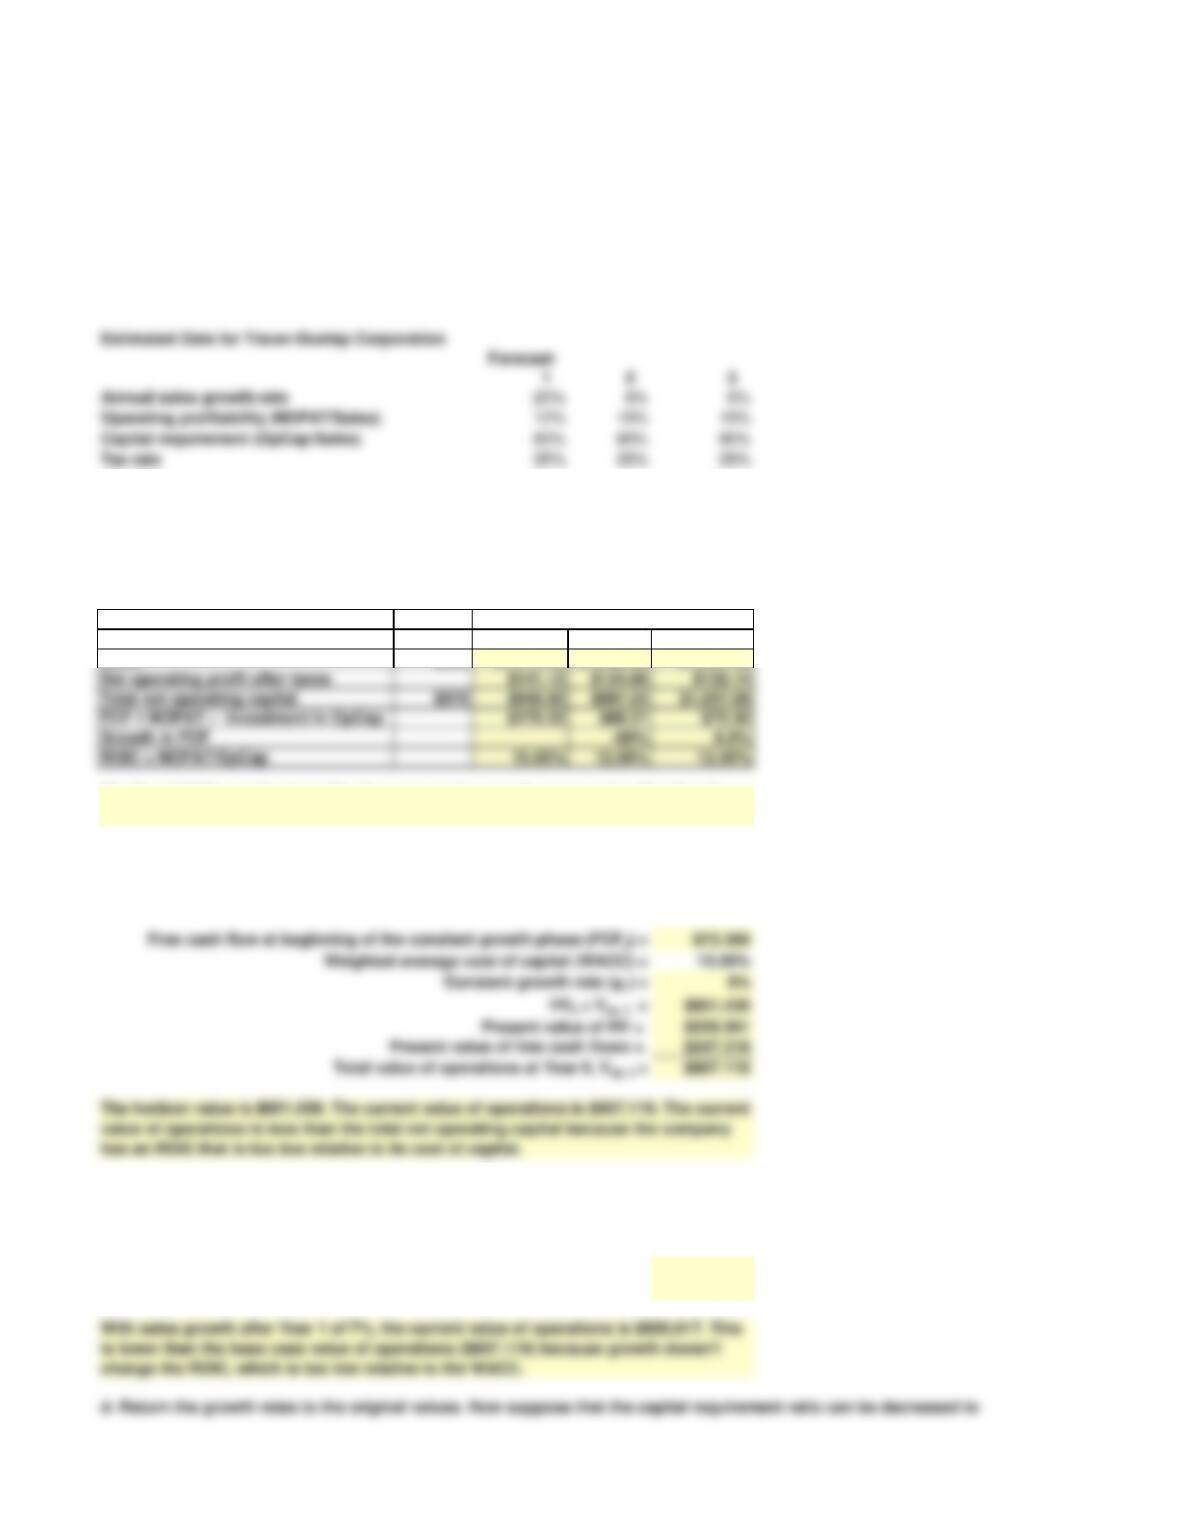
Current
0 1 2 3
Sales $980 $1,176.00 $1,246.56 $1,321.35
Total value of operations at Year 0, Vop, 0 = $807.119
value of operations is less than the total net operating capital because the company
has an ROIC that is too low relative to its cost of capital.
Sales growth rates after Year 1 = 7%
Total value of operations at Year 0, Vop, 0 = $800.017
Reminder:
delete the
other
scenarios
in student
version!
c. Suppose the growth rates for Years 2, 3, and thereafter can be increased to 7%. What is the new value of
operations? Did it go up or down? Why did it change in this manner?
is lower than the base case value of operations ($807.119) because growth doesn’t
change the ROIC, which is too low relative to the WACC.
Hint: Create a scenario and copy the new
scenario’s output as a value.
Forecast Year
The Year 3 FCF growth rate is 6%, the same as the growth rate in sales. The Year 3
ROIC is 12.5% and it is lower than the WACC of 15%.
b. What is the value of operations at Year 3, Vop,3? What is the current value of operations, Vop,0? How does the value
of operations at Year 0 compare with the total net operating capital at Year 3, and what might explain this
relationship?
Traver-Dunlap Corporation’s has a 15% weighted average cost of capital (WACC). Its most recent sales were $980
million and its total net operating capital is $970 million. The following shows estimates of the forecasted growth
rates, operating profitability ratios, and capital requirement ratios for the next three years. All of these ratios are
expected to remain constant after the third year. Use this information to answer the following questions.
a. Use the data to forecast sales, net operating profit after taxes (NOPAT), total net operating capital (OpCap), free
cash flow (FCF), growth rate in FCF, and return on invested capital (ROIC) for the next three years. What is the FCF
growth rate for Year 3 and how does it compare with the growth rate in sales? What is the ROIC for Year 3 and how
does it compare with the 15% WACC?
Sales growth rates after Year 1 = 7%
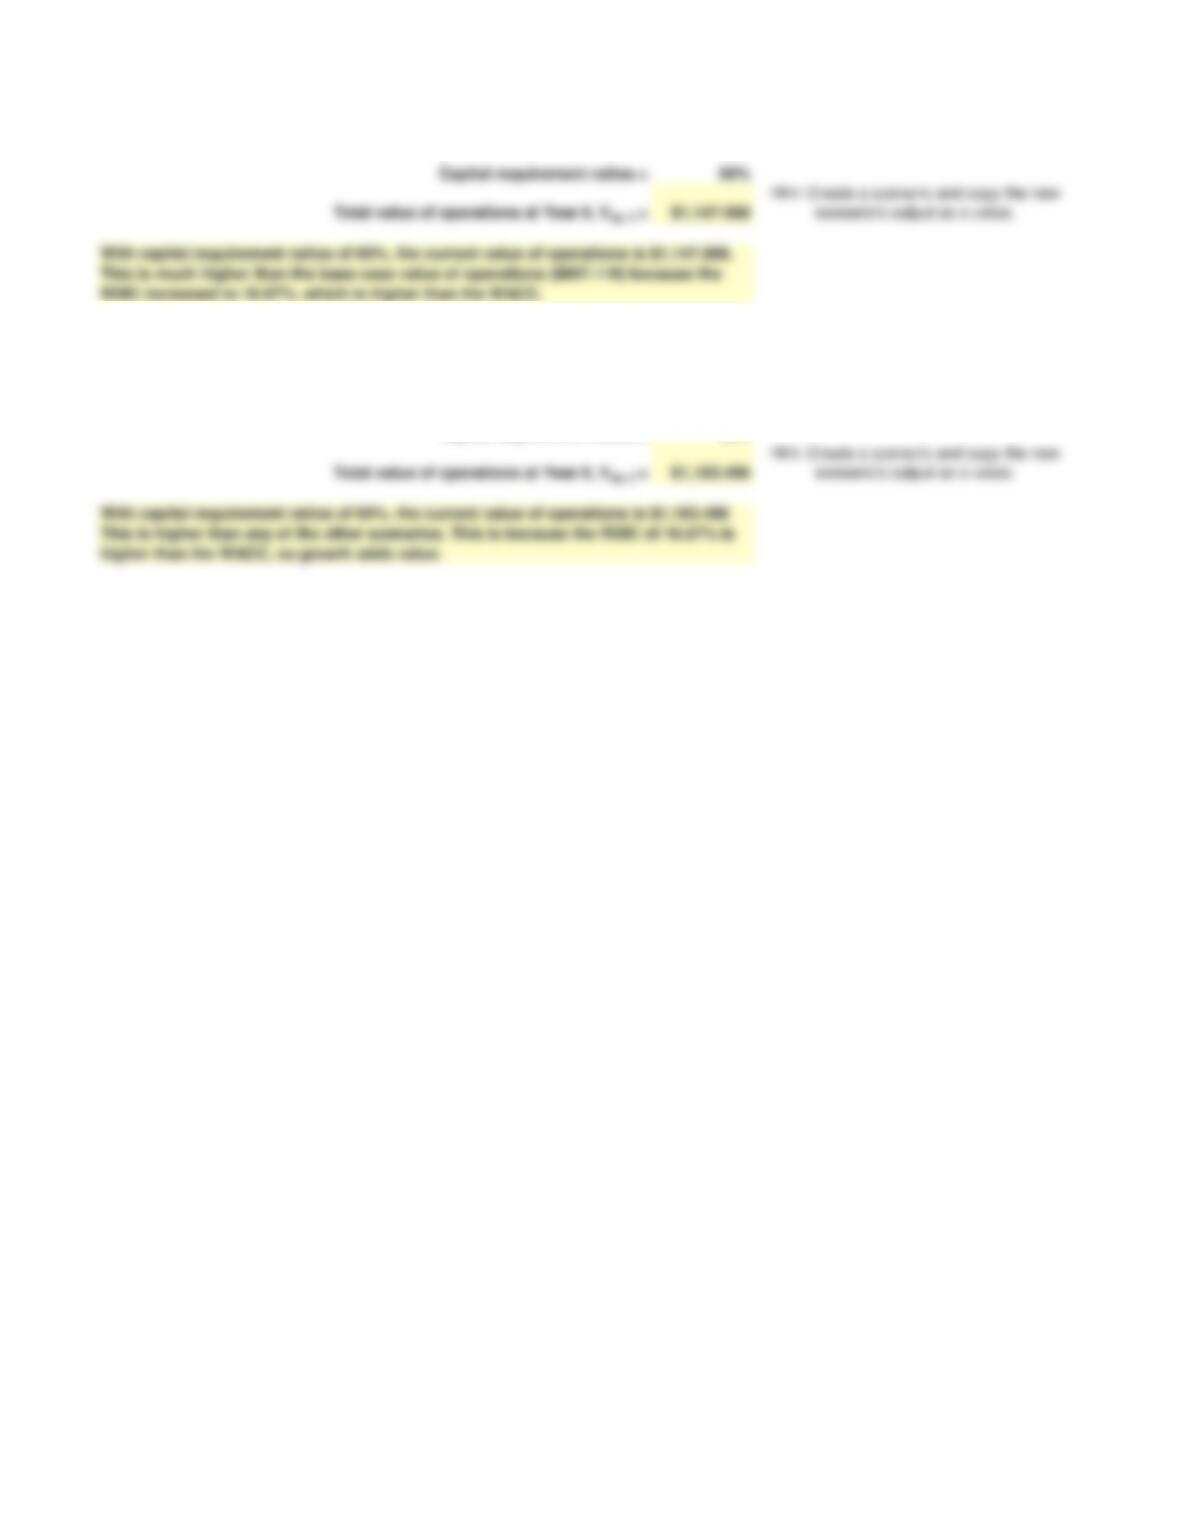
Capital requirement ratios = 60%
With capital requirement ratios of 60%, the current value of operations is $1,183.496
This is higher than any of the other scenarios. This is because the ROIC of 16.67% is
higher than the WACC, so growth adds value.
d. Return the growth rates to the original values. Now suppose that the capital requirement ratio can be decreased to
60% for all three years and thereafter. What is the new value of operations? Did it go up or down relative to the
original base case? Why did it change in this manner?
e. Leave the capital requirement ratios at 60% for all three years and thereafter, but increase the sales growth rates
for Years 2, 3, and thereafter to 7%. What is the new value of operations? Did it go up or down relative to the other
scenarios? Why did it change in this manner?
With capital requirement ratios of 60%, the current value of operations is $1,147.988.
This is much higher than the base case value of operations ($807.119) because the
ROIC increased to 16.67%, which is higher than the WACC.