1
2
3
4
5
6
7
8
9
10
11
12
13
14
15
16
17
21
22
23
24
25
34
Accounts receivable $351,200 $632,160 $878,000
Total current assets $1,124,000 $1,946,802 $2,680,112
Gross Fixed Assets $491,000 $1,202,950 $1,220,000
Less Accumulated Dep. $146,200 $263,160 $383,160
Net Fixed Assets $344,800 $939,790 $836,840
26
27
46
Total current liabilities $481,600 $1,328,960 $1,039,800
Long-term bonds $323,432 $1,000,000 $500,000
Total liabilities $805,032 $2,328,960 $1,539,800
Common stock (100,000 shares) $460,000 $460,000 $1,680,936
Retained earnings $203,768 $97,632 $296,216
Total common equity $663,768 $557,632 $1,977,152
35
36
37
38
47
48
49
50
60
Other Expenses $340,000 $720,000 $612,960
Total Operating Cost $3,222,900 $5,816,960 $6,532,960
Earnings before interest and taxes (EBIT) $209,100 $17,440 $502,640
Less interest $62,500 $176,000 $80,000
Pre-tax earnings $146,600 ($158,560) $422,640
Taxes (40%) $58,640 ($63,424) $169,056
51
52
53
A B C D E F G H I
1/6/2015
Input Data:
2014 2015 2016
Year-end common stock price $8.50 $6.00 $12.17
Balance Sheets
Assets 2014 2015 2016
Cash and equivalents $9,000 $7,282 $14,000
Short-term investments $48,600 $20,000 $71,632
Liabilities and equity
Accounts payable $145,600 $324,000 $359,800
Notes payable $200,000 $720,000 $300,000
Income Statements
2014 2015 2016
Net sales $3,432,000 $5,834,400 $7,035,600
Costs of Goods Sold Except Depr. $2,864,000 $4,980,000 $5,800,000
Depreciation and amortization $18,900 $116,960 $120,000
Jenny Cochran was brought in as assistant to Gary Meissner, Computron’s chairman, who had the task of getting the
company back into a sound financial position. Computron’s 2014 and 2015 balance sheets and income statements, together
with projections for 2016, are shown in the following tables. The tables also show the 2014 and 2015 financial ratios, along
with industry average data. The 2016 projected financial statement data represent Cochran’s and Meissner’s best guess for
2016 results, assuming that some new financing is arranged to get the company “over the hump.”
Chapter 7 Mini Case
The first part of the case, presented in Chapter 6, discussed the situation of Computron Industries after an expansion
program. A large loss occurred in 2015, rather than the expected profit. As a result, its managers, directors, and investors
are concerned about the firm’s survival.
Year-end shares outstanding 100,000 100,000 250,000
Tax rate 40% 40% 40%
Lease payments $40,000 $40,000 $40,000
a. Why are ratios useful? What are the five major categories of ratios? Answer: See Chapter 07 Mini Case Show
65
66
67
68
70
71
72
73
74
Current Ratio 2.33 1.46 2.58 2.70
Quick Ratio 0.85 0.50 0.93 1.00
types of analysts have an equal interest in the liquidity ratios? Answer: See Chapter 07 Mini Case Show
78
79
80
82
83
84
85
86
87
88
Days Sales Outstanding 37.4 39.5 45.5 32.00
Fixed Asset Turnover 9.95 6.21 8.41 7.00
Total Asset Turnover 2.34 2.02 2.00 2.50
89
93
94
95
96
97
Debt Ratio 35.6% 59.6% 22.7% 32.0%
Liabilities-to-assets Ratio
Times Interest Earned 3.35 0.10 6.28 6.20
EBITDA Coverage Ratio 2.61 0.81 5.52 8.00
102
103
104
105
106
Net Profit Margin 2.6% -1.6% 3.6% 3.6%
Operating Margin 6.1% 0.3% 7.1% 7.1%
Gross Profit Margin 16.6% 14.6% 17.6% 15.5%
Basic Earning Power 14.2% 0.6% 14.3% 17.8%
Return on Assets 6.0% -3.3% 7.2% 9.0%
Return on Equity 13.3% -17.1% 12.8% 18.0%
113
114
115
116
117
Price-to Earnings Ratio 9.66 -6.31 12.00 14.20
b. (1.) Calculate the current and quick ratios based on the projected balance sheet and income statement data.
Calculated Data: Ratios Industry
2014 2015 2016 Average
Industry
Asset Management ratios 2014 2015 2016 Average
Inventory Turnover 4.03 3.96 3.45 6.10
Industry
Debt Management ratios 2014 2015 2016 Average
Industry
Profitability ratios 2014 2015 2016 Average
Industry
Market Value ratios 2014 2015 2016 Average
f. Calculate the price/earnings ratio, price/cash flow ratio, and market/book ratio. Do these ratios indicate that investors are
expected to have a high or low opinion of the company?
Cochran must prepare an analysis of where the company is now, what it must do to regain its financial health, and what
actions should be taken. Your assignment is to help her answer the following questions. Provide clear explanations, not
yes or no answers.
(2.) What can you say about the company’s liquidity position? We often think of ratios as being useful (1) to managers to
help run the business, (2) to bankers for credit analysis, and (3) to stockholders for stock valuation. Would these different
d. Calculate the debt ratio, liabilities-to-assets ratio, times-interest-earned, and EBITDA coverage ratios. How does
Computron compare with the industry with respect to financial leverage? What can you conclude from these ratios?
e. Calculate the profit margin, basic earning power (BEP), return on assets (ROA), and return on equity (ROE). What can
you say about these ratios?
c. Calculate the inventory turnover, days sales outstanding (DSO), fixed assets turnover, operating capital requirement, and
total assets turnover. How does Computron’s utilization of assets stack up against other firms in its industry?
64
Book Value Per Share $6.638 $5.576 $7.909
Computron 2015 -17.1% -1.6% 2.0 5.18
performance? Answer: See Chapter 07 Mini Case Show
123
124
125
126
127
128
129
130
131
136
137
138
141
142
143
144
145
146
147
148
149
150
151
152
153
154
155
A B C D E F G H I
See the worksheet with the TAB “Common Size and % Change”
DuPont Analysis ROE =
P.M. X
T.A.T.O. X
Equity Multiplier
Computron 2014 13.3% 2.6% 2.3 2.21
h. Use the extended DuPont equation to provide a summary and overview of Computron’s projected financial condition.
What are the firm’s major strengths and weaknesses?
g. Perform a common size analysis and percent change analysis. What do these analyses tell you about Computron?
i. What are some potential problems and limitations of financial ratio analysis? Answer: See Chapter 07 Mini Case Show
j. What are some qualitative factors analysts should consider when evaluating a company’s likely future financial
Common Size Statements
Balance Sheets 2014 2015 2016 Industry
Assets
Cash and equivalents 0.6% 0.3% 0.4% 0.3%
Short-term investments 3.3% 0.7% 2.0% 0.3%
Accounts receivable 23.9% 21.9% 25.0% 22.4%
Income Statements 2014 2015 2016 Industry
Net sales 100.0% 100.0% 100.0% 100.0%
COGS except depr. 83.4% 85.4% 82.4% 84.5%
Other Expenses 9.9% 12.3% 8.7% 4.4%
Less interest 1.8% 3.0% 1.1% 1.1%
Pre-tax earnings 4.3% -2.7% 6.0% 5.9%
Taxes (40%) 1.7% -1.1% 2.4% 2.4%
Common Size Analysis and Percent Change Analysis
In common size analysis, all income statement items are divided by sales, and all balance sheet items are
divided by total assets.
Total Current Assets 76.5% 67.4% 76.2% 64.1%
Net Fixed Assets 23.5% 32.6% 23.8% 35.9%
Total Assets 100.0% 100.0% 100.0% 100.0%
Accounts payable 9.9% 11.2% 10.2% 11.9%
Notes payable 13.6% 24.9% 8.5% 2.4%
Total current liabilities 32.8% 46.0% 29.6% 23.7%
Long-term bonds 22.0% 34.6% 14.2% 26.3%
Total common equity 45.2% 19.3% 56.2% 50.0%
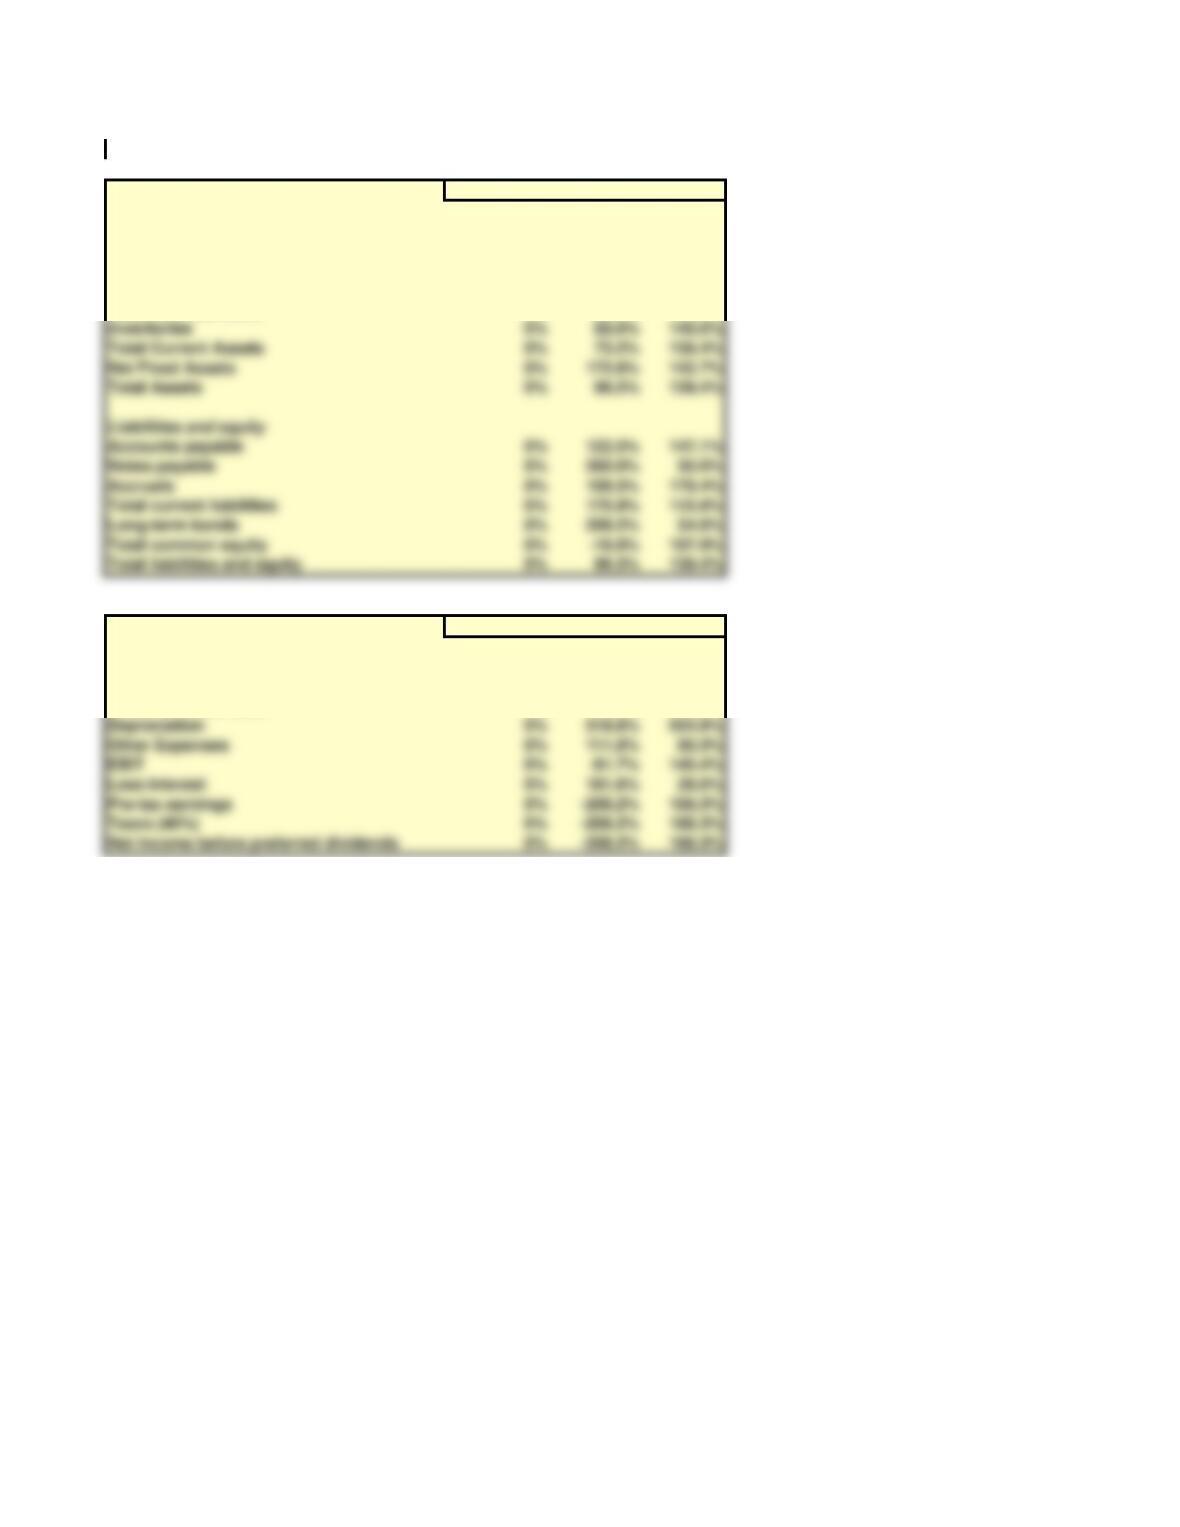
Percentage Change Analysis
Balance Sheets 2014 2015 2016
Assets
Cash and equivalents 0% -19.1% 55.6%
Short-term investments 0% -58.8% 47.4%
Accounts receivable 0% 80.0% 150.0%
Income Statements 2014 2015 2016
Net sales 0% 70.0% 105.0%
Costs of Goods Sold 0% 73.9% 102.5%
Other Expenses 0% 111.8% 80.3%
Less interest 0% 181.6% 28.0%
Pre-tax earnings 0% -208.2% 188.3%
Taxes (40%) 0% -208.2% 188.3%
Total Current Assets 0% 73.2% 138.4%
Net Fixed Assets 0% 172.6% 142.7%
Total Assets 0% 96.5% 139.4%
Accounts payable 0% 122.5% 147.1%
Notes payable 0% 260.0% 50.0%
Total current liabilities 0% 175.9% 115.9%
Long-term bonds 0% 209.2% 54.6%
Total common equity 0% -16.0% 197.9%