
7 – 1
CHAPTER 7
ASSET PRICING MODELS
Answers to Questions
1. In a capital asset pricing model (CAPM) world, the relevant risk variable is the security’s
systematic risk, which includes its covariance of return with all other risky assets in the
2. Similarities: They both measure the relationship between risk and expected return.
Differences: First, the CML measures risk by the standard deviation (i.e., total risk) of the
investment, while the SML explicitly considers only the systematic component of an
3. Any three of the following are criticisms of beta as used in CAPM.
1. Theory does not measure up to practice. In theory, a security with a zero beta should
give a return exactly equal to the risk-free rate. But actual results do not come out that

3. Estimated betas are unstable. Major changes in a company that affect the character of
4. Beta is easily rolled over. Richard Roll has demonstrated that by changing the market
index against which betas are measured, one can obtain quite different measures of the
4.
4(a). The concepts are explained as follows:
The Foundation’s portfolio currently holds a number of securities from two asset classes.
Each of the individual securities has its own risk (and return) characteristics, described as
specific risk. By including a sufficiently large number of holdings, the specific risk of the
expressed using standard deviations. Thus, 68 percent of returns can be expected to fall
within + or -1 standard deviation of the mean, and 95 percent of returns can be expected
to fall within 2 standard deviations of the mean.
Covariance measures the extent to which two securities tend to move, or not move,
together. The level of covariance is heavily influenced by the degree of correlation

7 – 3
Under the CAPM, beta measures the systematic risk of an individual security or
portfolio. Beta is the slope of the characteristic line that relates a security’s returns to the
4(b). Without performing the calculations, one can see that the portfolio return would increase
because: (1) Real estate has an expected return equal to that of stocks; (2) Its expected
return is higher than the return on bonds.
4(c). Capital market theory holds that efficient markets prevent mispricing of assets and that
expected return is proportionate to the level of risk taken. In this instance, real estate is
expected to provide the same return as stocks and a higher return than bonds. Yet, it is
5. The “market” portfolio contains all risky assets available. If a risky asset, be it an obscure
bond or rare stamp, was not included in the market portfolio, then there would be no
demand for this asset and, consequently, its price would fall. Notably, the price decline
6. Both the Capital Asset Pricing Model and the Arbitrage Pricing Model rest on the assumption
that investors are rewarded with non-zero return for undertaking two activities: (1)
7.
7a. The Capital Asset pricing Model (CAPM) is an equilibrium asset pricing theory showing
that equilibrium rates of expected return on all risky assets are a function of their
covariance with the market portfolio. The CAPM is a single-index model that defines
systematic risk in relation to a broad-based market portfolio (i.e., the market index). This

return on any risky asset is a linear combination of various factors. That is, the APT
asserts that an asset’s riskiness and, hence, its average long-term return, is directly related
to its sensitivities to certain factors. Thus, the APT is a multi-factor model that allows for
as many factors as are important in the pricing of assets. However, the model itself does
not define these variables. Unlike the CAPM, which recognizes only one unchanging
(2) Industrial production;
(4) Yield curve, (i.e., slope of the term structure of interest rates.
Other researchers have identified additional factors that may influence an asset’s return.
7b. Because of APT’s more general formulation, it is more robust and intuitively appealing
than the CAPM. Many factors, not just the market portfolio, may explain asset returns.

7 – 6
8. The small firm effect refers to the tendency of small capitalization stocks to outperform
large capitalization stocks. In and of itself, such evidence would not necessarily constitute
9. A market factor of 1.2 means the mutual fund is 1.2 times as sensitive as the market
portfolio, all other factors held equal. The SMB (“small minus big”) factor is the return of
a portfolio of small capitalization stocks minus the return to a portfolio of large
10. The value of stock and bonds can be viewed as the present value of expected future
cash flows discounted at some discount rate reflecting risk. Anticipated economic
conditions are already incorporated in returns. Unanticipated economic conditions affect
returns.
Industrial production. Industrial production is related to cash flows in the traditional
discounted cash flow formula. The relative performance of a portfolio sensitive to

inflation rate, the relative performance of a portfolio sensitive to rising inflation should
decline over time. Investments in bonds are subject to significant, adverse inflation
effects. Hence, higher unanticipated inflation will negative affect portfolio values.
steeper, longer duration assets, such as long-term bonds and growth stocks, would be
negatively affected more than shorter-term assets.
11. The macroeconomic approach to identifying the factors in a multi-factor asset pricing
model tries to find variables that explain the underlying reasons for variations in the cash
flows and investment returns over time (for example, unanticipated changes in industrial
production, inflation, yield spreads). The microeconomic approach concentrates on the

7 – 8
CHAPTER 7
Answers to Problems
1. Rate of SMLc
Return
SMLb
1.0 Systematic Risk (Beta)
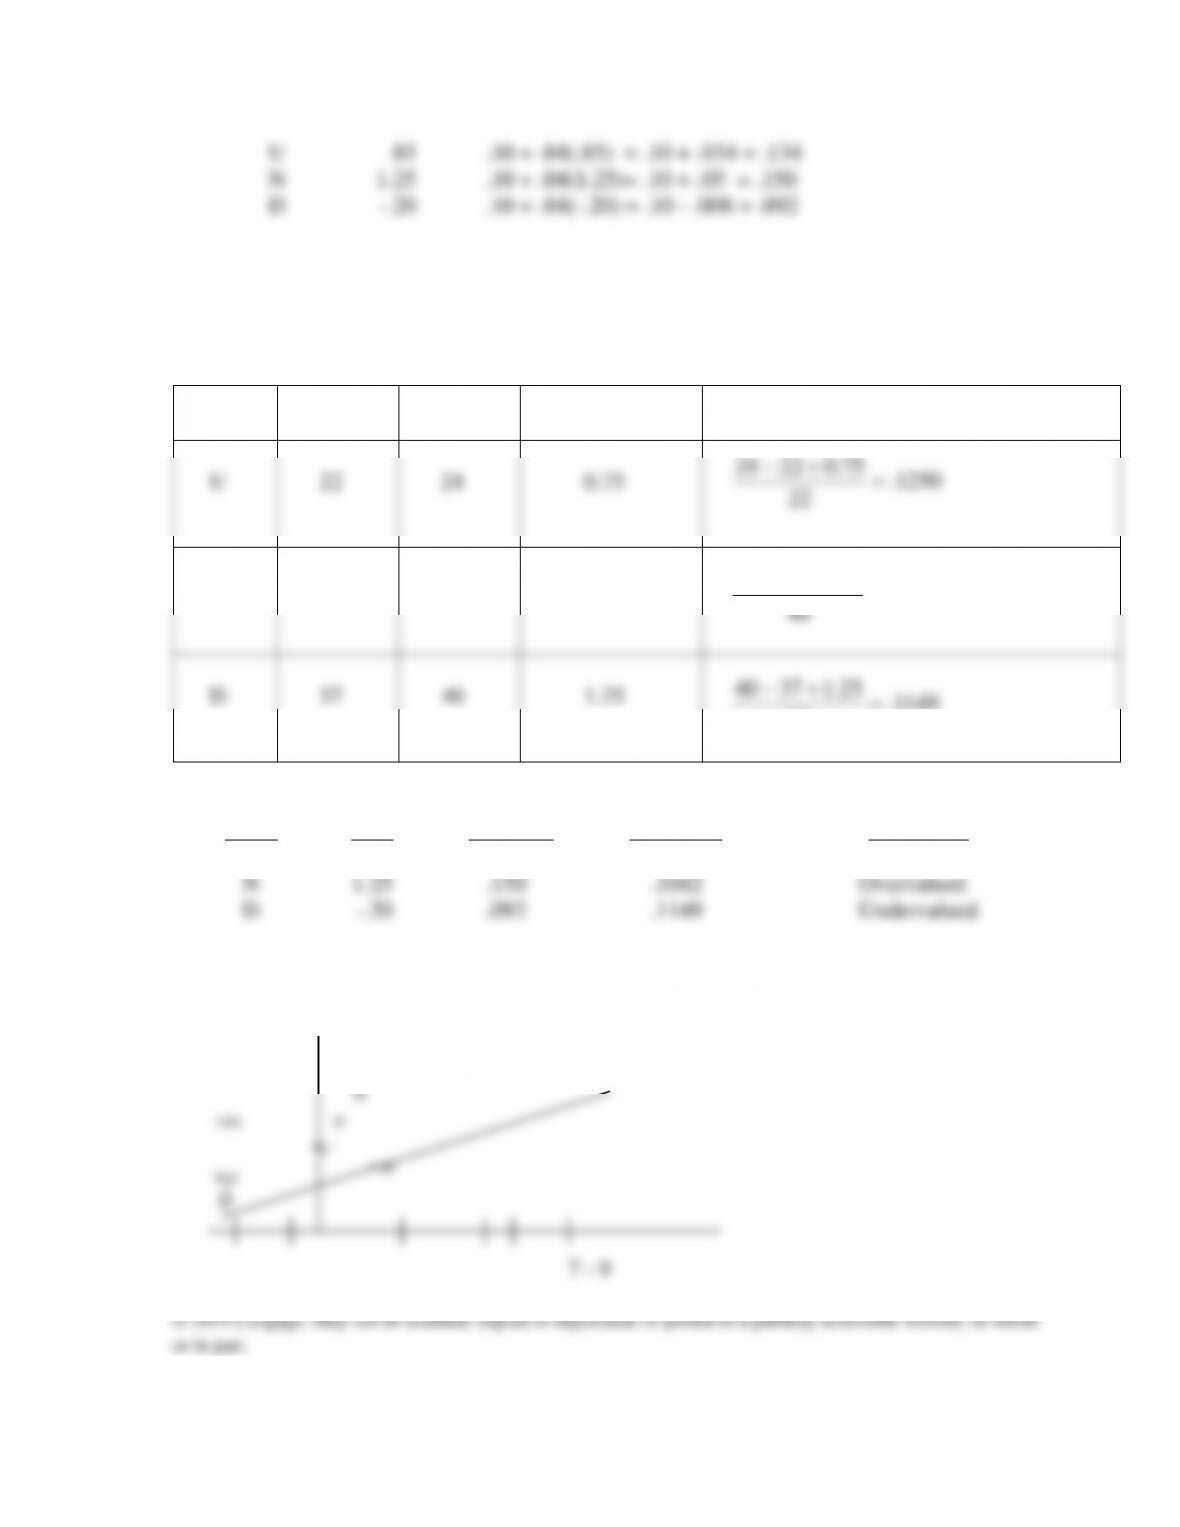
2. E(Ri) = RFR + i(RM – RFR)
2a.
Stock Beta (Required Return) E(Ri) = .10 + .04i
2b.
Stock
Current
Price
Expected
Price
Expected
Dividend
Estimated Return
U
22
24
0.75
N
48
51
2.00
D
37
40
1.25
Stock Beta Required Estimated Evaluation
U .85 .134 .1250 Overvalued
If you believe the appropriateness of these estimated returns, you would buy stock D
and sell stocks U and N.
E(R)
1250.
22
75.02224 =
+−
1042.
48
00.24851 =
+−
1149.
37
25.13740 =
+−

7 – 10
3. With a risk premium of 5% and risk-free rate of 4.5%, the security market line is:
3b. Alpha is the difference between the actual return and the expected return based on
portfolio risk:
3c. A positive alpha means the portfolio outperformed the market on a risk-adjusted basis;
it would plot above the SML. A negative alpha means the opposite, which is that the
4(a).
( )( )
mi
mi,
mi,
2
m
mi,
i
COV
r and
COV
B
=
=
583.1
003025.
00479.
(.055)
.00479
Beta 2===
For Ford:
For Anheuser Busch:
For Merck:
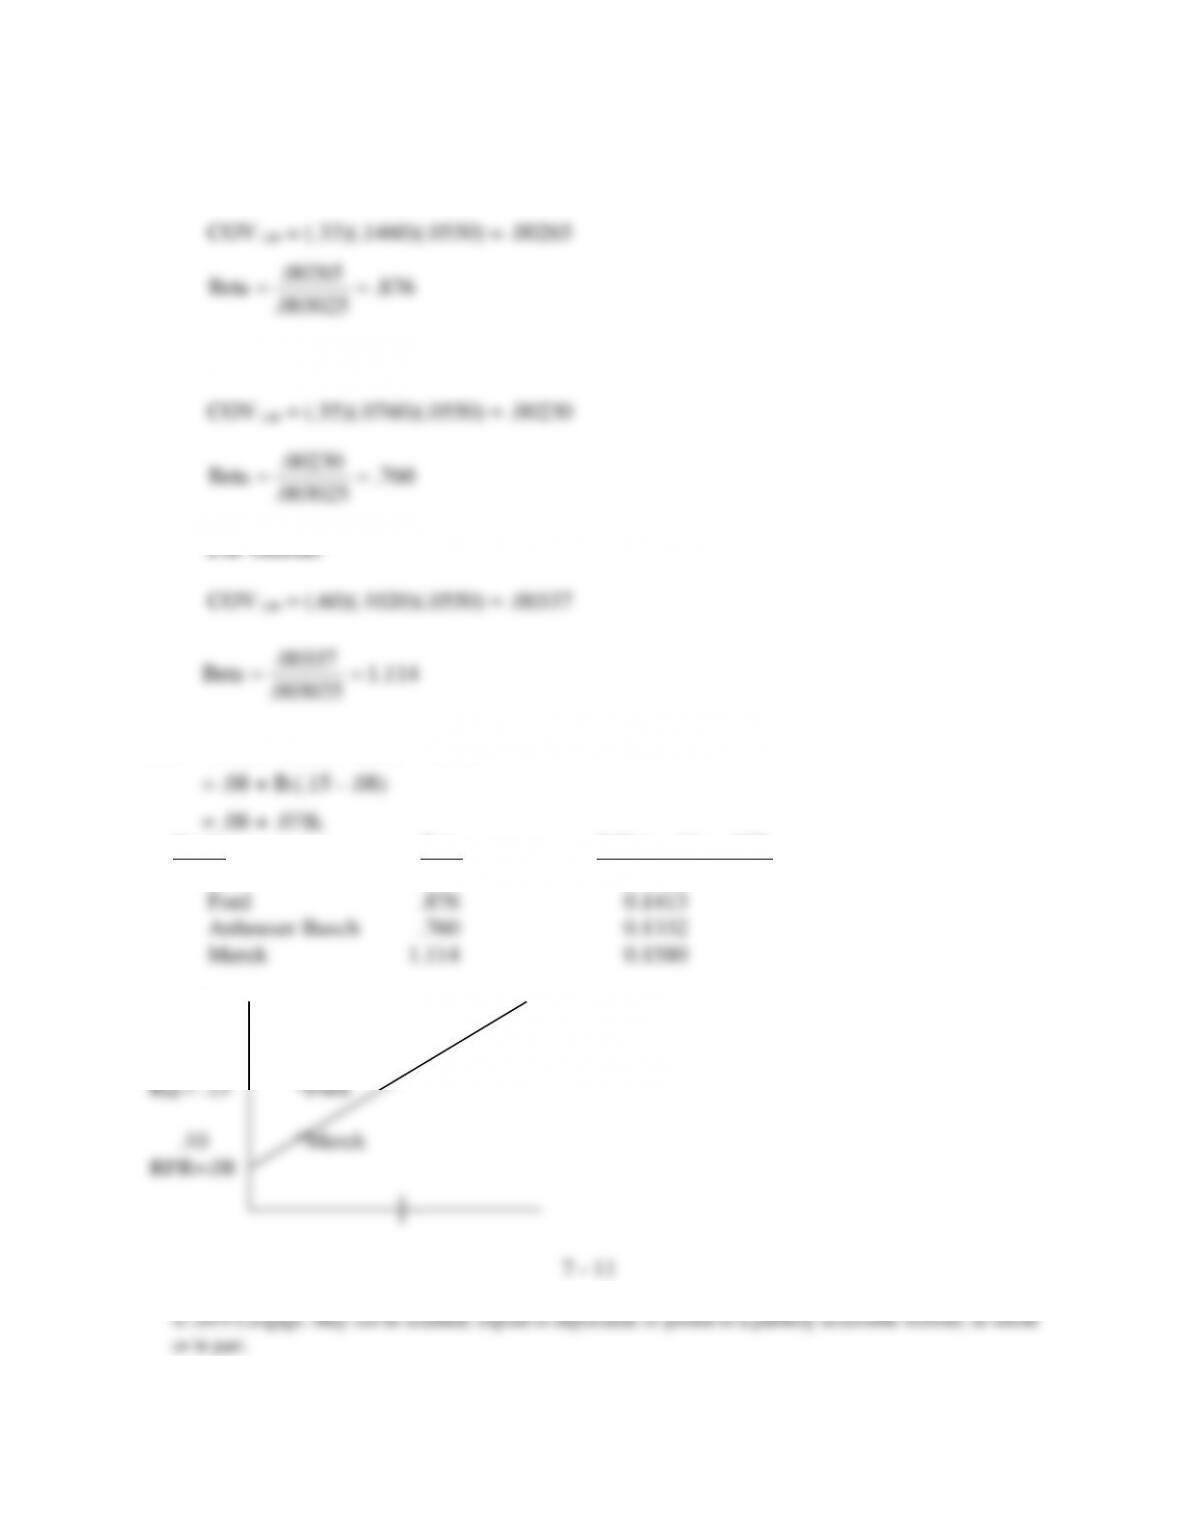
4(b). E(Ri) = RFR + Bi(RM – RFR)
Stock Beta E(Ri) = .08 + .07Bi
Intel 1.583 0.1908
4(c). .20 *Intel
*AB
876.
.003025
.00265
Beta ==
760.
.003025
.00230
Beta ==
114.1
.003025
.00337
Beta ==