CHAPTER 6
AN INTRODUCTION TO PORTFOLIO MANAGEMENT
Answers to Questions
1. Investors hold diversified portfolios in order to reduce risk, that is, to lower the variance
2. The covariance is equal to E[(Ri – E(Ri))(Rj – E(Rj))] and shows the absolute amount of
comovement between two series. If they constantly move in the same direction, it will be
3. Similar assets like common stock or stock for companies in the same industry (for
example, the auto industry) will have high positive covariances because the sales and
4. The covariance between the returns of assets i and j is affected by the variability of these
two returns. Therefore, it is difficult to interpret the covariance figures without taking
5. The efficient frontier has a curvilinear shape because if the set of possible portfolios of

6. Expected Rate B
Of Return C F
A
D
E
Expected Risk ( of Return)
7. The necessary information for the program would be:
2) the expected variance of return of each asset
8. Investors’ utility curves are important because they indicate the desired tradeoff by
9. The optimal portfolio for a given investor is the point of tangency between his set of
utility curves and the efficient frontier. This will most likely be a diversified portfolio
10. The utility curves for an individual specify the trade-offs she is willing to make between
expected return and risk. These utility curves are used in conjunction with the efficient
11. The hypothetical graph of an efficient frontier of U.S. common stocks will have a curved
shape (see the graph in the answer to question 6, above). Adding U.S. bonds to the
portfolio will likely generate a new efficient frontier that is shifted up (or to the left) of
12. The portfolio constructed containing stocks L and M would have the lowest standard
13. Standard deviation would be expected to decrease with an increase in stocks in the
portfolio because an increase in number will increase the probability of having lower and
14. Expected Rate
of Return *F
M *
P *
* B
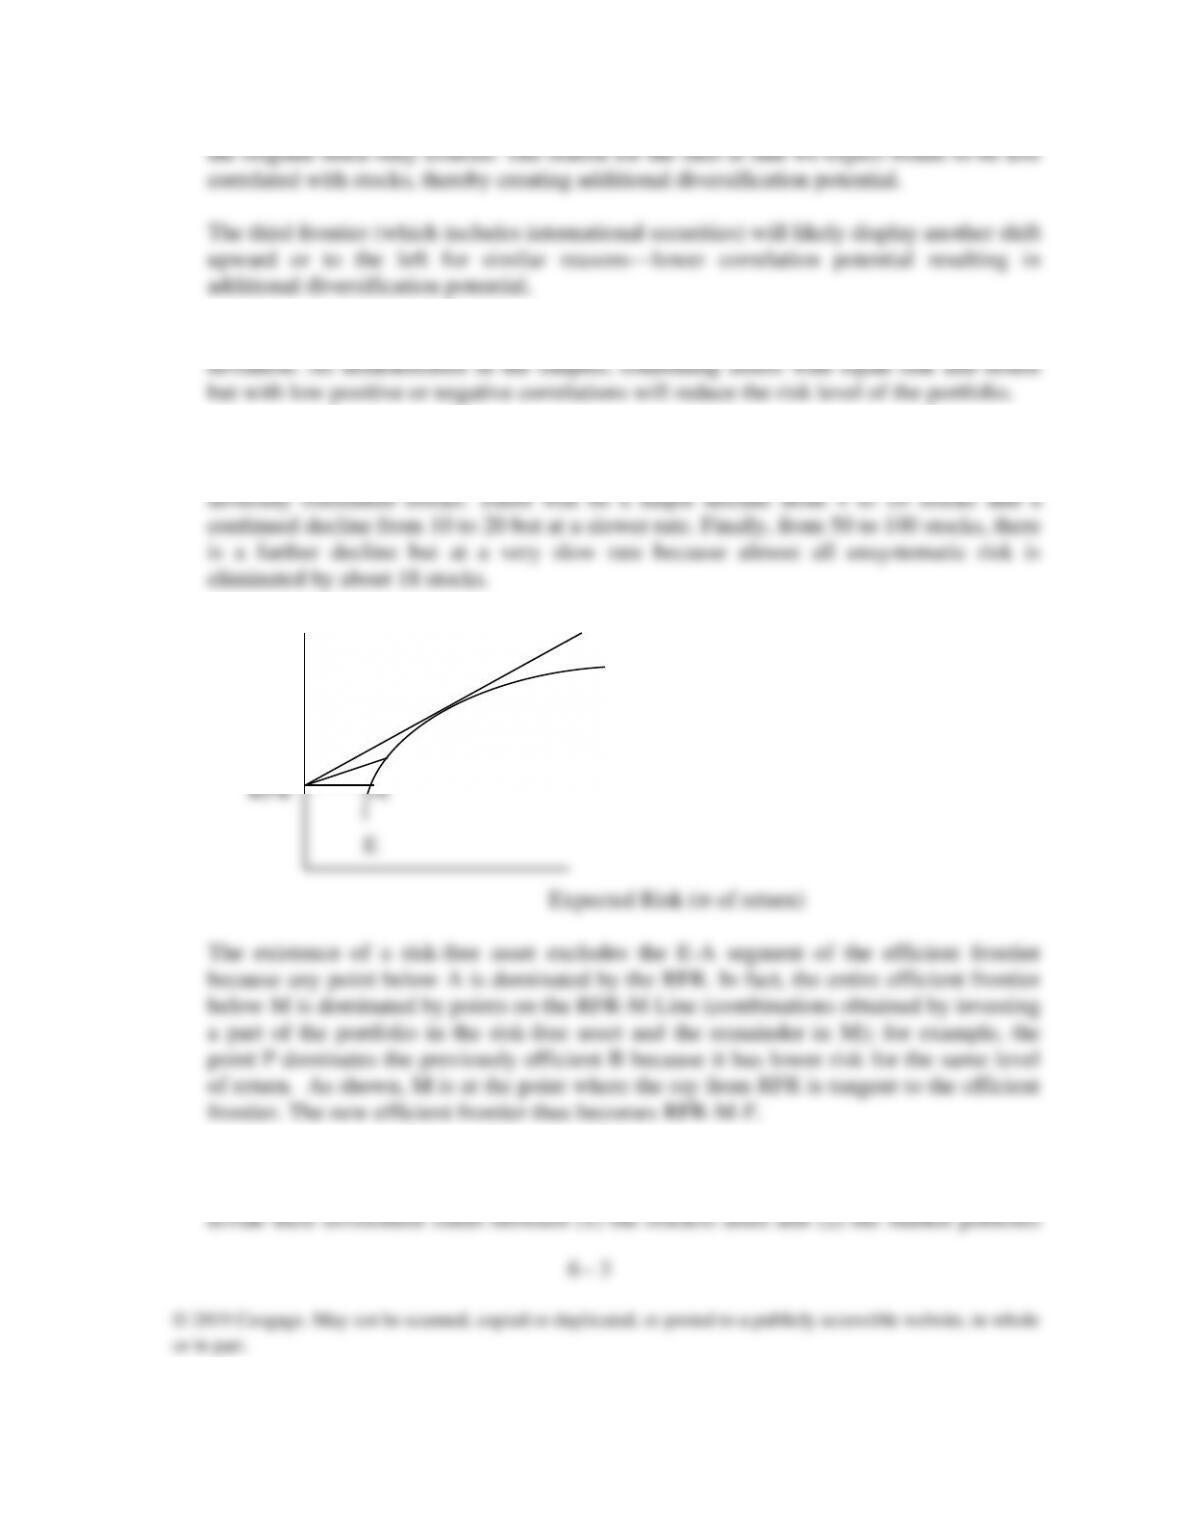
15. The CML leads all investors to invest in the same risky asset Portfolio M. The investment
prescription of the CML is that investors cannot do better, on average, than when they

6 –
4
CHAPTER 6
Answers to Problems
1. [E(Ri)] for Lauren Labs
Possible Expected
Probability Returns Return
0.10 -0.20 -0.0200
0.20 0.10 0.0200
0.20 0.20 0.0400
2.
Market
Security
Return
Portfolio
Return
Stock
Value
Weight
(Ri)
Wi x Ri
Disney
$15,000
0.160
0.14
0.022
Starbucks
17,000
0.181
-0.04
-0.007
Harley Davidson
32,000
0.340
0.18
0.061
Intel
23,000
0.245
0.16
0.039
Walgreens
7,000
0.074
0.05
0.004
TOTAL
94,000
1.0000
0.119
3. Madison Sophie [Ri-E(Ri)] x
Month Cookies(Ri) Electric(Rj) Ri-E(Ri) Rj-E(Rj) [Rj-E(Rj)]
1 -.04 .07 -.057 .06 -.0034
2 .06 -.02 .043 -.03 -.0013

3(d).
One should have expected a positive correlation between the two stocks, as they tend to
4. E(R1) = .15 E(1) = .10 w1 = .5
E(R2) = .20 E(2) = .20 w2 = .5
6758.
006510.
0044.
)0908(.)0717(.
0044.
rij
=
=
=

The negative correlation coefficient reduces risk without sacrificing return.
5. For all values of r1,2:
E(Rport) = (.6 x .10) + (.4 x .15) = .12
08062.
0065.
)006.(01.0025.
)60.)(20)(.10)(.5)(.5(.2)20(.)5(.)10(.)5(. 2222
p
=
=
−++=
−++=
Expected
Return 17.5%
0
X X
8.06% 12.85% Risk (Standard deviation)
)r(00072.000724.
)r(00072.0004.000324.
)r)(05)(.03)(.4)(.6(.2)05(.)4(.)03(.)6(.
1,2
1,2
1,2
2222
port
+=
++=
++=

0419.001755.00063.000225.0009.
)70)(.06)(.04)(.25)(.75(.2)06(.)25(.)04(.)75(. 2222
p
==++=
++=
0463.00214.00084.0009.0004.
)70)(.06)(.04)(.50)(.50(.2)06(.)50(.)04(.)50(. 2222
p
==++=
++=

.01306 .00653/5
2
7. DJIA S&P Russell Nikkei
Month (R1) (R2) (R3) (R4) R1-E(R1) R2-E(R2) R3-E(R3) R4-E(R4)
1 .03 .02 .04 .04 .01667 .00333 .01333 .00833
7(a).
7(b). 1 = (.01667)2+ (.05667)2+ (-.03333)2+ (-.00333)2+ (.03667)2 + (-.07333)2
= .00028 + .00321 + .00111 + .00001 + .00134 + .00538 = .01133
0525.002755.00063.002025.0001.
)70)(.06)(.04)(.75)(.25(.2)06(.)75(.)04(.)25(. 2222
p
==++=
++=
0584.0034126.00015960.003249.000004.
)70)(.06)(.04)(.95)(.05(.2)06(.)95(.)04(.)50(. 2222
p
==++=
++=
03167.
6
.19
)E(R 02667.
6
.16
)E(R
01667.
6
.10
)E(R 01333.
6
.08
)E(R
43
21
====
====
.00226 .01133/5
2
1==

6 –
10
2 = (.01306)1/2 = .0361
3 = (.01333)2 + (.07333)2 + (-.06667)2 + (.00333)2 + (.08333)2 + (-.106672)2
7(c).
7(d). Correlation equals the covariance divided by each standard deviation.
Correlation (DJIA, S&P) = 0.001678/ [(0.0476)(0.0361)] = .9765
.001058 .00529/5
2
4==
.002054– .01027/5– 5
.00302 – .00097 – .00004 – .00256 – .00379 – .00011
COV
.001054– .00527/5– 5
.00161 – .00027 – .00016 – .00102 – .00224 – .00003
COV
.002604 .01302/5 5
.00604 .00194 .00004 .00178 .00318 .00004
COV
.001678 .00839/5 5
.00416 .00086 .00004 – .00089 .00246 .00006
COV
3,4
2,4
2,3
1,2
==
=
==
=
==
+++++
=
==
++++
=
6 –
11
7(e).
8.
9.
9a. E(Rproposed) = (.5)(.086) + (.3)(.056) + (.2)(.071) = .0598 = 5.98%
9b.
σ2proposed = [(.5)2(.152) 2 + (.3) 2 (.0086) 2 + (.2) 2 (.117) 2]
+ {[2(.5)(.3)(.152)(.086)(.002614)]+[2(.5)(.2)(.152)(.117)(.01067)]
9c. Risk premium for current allocation = [7.40 – 3.1]/10.37 = 0.415
.02417 7)(.5)(.0316 7)(.5)(.0166 E(R)
009875.
)001054.)(5)(.5(.2)0325(.)5(.)0361(.(.5)
.02167 7)(.5)(.0266 7)(.5)(.0166 E(R)
05518.
)002604)(.5)(.5(.2)0753(.)5(.)0361(.(.5)
2,4
2222
2,4
2,3
2222
2,3
=+=
=
−++=
=+=
=
++=
0.3759
266
100
14 x 19
100
Cov
r
ji
ji,
ji, ====
6 –
12
10.
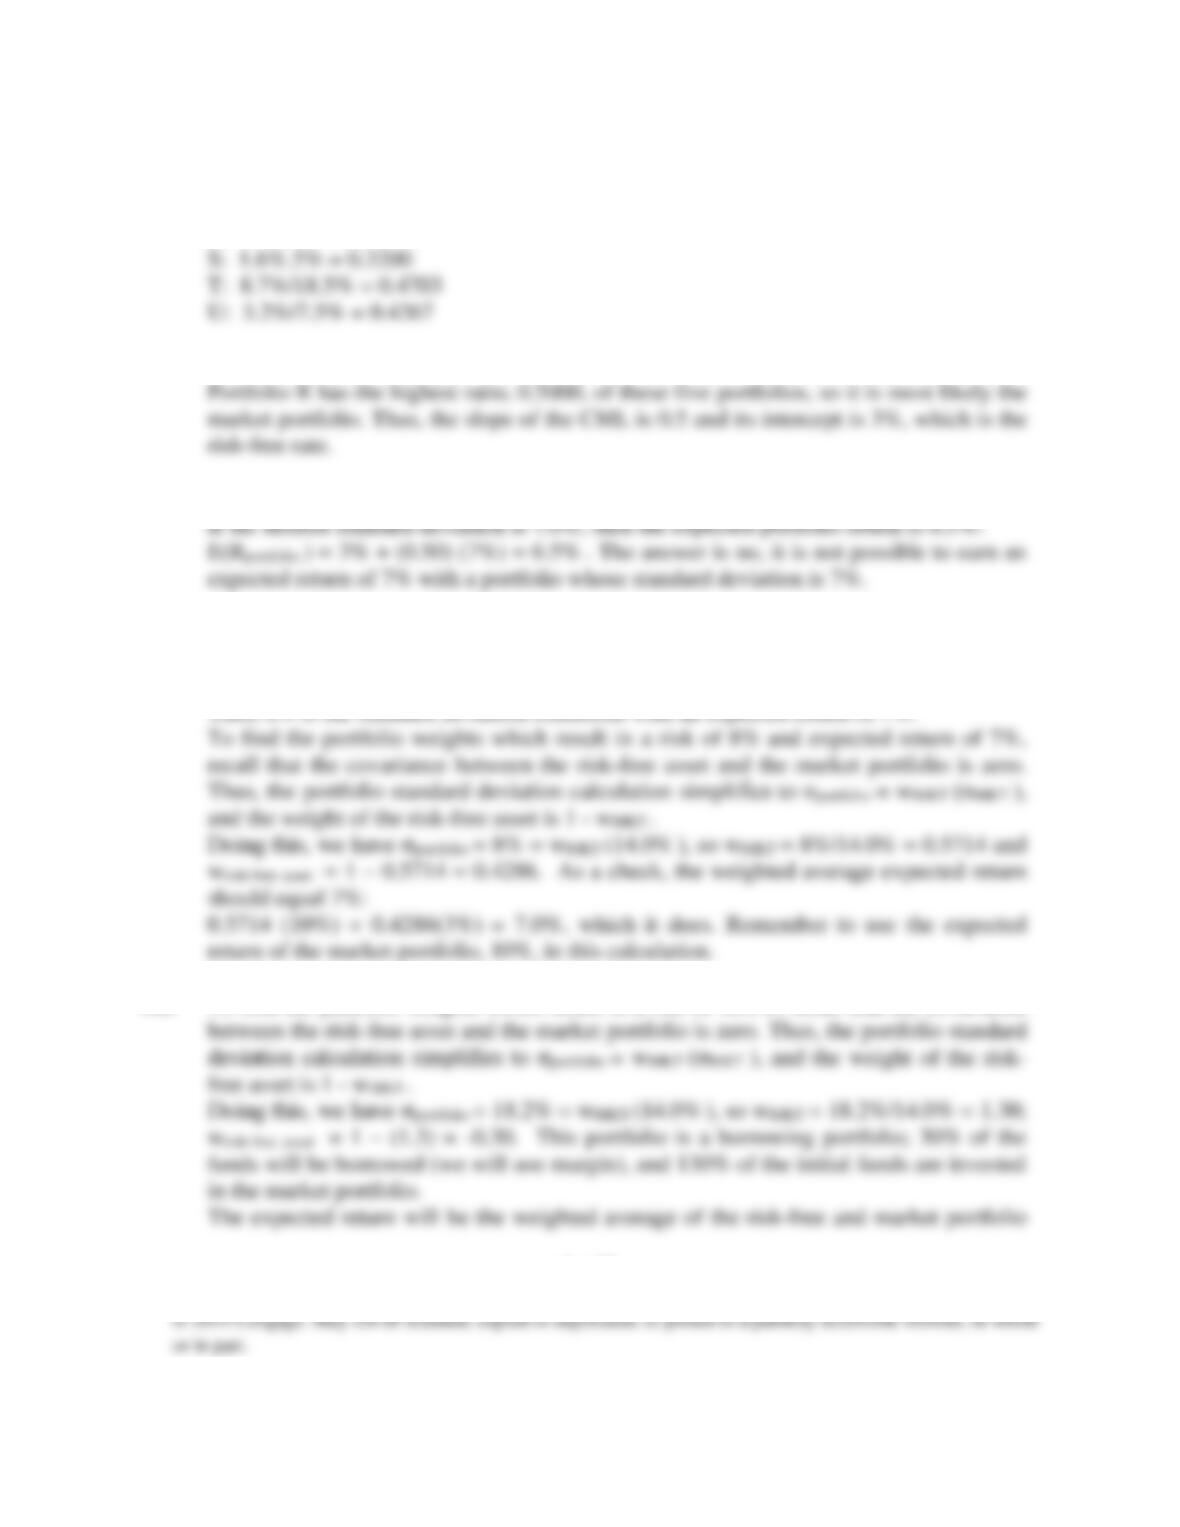
10a. Q: 4.8%/10.5% = 0.4571
R: 7%/14% = 0.5000
10b. The CML slope, [E(RMKT ) – RFR ]/ σMKT , is the ratio of risk premium per unit of risk.
10c. The CML equation, based on the above analysis, is E(Rportfolio ) = 3% + (0.50) σportfolio .
10d. Using the CML equation, we set the expected portfolio return equal to 7% and solve for
the standard deviation:
E(Rportfolio ) = 7% = 3% + (0.50) σportfolio ➔ 4% = (0.50) σportfolio ➔ σ = 4%/0.50 = 8%.
Thus, 8% is the standard deviation consistent with an expected return of 7%.
10e. To find the portfolio weights which result in a risk of 18.2%, recall that the covariance

6 –
13
returns:
APPENDIX 6
Answers to Problems
Appendix A
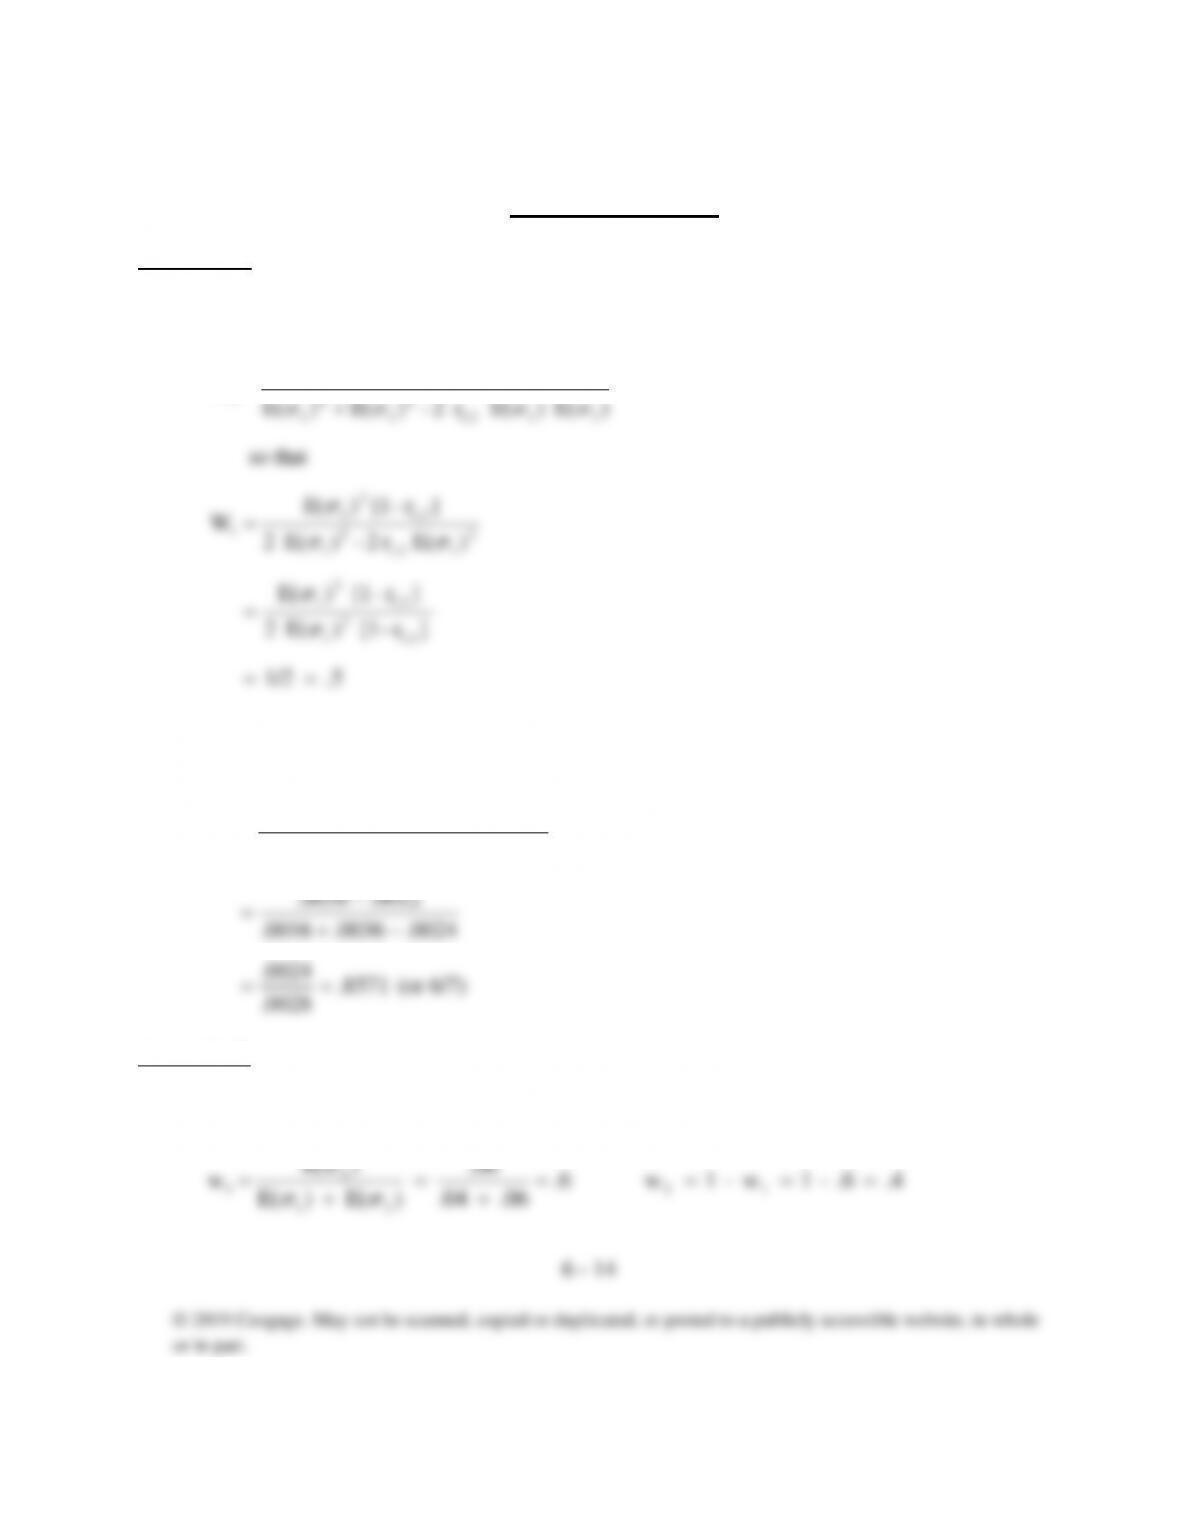
1(a). When E(1) = E(2), the problem can be solved by substitution,
1(b).
Appendix B
Variance of the portfolio is zero when:
.5 1/2
]r–[1 )E( 2
]r–[1 )E(
)E( r 2 – )E( 2
]r – [1 )E(
W
thatso
)E( )E( r 2 – )E( )E(
)E( )E( r – )E(
W
1,2
2
1
1,2
2
1
2
11,2
2
1
1,2
2
1
1
111,2
2
1
2
1
111,2
2
1
1
==
=
=
+
=
6/7)(or 8571.
0028.
0024.
0024.0036.0016.
0012.0036.
)06)(.04)(.5(.2)06(.)04(.
)06)(.04)(.5(.(.06)
W 22
2
1
==
−+
−
=
−+
−
=
.4 .6 – 1 w– 1 w 6.
.06 .04
.06
)E( )E(
)E(
w 12
21
2
1====
+
=
+
=