
Chapter 6 The Trade-Off Between Risk and Return
Chapter Overview
The Opening Focus looks at a report produced by an Australian financial advisory firm – Wealth
Opening Focus Discussion Question:
1. What determines whether an investor chooses a high risk or a low risk portfolio? Note that this
is an opinion question, and the discussion can bring out factors that might influence this deci-
sion. For example, retirees would be expected to have more conservative investments, since
This chapter discusses:
6-1 Understanding Returns
6-2 The History of Returns (or How to Get Rich Slowly)
6-4 The Power of Diversification
Technology
2. Smart Excel shows how to solve a standard deviation problem using Excel
3. Smart Ethics Video quotes Utpal Bhattacharya of Indiana University concerning insider trad-
ing. He points out that the cost of equity for companies goes up when insider trading laws are
5. Smart Solutions shows step-by-step solution to Problem 6-5, calculating total return, in dollars
and in percentage terms.
6. Smart Solutions shows step-by-step solution to Problem 6-17, estimating return probabilities.

154 Instructor’s Manual
7. Smart Excel shows an excel solution to Problem 6-23, calculating portfolio return for a two-
stock portfolio.
Lecture Guide
This chapter details the relationship between risk and return. It looks at individual security risk and
portfolio risk and introduces the Capital Asset Pricing Model. This chapter looks at the questions:
• What kinds of risk exist?
The Trade-off between Risk and Return
6-1 Understanding Returns
The basic relationship between risk and return is that return depends on risk and the greater the
risk, the greater the required return. Note the difference between risk and uncertainty. Uncertainty
is unquantified risk. If I buy a lottery ticket, I hope I win the lottery. Risk quantifies this uncer-
tainty – I have a 0.00000001 chance of winning the lottery.
One of the main goals in finance is to determine if an investment will be wealth increasing.
sets.
• Student Interaction: Students can be asked about the form of returns from various in-
vestments. How do stocks provide return? What happens in down markets when ex-
pected price appreciation fails to occur? How do bonds, real estate, collectibles,
futures, etc. provide value? How certain are returns from each of these investments?
6-1a The Components of Total Return
6-1b Dollar Returns and Percentage Returns
Return on a stock is the sum of its dividend yield plus its capital gains yield. Dollar returns

Chapter 6 The Trade-Off Between Risk and Return 155
• Student Interaction: Ask students which is riskier, a stock that pays dividends or a
stock that does not pay dividends and only has capital gains? Most will say that the
capital gains only stock is riskier, since all of its yield is uncertain, whereas the divi-
dend paying stock at least has a reasonably certain dividend yield. The yield on an in-
and received an additional $1 dividend at the end of year 2. Dollar returns are now:
Year 0 Year 1 Year 2
-$25 $1 dividend $1 dividend plus $35 share price, a capital gain of $10
The dollar return is $1 in year 1 and $11 in year 2. The percent return can be calculated using
Chapter 3’s present value techniques. The IRR of the cash flows above is 22%. Terrell received a
22% return each year.
6-2a Nominal and Real Returns on Stocks, Bonds and Bills
Fig. 6.3 The Real Value of $1 invested in Stocks, Treasury Bonds or Bills, 1900-2010
Table 6.1 Percentage Returns on Bills, Bonds, and Stocks, 1900–2010
In most time periods, stocks have outperformed bonds. One exception was during the de-
pression decade and another period is now, when bonds are generally outperforming stocks. Bonds
have sometimes had negative real returns, which means that bond income has not kept pace with
inflation and investors in bonds lost purchasing power in those time periods. A recent study by
Wharton professor Jeremy Siegel found that stocks are not as risky when held over the very long
term. Helooked at 200 years of trading stocks and bonds and found that in the worst 20 year period
for stocks, stocks rose 20%. In the worst 20 year period for bonds, bonds lost 60%. So, while
bonds are less risky than stock in the short run, stocks return more over time.
• Student Interaction: Ask students to look at the Table 6.1. Students should make note
Fig. 6.4 Nominal Returns on Stocks, Treasury Bonds, and Bills, 1900–2010

156 Instructor’s Manual
Table 6.2 Risk Premiums for Stocks, Bonds, and Bills, 1900–2010
6.3 Volatility and Risk
6.3a The Distribution of Historical Stock Returns
Take a moment to review the statistical concepts of the bell curve or normal distribution
Fig. 6.5 Histogram of Nominal Returns on Equities, 1900–2006
6.3b Variability of Stock Returns
We can’t make decisions about investments by looking at returns alone. We also need to
look at the risk of the security. Investors want to know if they are getting a sufficient return for the
level of risk of the security. Expected return tells the level of rewards from an investment. We
Table 6.3 Estimating the Variance of Stock Returns from 1993-2010
Table 6.4 Average Returns and Standard Deviation for Equities, Bonds, and Bills, (1900–
2010)
Fig. 6.6 The Relationship Between Average (Nominal) Return and Standard Deviation for
Stocks, Treasury Bonds, and Bills, 1900 – 2010
As expected, stocks have higher standard deviations than bonds or Treasury securities.
6.4 The Power of Diversification
While portfolio risk is the weighted average of the risks of the securities in the portfolio,
portfolio variance is not a simple weighted average. One concept that is sometimes difficult for

Chapter 6 The Trade-Off Between Risk and Return 157
students to understand is that high risk assets can be combined in a portfolio to create a low risk
As you add more stocks that are not perfectly positively correlated to a portfolio, you will
reduce portfolio risk. It paints a very dramatic picture to show students the equations for variance
for a three-asset portfolio (3 variance terms and 6 covariance terms), a four asset portfolio (4 vari-
ance terms and 12 covariance terms), a five asset portfolio (5 variance terms and 20 covariance
terms), a six asset portfolio (six variance terms and 30 covariance terms) and a seven asset portfolio
portfolio of Russian government bonds, Bank of Vienna bonds, English colonial securities, gov-
ernment loans from Germany and Spanish Canal loans. This created a portfolio with international
diversification! Sometimes diversification can be of benefit to investors but is impossible to ac-
complish. For example, markets of countries at war will have negatively-correlated markets. Dur-
ing World War II, the German and French markets were indeed negatively correlated. But it is
unlikely that investors could benefit from this – markets were closed, it would have been unpatriot-
ic to own securities of an enemy country and it would have been difficult to accomplish the trans-
actions even if desired.
• Student Interaction: Ask students if diversification is useful for investors or companies
Table 6.5 Average Returns and Standard Deviations for 10 Stocks from 1993-2010
Figure 6.7 Annual Returns on Coca-Cola and Archer Daniels Midland (ADM)

158 Instructor’s Manual
in the Portfolio
6.4a Systematic and Unsystematic Risk
• Student Interaction: Students can be asked for examples of systematic risk (inflation,
changes in country growth) and unsystematic risk (unions strike, hurricane damage to
Florida citrus crops).
•
Several studies have shown that individuals are not as diversified as they should be. One study
Another study of brokerage accounts found that investors are not as diversified as they should
be. In particular, low income people and people in non-professional jobs tend to have the least di-
versified portfolios. Younger, more active investors also tend to have under-diversified portfolios,
while older and wealthier investors tend to have the most diversified portfolios. Active portfolios,
in other words, those with the most turnover in stocks, had the lowest returns. This study looked at
funds, which own large numbers of stocks and may require small minimum invest-
ments.
• Student Interaction: Ask students if a stock can have a high total risk and a low market
risk. While most of the time stocks with high total risk also have high market risk,
there are exceptions. For example, Holly Sugar has high total risk and low market risk.

Chapter 6 The Trade-Off Between Risk and Return 159
Despite the benefits of international diversification, most people invest heavily in their domes-
tic securities. For example, Americans portfolios are about 93% invested in U.S. securities. Japa-
nese investor portfolios are 98% invested in Japanese stocks. There is a home bias, in other words,
people want to invest in companies they are familiar with. One study found that in every state ex-
6.4b Risk and Return Revisited
Figure 6.9 Average Return and Standard Deviation for 10 Stocks, 1993-2010
Figure – Real Equity Returns and Risk Premiums Around the World 1900–2010
Conclusion
Ch. 5 Resource Articles
“Searching for Perfection,” Money Management, May 5, 2011. This article discusses the need for
diversification in today’s volatile investment climate. It discusses the best way to correlate invest-
Enrichment Exercises
1. Illustrate the concept of risk aversion using a jar with slips of paper. Tell students you have a
jar with 20 pieces of paper. One says “you win $100” and the other 19 say “sorry, you lose.”
Ask how many students will pay you $10 for the right to draw one slip of paper from the jar.

160 Instructor’s Manual
2. Ask students if the stock market and individual stocks are more volatile today than in the past.
Give them a few minutes to discuss this issue. Most will believe individual stocks are more
volatile and there may be some debate about whether the market as a whole is more volatile.
After the discussion, present information from a recent study by Campbell, Lettau, Malkiel and
Xu. This study looked at 9,000 firms from 1962-97. They decomposed the stock into market-
wide, industry-wide and firm-specific volatility. They found that while there were periods of
increased volatility, for example, during the oil crisis in the 1970s, average market volatility, as
measured by standard deviation has remained relatively stable over time – 14% in the 1970s,
of 20 stocks brought portfolio standard deviation down to 10%, which is considered to repre-
sent complete diversification. From 1986 to 1997, a portfolio of 50 stocks was needed to
achieve a standard deviation of 10%. A University of Nevada study at about the same time
found that 100 stocks were needed to achieve complete diversification. The University of Ne-
• Conglomerates were more common in the past than today. Conglomerates are naturally
diversified and less volatile, representing mini-portfolios of unrelated businesses. Now the
emphasis is on focusing on a core business rather than a number of unrelated businesses.
• Large stocks tend to be increasingly held by institutions, investors who tend to behave sim-
ilarly. Managers tend to buy and sell the same stocks at the same time. A related study by
Malkiel and Xu found that some stocks are more volatile when the proportion of institu-
tional investors is high.

Chapter 6 The Trade-Off Between Risk and Return 161
Answers to Concept Review Questions
1. The coupon is a dollar return measure that focuses only on the income component—on only
one component of total return. The coupon rate and coupon yield are percentage return
2. The total dollar return on the stock you bought for $40 is $6 – $4 for the price increase and $2
3. Investors need to pay attention to both real and nominal returns because, while nominal returns
measure the dollar value increase in an investment, only real returns can measure the increase
5. Table 6.1 shows that sometimes, though not often, an asset’s nominal return may be higher
than its real return When inflation is positive, the nominal return is always higher than the re-
ure 6.2. This illustrates that during deflation, real returns are higher than nominal returns.
7. If nominal bond returns approximately follow a normal distribution, 95 percent of bond returns
should fall within two standard deviations of the mean. Using data from Table 6.4, lower end-
point of the range for bond returns is−11.0% (5.6% − 2 8.3%) and the upper endpoint is
8. A standard deviation halfway between the standard deviation of stocks and bonds would be
9. Individual assets contain both systematic and unsystematic risk. When we combine these assets
in a portfolio, the unsystematic risks cancel out, leaving only the systematic risk. Therefore, a

162 Instructor’s Manual
10. Figure 6.8 declines steeply at first and then flattens out because as we add more stocks to a
portfolio, the unsystematic risks of the individual stocks begin to cancel out. This effect is quite
pronounced when diversification begins (i.e., when we have two stocks rather than one or three
11. The dots in Figure 6.9 appear to be almost randomly scattered because these dots represent in-
dividual stocks’ risk. The market should reward riskier investments with higher returns, but on-
ly if by the term “riskier” we mean “systematically riskier.” The unsystematic risk of a given
investment doesn’t matter because investors can eliminate that risk at virtually no cost by di-
Answers to Self-Test Problems
ST6-1. Using Table 6.3, calculate the standard deviation of stock returns from 2006-2010. Over
the last five years, were stocks more or less volatile than they were over the last eighteen
years?
A: The table below illustrates the calculations need to solve this problem. First, calculate the
average return. Next, subtract that average from each year’s actual return, then square that
Chapter 6 The Trade-Off Between Risk and Return 163
Year
Return (%)
Return – Average
Squared Difference
2006
15.8
9.8
90.0
2007
-0.4
0.2
2009
28.5
22.5
Sum
29.8
Average Return (%)
6.0
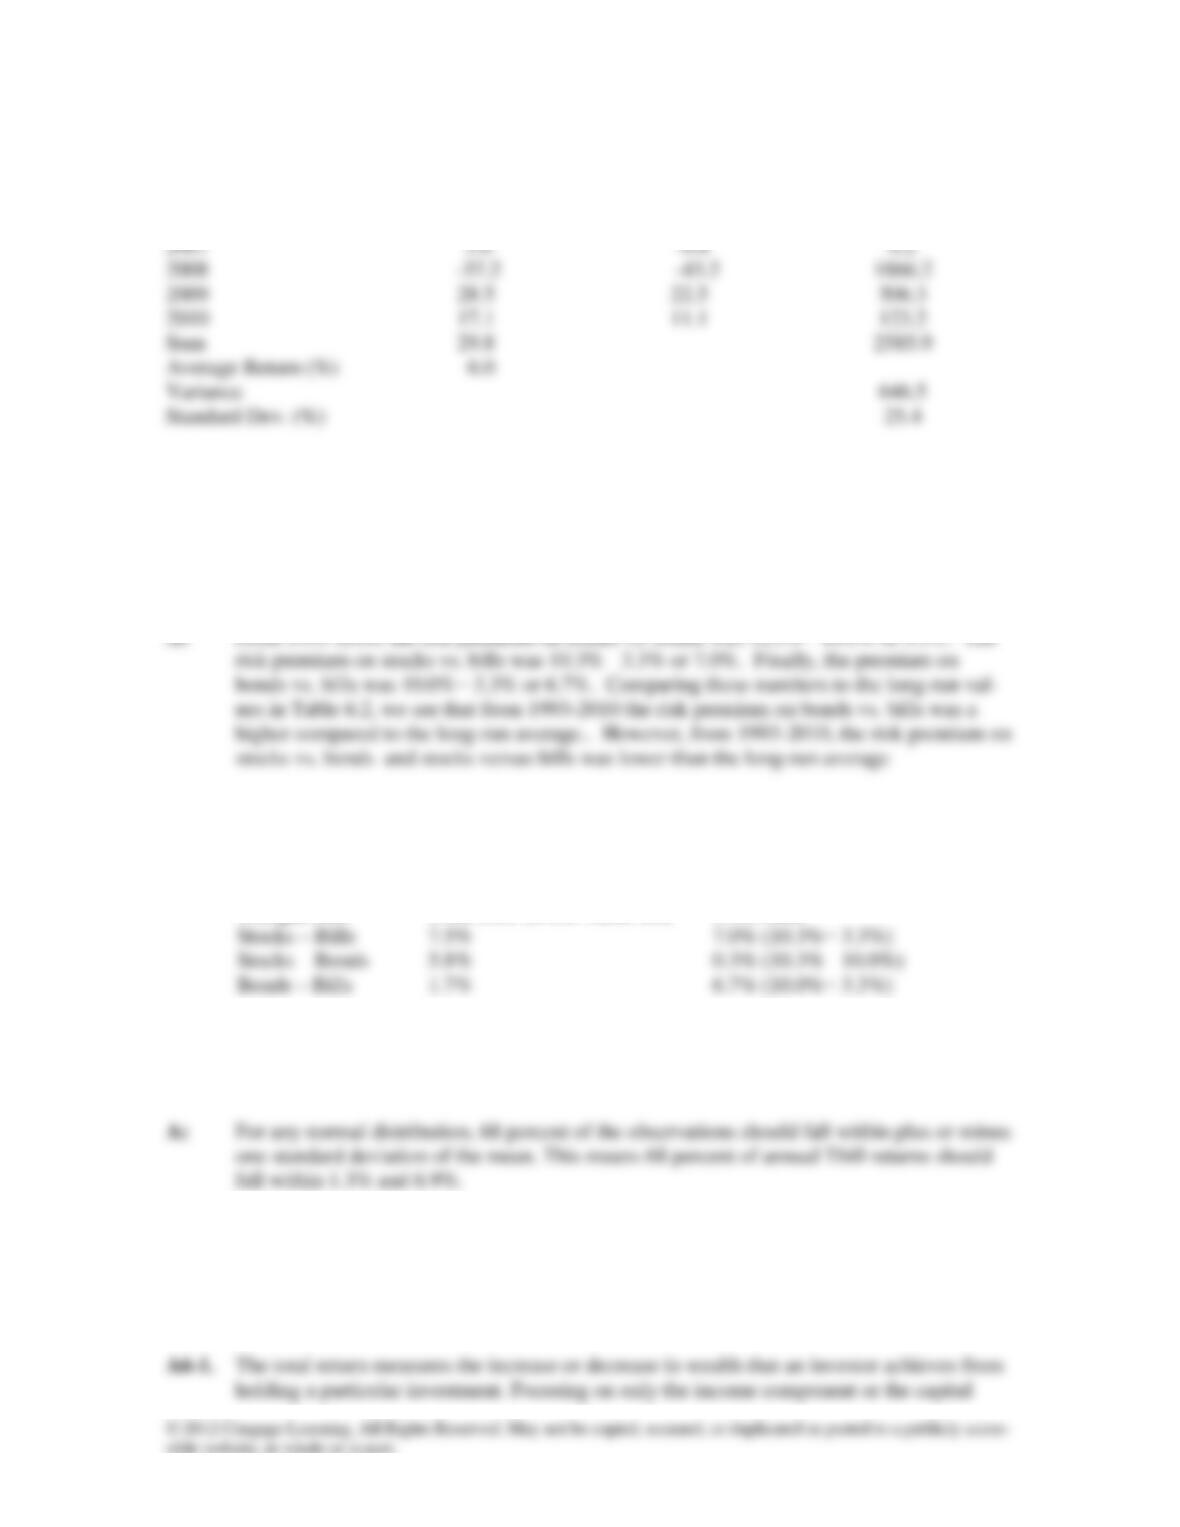
ST6-2. Table 6.3 shows that the average return on stocks from 1993-2010 was 10.3 percent. Not
shown in the table are the average returns on bonds and bills over the same period. The av-
erage return on bonds was 10.0 percent, and for bills the average return was 3.3 percent.
From these figures, recalculate the risk premiums for 1993-2010 and compare recent histo-
ry to the long-run numbers.
Table 6.2 (Revised) – A Comparison of Risk Premiums
Risk Premium
Comparison
1900-2003 (from Table 6.2)
1994-2006
Stocks – Bills
7.5%
7.0% (10.3%− 3.3%)
Bonds – Bills
1.7%
6.7% (10.0%− 3.3%)
ST6-3. Suppose that Treasury bill returns follow a normal distribution with a mean of 4.1 percent
and a standard deviation of 2.8 percent. This implies that 68 percent of the time, Tbill re-
turns should fall within what range?
Answers to End-of-Chapter Questions
Q6–1. Why is it important to focus on total returns when measuring an investment’s perfor-
mance?

164 Instructor’s Manual
Q6–2. Why do real returns matter more than nominal returns?
Q6–3. Under what conditions will the components of a bond’s return have the opposite sign?
Q6–4. Explain why dollar returns and percentage returns can sometimes send conflicting signals
when you are comparing two different investments.
A6-4. If the two investments require the same amount of money up front, this will not usually be
Q6–5. Do the rankings of investment alternatives depend on whether we rank based on nominal
returns or real returns?
A6-5. Nominal and real returns provide different measures of an investment’s absolute returns,
Q6–6. Look at Table 6.1. Compare the best and worst years for T-bills in terms of their nominal
returns, and then compare the best and worst years in terms of real returns. Comment on
what you find.
A6-6. The spread between the best and worst years is 14.7% in nominal terms and 34.8% in real
Q6–7. Over the last 111 years, 1981 was the top year for nominal bill returns and 1982 was the
top year for nominal bond returns. Why do you think that these two years saw such high
returns on bonds and bills?
A6-7. The answer is that the inflation rate was quite high at this time. Remember that the nominal

Chapter 6 The Trade-Off Between Risk and Return 165
Q6–8. Table 6.2 calculates the risk premiums on stocks and bonds relative to T-bills by taking the
difference in average nominal total returns on each asset class. Would these risk premiums
be much different if we calculated them using real rather than nominal returns?
A6-8. The risk premiums would be about the same. When we convert nominal returns into real
returns, we (approximately) subtract the inflation rate from the nominal return to get the
Q6–9. When measuring the volatility of an investment’s returns, why is it easier to focus on
standard deviation rather than variance?
A6-9. The units of measure in a variance calculation are percent squared which is hard to inter-
Q6-10. Are there diminishing returns to risk taking?
A6-10. No. From Figure 6.6, it appears that the relationship between risk and return is linear. The
more risk you take, the higher return you earn with no sign that the incremental return falls
Q6-11. Notice in Table 6.5 that the the average standard deviation among the ten stocks is 31.4%,
yet Figure 6.8 shows that a portfolio comprised of ten stocks has a standard deviation of
about 20%. Explain why these two figures are not equal.
A6-11. The standard deviation of a portfolio of stocks will generally be less than the average
standard deviation of the stocks in the portfolio. For a single stock, the standard deviation
Q6-12. Look at Figure 6.9. Suppose you had to invest all of your money in just one of these stocks
(excluding Intel). Which one seems most attractive and why? Which stock seems least at-
tractive?