C06
Chapter 6 Spreadsheet Problem Solutions (C06)
PARTS a – c
INPUT DATA: KEY OUTPUTS:
18
$1,584.48
10% Capital gains yield this year -1.31%
1Current yield this year 6.31%
MODEL-GENERATED DATA:
Years to
Maturity
Beginning of Year
Value ($)
End of Year
Value ($)
Capital Gains
($)
Capital Gains
Yield (%)
Interest ($)
Current Yield
(%)
Total Yield
(%)
20
19
18 $1,584.48 $1,563.70 ($20.78) -1.31% $100 6.31% 5.00%
17 $1,563.70 $1,541.89 ($21.81) -1.39% $100 6.40% 5.00%
16 $1,541.89 $1,518.98 ($22.91) -1.49% $100 6.49% 5.00%
15 $1,518.98 $1,494.93 ($24.05) -1.58% $100 6.58% 5.00%
14 $1,494.93 $1,469.68 ($25.25) -1.69% $100 6.69% 5.00%
PARTS d & e
INPUT DATA: KEY OUTPUTS:
Original maturity (years)
Current price (P0)
Coupon rate of interest
Interest payments per year
Bond Valuation
1. There are a number of instructions with which you should be familiar to use these computerized models. These
3. The model is set up so that you can solve for bonds with maturitues up to 20 years.
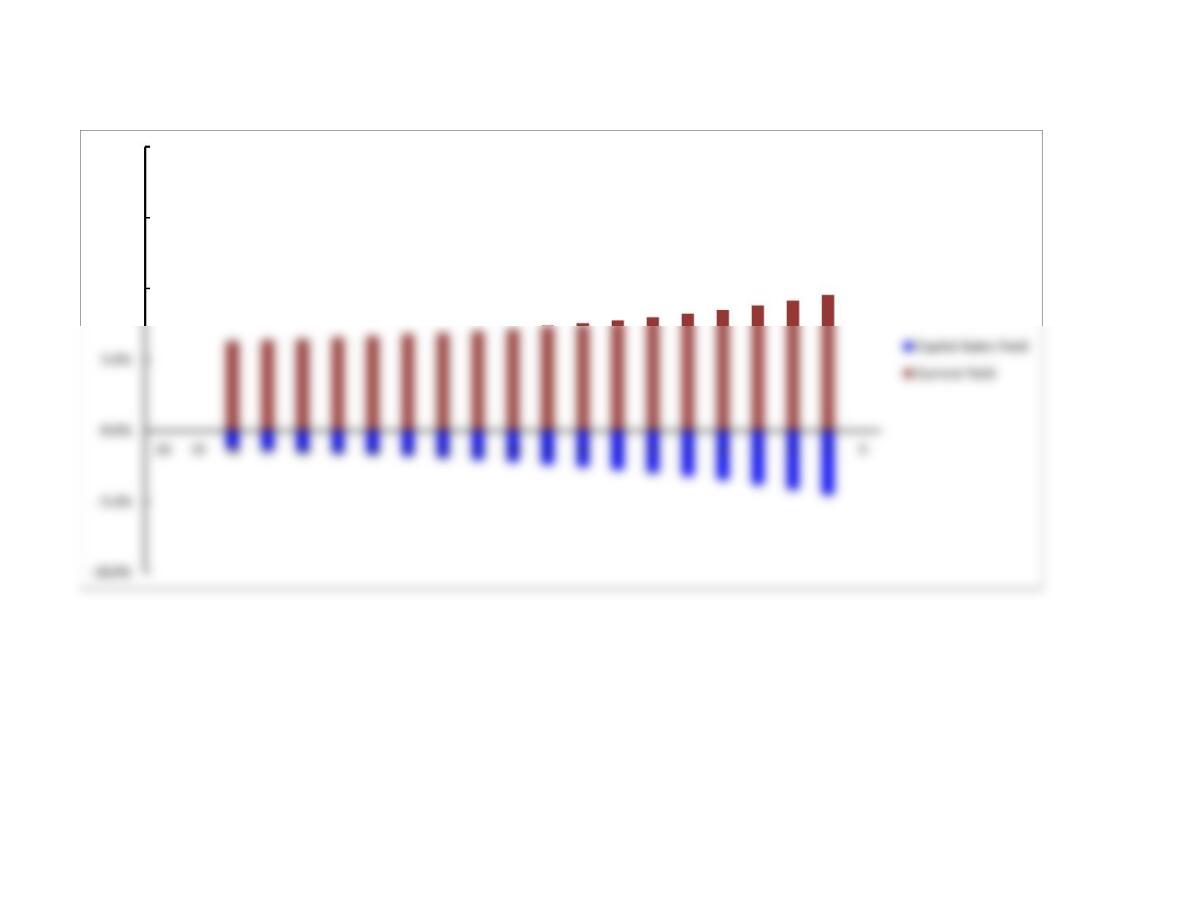
2. A graph that shows the composition of the total yield, rd, can be displayed if you click the worksheet labeled GRAPH at
Years remaining to maturity
Maturity value
C06
6%
2
# Years Bond
was Held
Beginning of Year
Value ($)
End of Year
Value ($)
Capital Gains
($)
Capital Gains
Yield (%)
Interest ($)
Current Yield
(%)
Total Yield
(%)
1$929.00 $934.11 $5.11 0.55% $60 6.46% 7.01%
2$934.11 $939.58 $5.47 0.59% $60 6.42% 7.01%
Coupon rate of interest
Interest payments per year
Yields to the original investor (Assumes the current market rate, YTM, remains the same each year the bond is held as
when the bond was purchased, except in the final year.)
Page 2
Maturity value
GRAPH
10.0%
15.0%
20.0%
Page 3
We have already entered the base case data for each model in this
file, and the models have performed the analysis for preceding parts
of the problem. You will need to enter the data for each of the
remaining parts of the problem–we indicate in each problem the parts
that should be done using the spreadsheet. However, there are several
points worth noting before you go into a model:
1. The input data are entered in specified cells in the INPUT DATA
section. When you change an input item, the model automatically
2. The key output data are displayed to the right of the INPUT DATA
3. Input data items that you can change are distinguished from the
ones you should not change. The items that you can change are
highlighted in color (blue) whereas the other items are printed in black.
5. Instructions and comments concerning specific models accompany
GENERAL INSTRUCTIONS FOR COMPUTERIZED PROBLEM SOLUTIONS