CFIN6 – CHAPTER 6
INTEGRATIVE PROBLEM SOLUTION
a. Some of the key features of a bond include the following:
(2) Coupon rate. The dollar coupon is the “rent” on the money borrowed, which is generally the par
value of the bond. The coupon rate is the annual interest payment divided by the par value, and
(3) Maturity. This is the number of years until the bond matures and the issuer must repay the loan
(return the par value).
(4) Call provision. Most bonds (except U.S. Treasury bonds) can be called and paid off ahead of
schedule after some specified “call protection period.” Generally, the call price is above the par
(5) Issue date. The date the bond is originally issued.
(6) Default risk is inherent in all bonds except Treasury bonds. The question here is: Will the issuer
have the cash to make the promised payments? Bonds are rated from AAA to D, and the lower
(7) Special features, such as convertibility and zero coupons, will be discussed later.
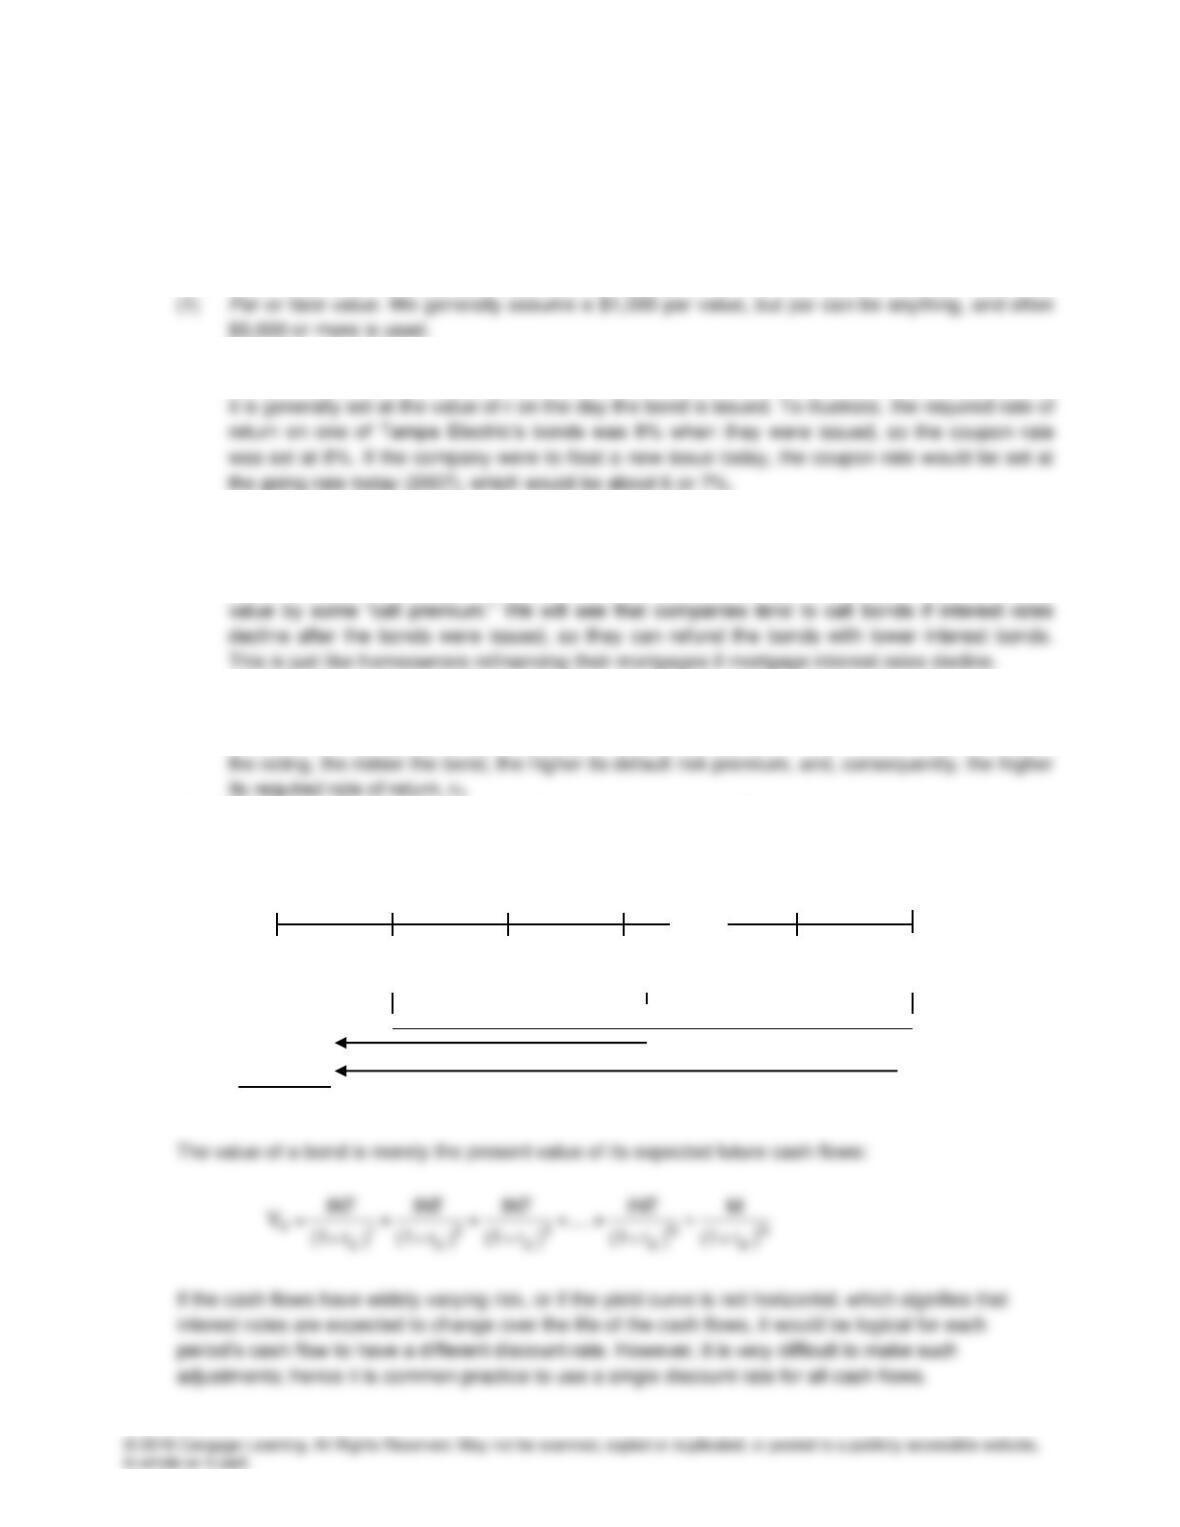
b. 0 1 2 3 N-1 N
INT INT INT INT INT
PV of INT
PV of M M
Bond Value
…
r%
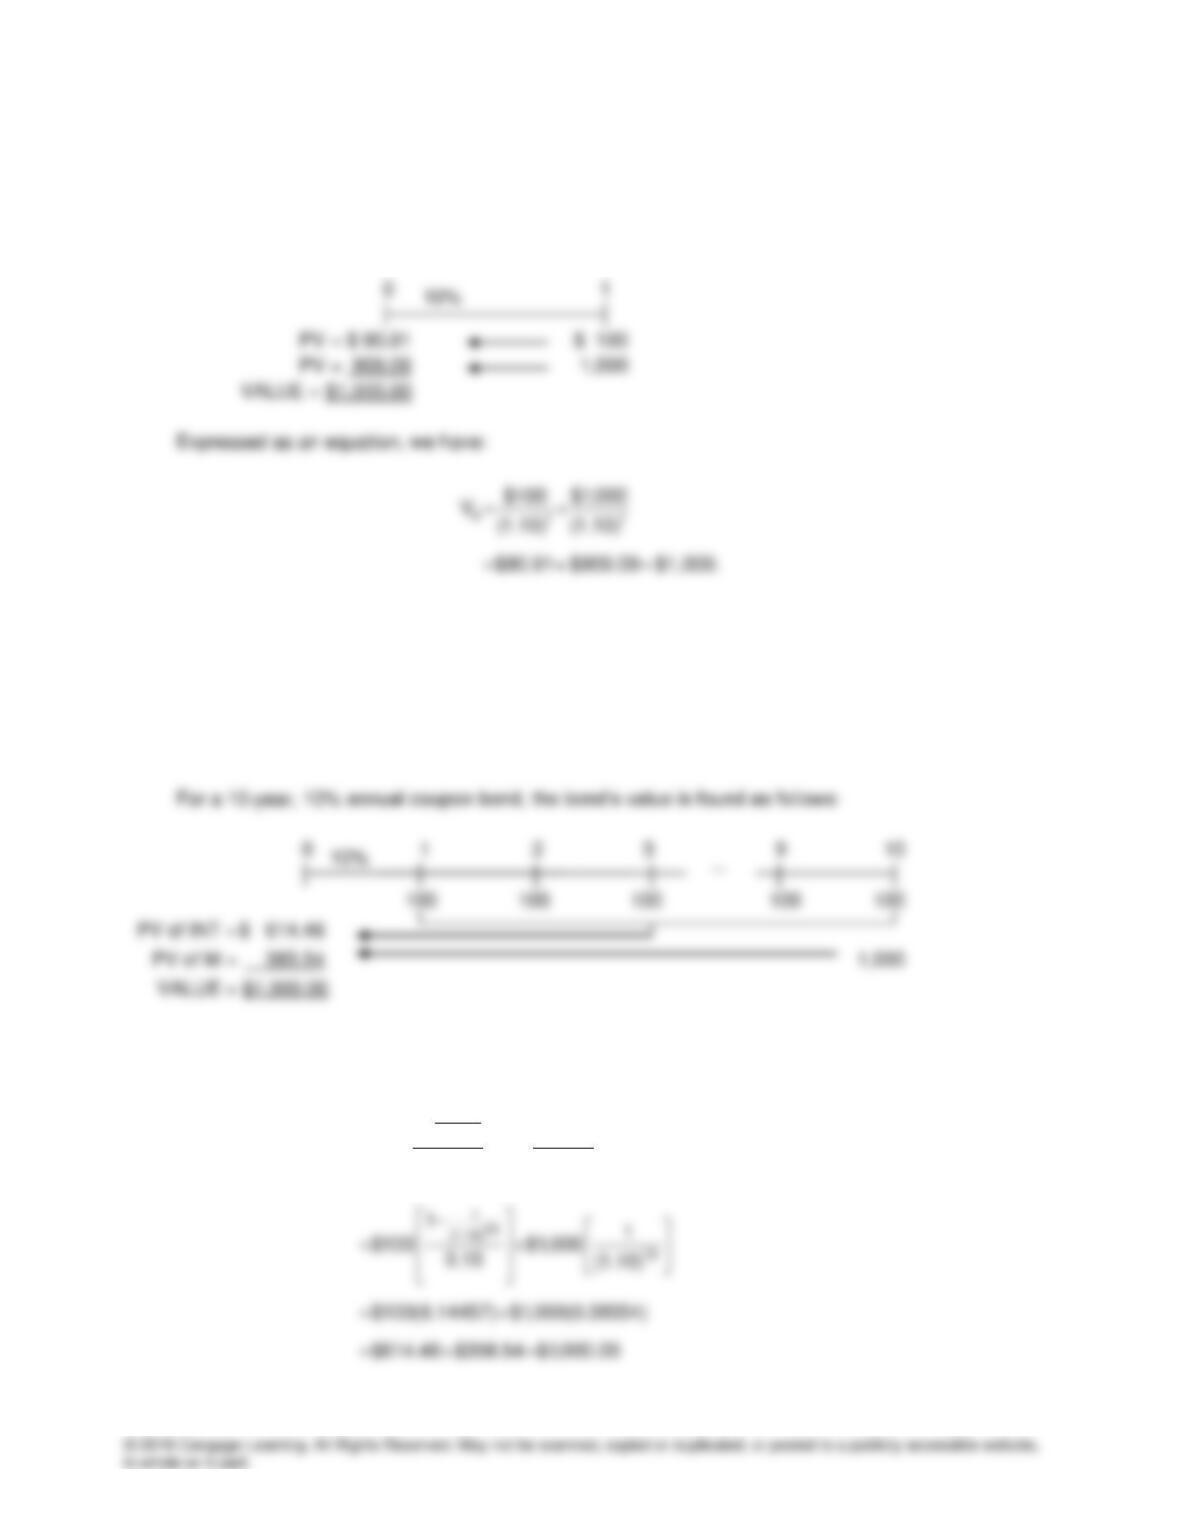
c. A bond has a specific cash flow pattern consisting of a stream of constant interest payments plus the
return of par at maturity. The annual coupon payment is the cash flow: pmt = (coupon rate) x (par
value) = 0.1($1,000) = $100. For a one-year bond, we have this cash flow timeline situation:
Numerical (regular calculator) solution: Given above.
Financial calculator solution: Input N = 1, I = 10, PMT = 100, and FV = 1,000; compute PV = -1,000
Spreadsheet solution: Use the PV financial function that is available on the spreadsheet.
Numerical (regular calculator) solution:
1N
(1 r )
d
dN
dd
11
V INT M
r(1 r )
+
−
=+
+
d(1). Numerical (regular calculator) solution:
1N
(1 r )
d
dN
dd
110
(1.13)
10
11
V INT M
r(1 r )
11
$100 $1,000
0.13 (1.13)
+
−
=+
+
−
=+
d(2). In the second situation, where rd falls to 7%, the price of the bond rises above par. Just change rd from
13% to 7%. We see that the value of the 1-year bond rises to $1,028.04, and the 10-year bond goes to
$1,210.71.
Numerical (regular calculator) solution:
1N
(1 r )
d
dN
dd
11
V INT M
r(1 r )
+
−
=+
+
Spreadsheet solution: Use the PV financial function that is available on the spreadsheet.
Thus, when the required rate of return falls below the coupon rate, the bonds’ value rises above par, or
to a premium. Further, the longer the maturity, the greater the price effect of any given interest rate
change.
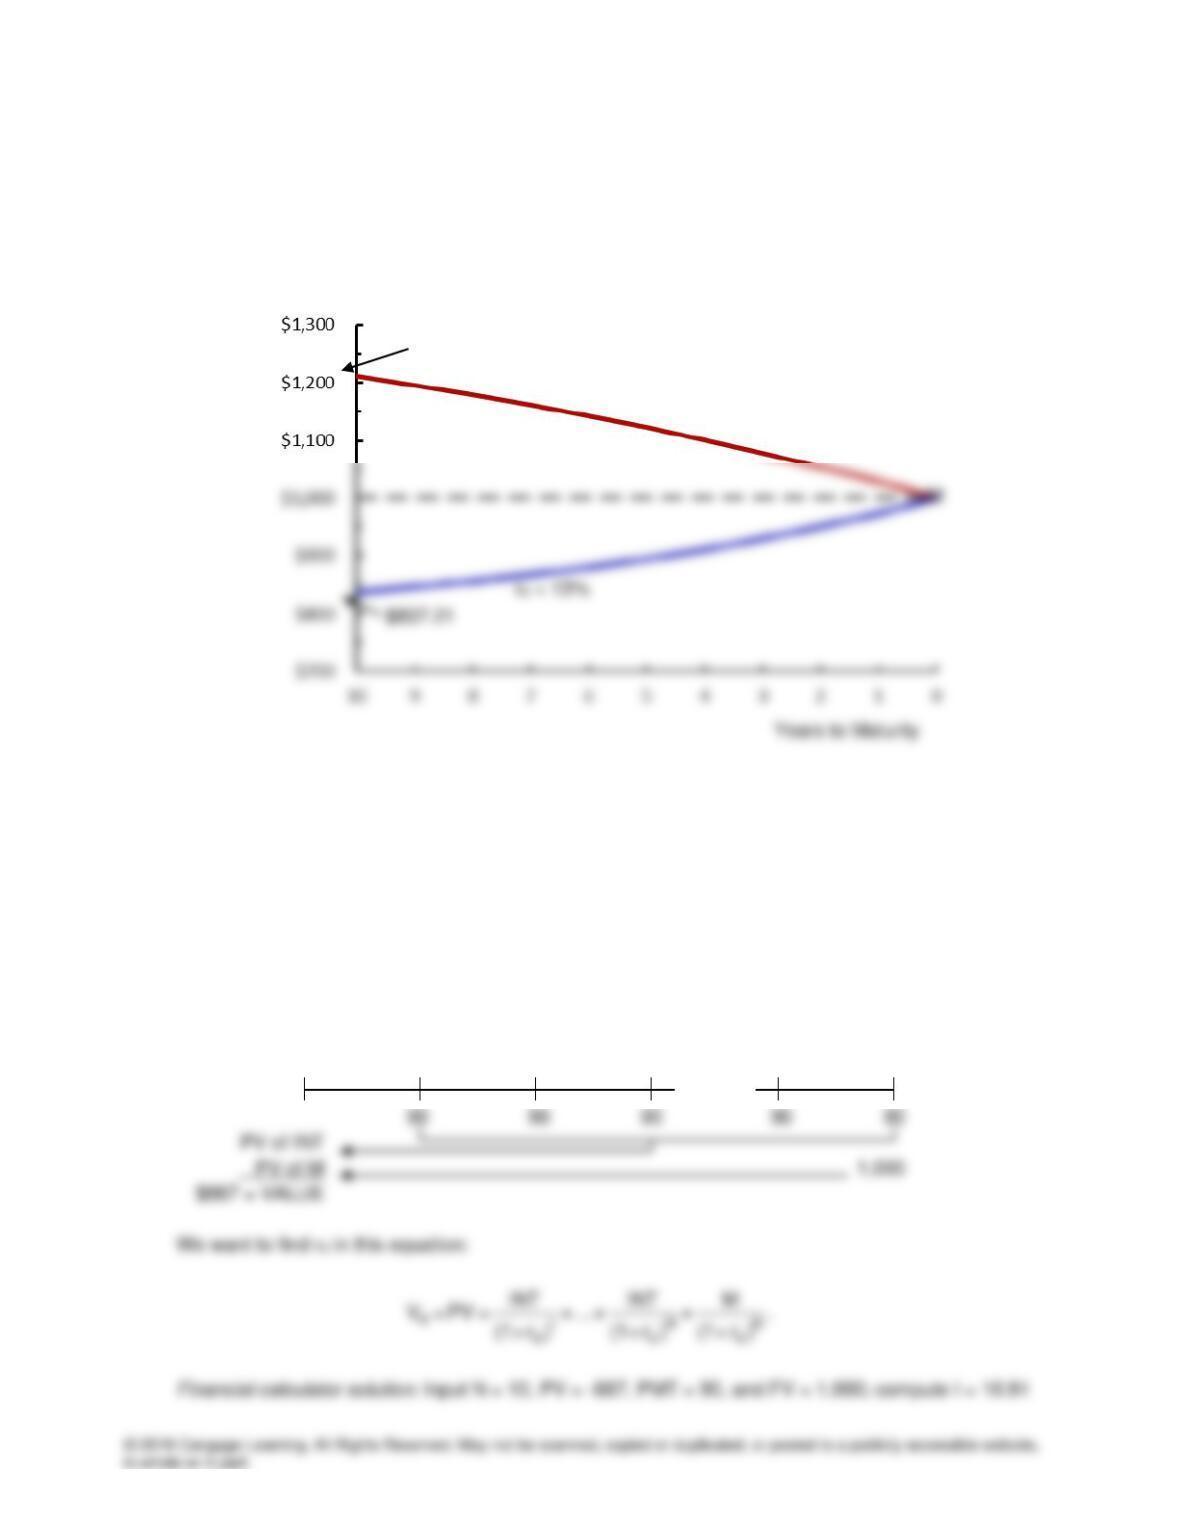
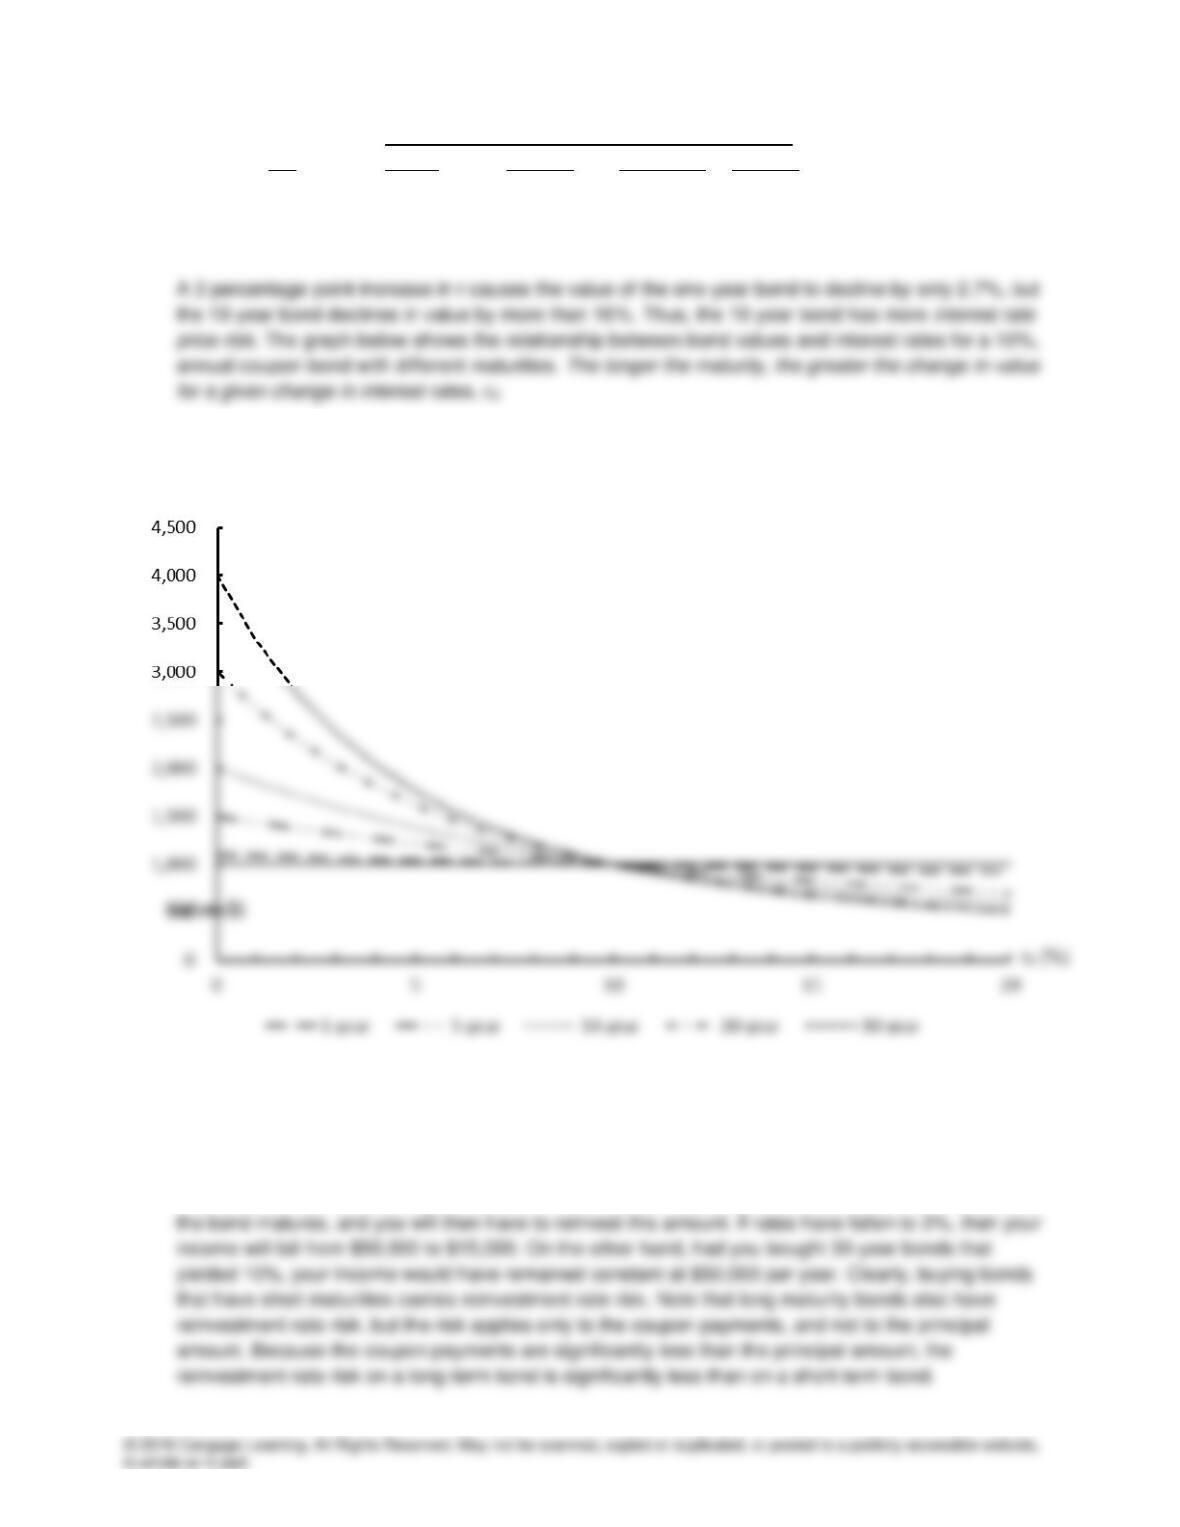
d(3). Assuming that interest rates remain at the new levels (either 7% or 13%), we could find the bond’s
value as time passes, and as the maturity date approaches. If we then plotted the data, we would find
the situation shown in the following graph:
At maturity, the value of any bond must equal its par value (plus accrued interest). As a result, if
interest rates, hence the required rate of return, remain constant over time, then a bond’s value must
move toward its par value as the maturity date approaches. Thus, the value of a premium bond
decreases to $1,000, and the value of a discount bond increases to $1,000 (barring default).
e(1). The yield to maturity (YTM) is the discount rate that equates the present value of a bond’s cash flows
to its price—that is, it is the promised rate of return on the bond. (Note that the expected rate of return
is less than the YTM if some probability of default exists.) On a cash flow timeline, we have the
following situation when the bond sells for $887:
0 1 2 3 9 10
YTM = ?
…
Yield
rd = 7%
$1,210.71
Spreadsheet solution: use the rate financial function that is available on the spreadsheet.
Even before we begin the calculations, we can tell from the bond’s price that the YTM must be above
the 9% coupon rate. We know this because the bond is selling at a discount, and discount bonds
always have rd > coupon rate.
e(2). The current yield is defined as follows:
Annual interest payment
Current
Yield Current price of the bond
=
The capital gains yield is defined as follows:
The term yield to maturity, or YTM, is often used in discussing bonds. It is simply the expected total
return (assuming no default risk), so
r
ˆ
= expected total return = expected YTM.
Recall also that securities have required returns, r, which depend on a number of factors:
Required return = r = r* + IP + LP + MRP + DRP
Knowing the current yield and the total return, we can find the capital gains yield:
YTM = Current yield + Capital gains yield
Capital gains yield = YTM – Current yield = 10.91% – 10.15% = 0.76%
which agrees with our earlier calculation (except for rounding).
When the bond is selling for $1,134.20 and providing a total return of r = YTM = 7.08%, we have this
situation:
Current yield = $90/$1,134.20 = 7.94%
and
f. Vd = $887.00
Financial calculator solution: Input N = 5, PV = -887, PMT = 90, and FV = 1,000; compute I = 12.15%
Spreadsheet solution: use the rate financial function that is available on the spreadsheet.
Vd = $1,134.20
Maturity
r 1-year Change 10-year Change
7% $1,028 $1,211
10 1,000 2.7% 1,000 17.4%
13 973 2.7% 837 16.3%
h. Interest rate reinvestment rate risk is defined as the risk that cash flows (interest plus principal
repayments) will have to be reinvested in the future at rates different than today’s rate. To illustrate,
suppose you just won the lottery and now have $500,000. You plan to invest the money and then to
live on the income from your investments. Suppose you buy a one-year bond with a YTM of 10%. Your
income will be $50,000 during the first year. Then, after one year, you will receive your $500,000 when
Interest Rate Price Risk for 10% Coupon Bonds with Different Maturities
Value ($)
Value ($)
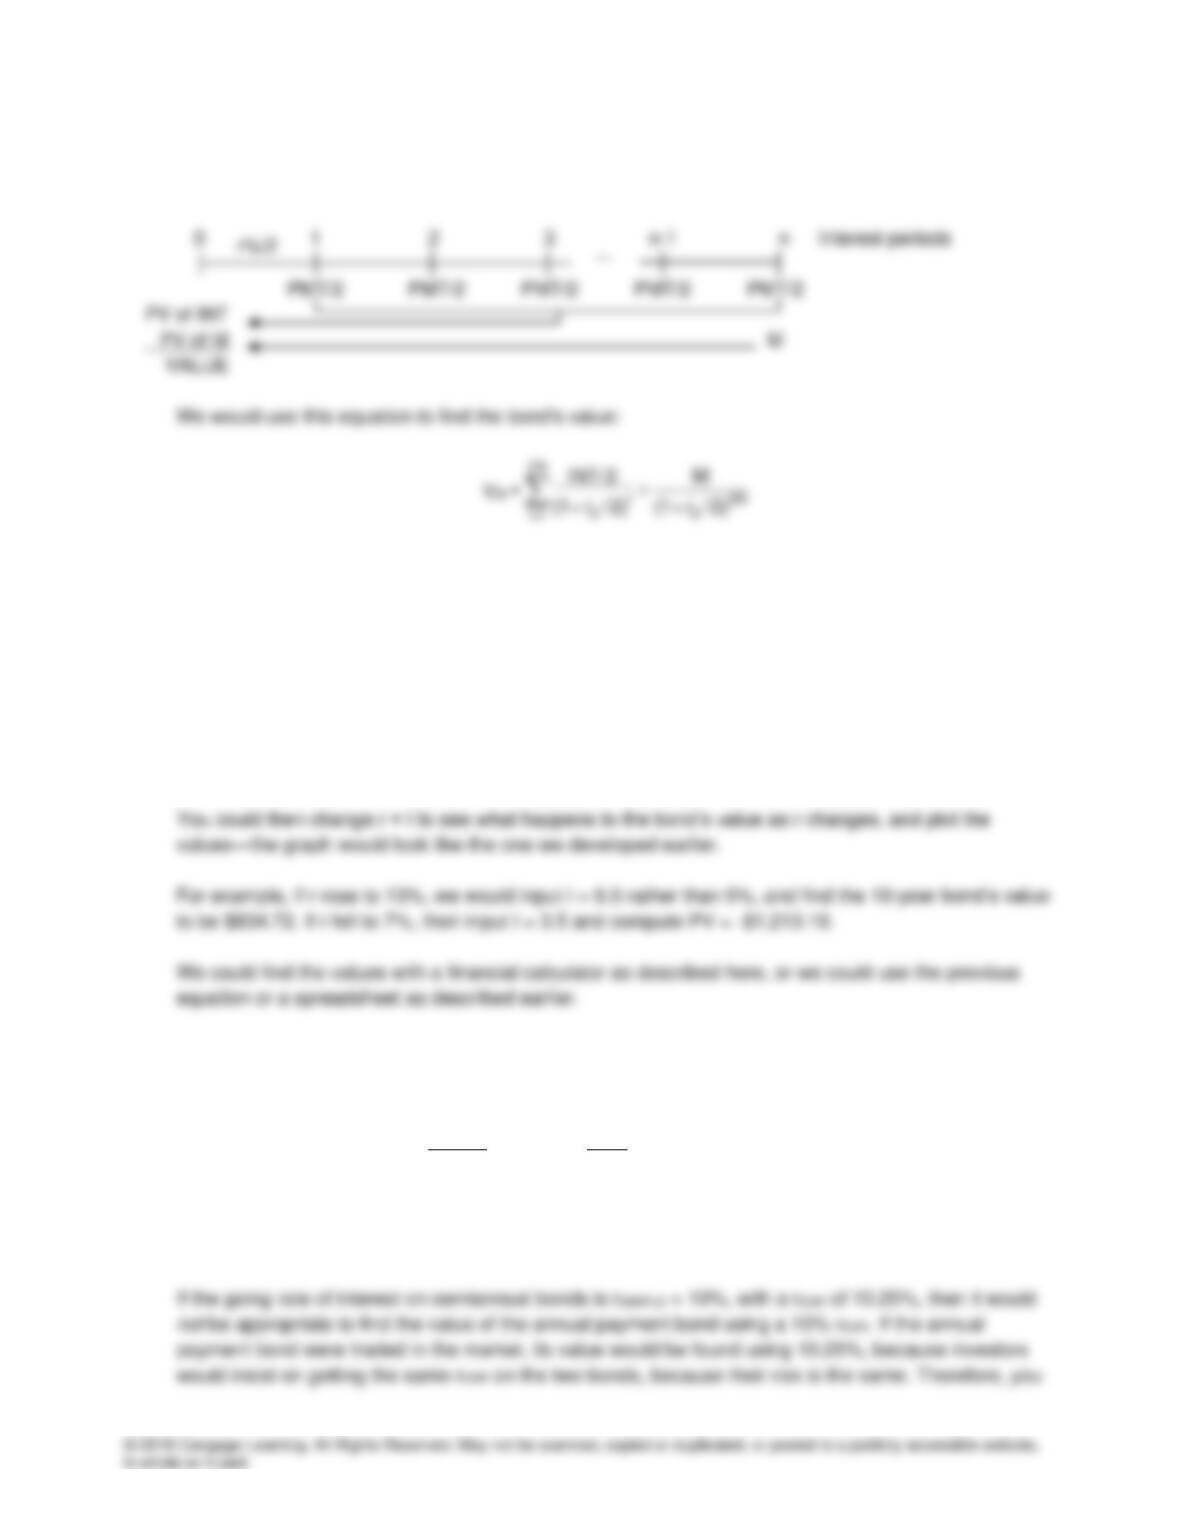
i. Most bonds issued in the U.S. have semiannual coupons and are valued using the setup shown below:
The payment stream consists of an annuity of 2N payments plus a lump sum equal to the maturity
value.
For a 10%, semiannual payment, 1-year bond, semiannual interest = annual coupon/2 = $100/2 = $50
and N = 2(years to maturity) = 2(1) = 2. To find the value of the bond with a financial calculator, enter N
= 2, rd/2 = I = 5, PMT = 50, FV = 1000, and then compute PV = -$1,000.
To find the value of the 10-year, semiannual payment bond, enter N = 20 to override the N = 2, and
compute PV = -$1,000.
j. The semiannual payment bond would be better. Its ear would be:
10.25%.1025.0 = 1
2
0.10
+ 1 = 1
m
r
+ 1 = r
2
SIMPLE m
EAR =−
−
A rEAR of 10.25% is clearly better than one of 10.0%, which is what the annual payment bond offers.
You, and everyone else, would prefer it.
could find the value of the annual payment bond, using 10.25%, with your calculator. It would be
$984.80 versus $1,000 for the semiannual payment bond.
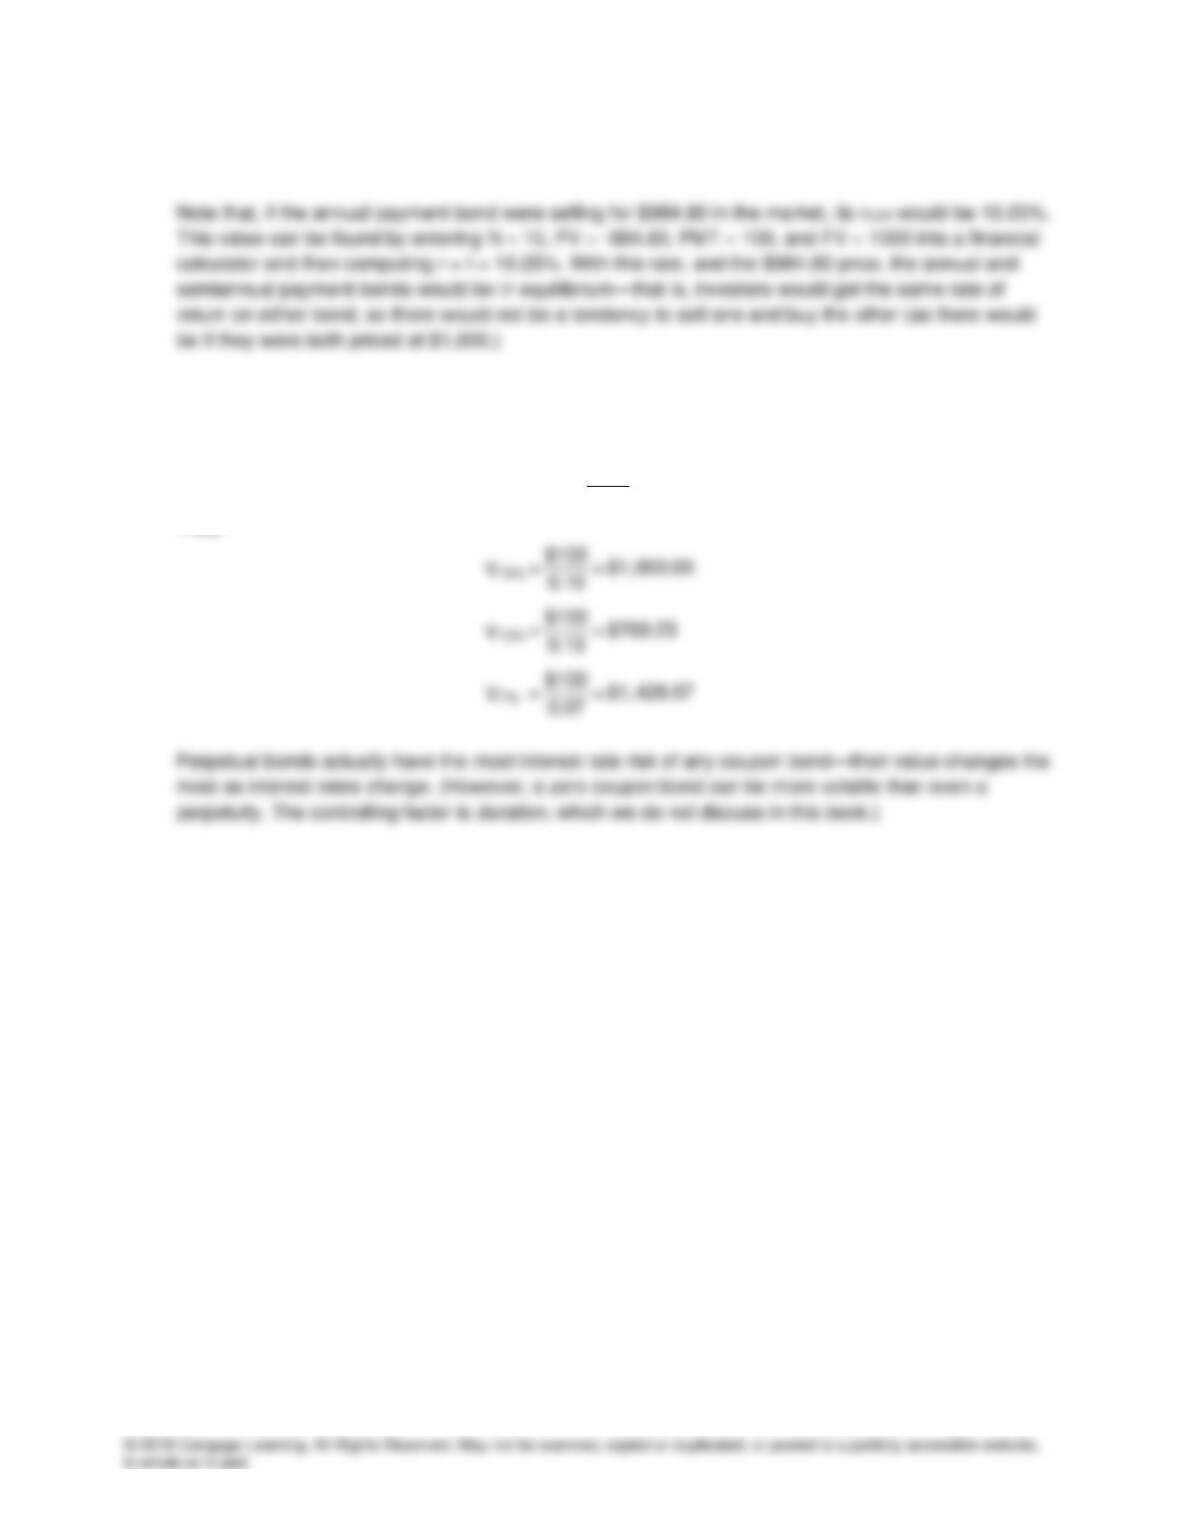
k. The value of a perpetuity is simply:
r
PMT
=
Vd
Thus: