Mini Case: 6 – 17
e. Your client has decided that the risk of the bond portfolio is acceptable and wishes
to leave it as it is. Now your client has asked you to use historical returns to
estimate the standard deviation of Blandy’s stock returns. (Note: Many analysts
use 4 to 5 years of monthly returns to estimate risk and many use 52 weeks of
weekly returns; some even use a year or less of daily returns. For the sake of
simplicity, use Blandy’s 10 annual returns.)
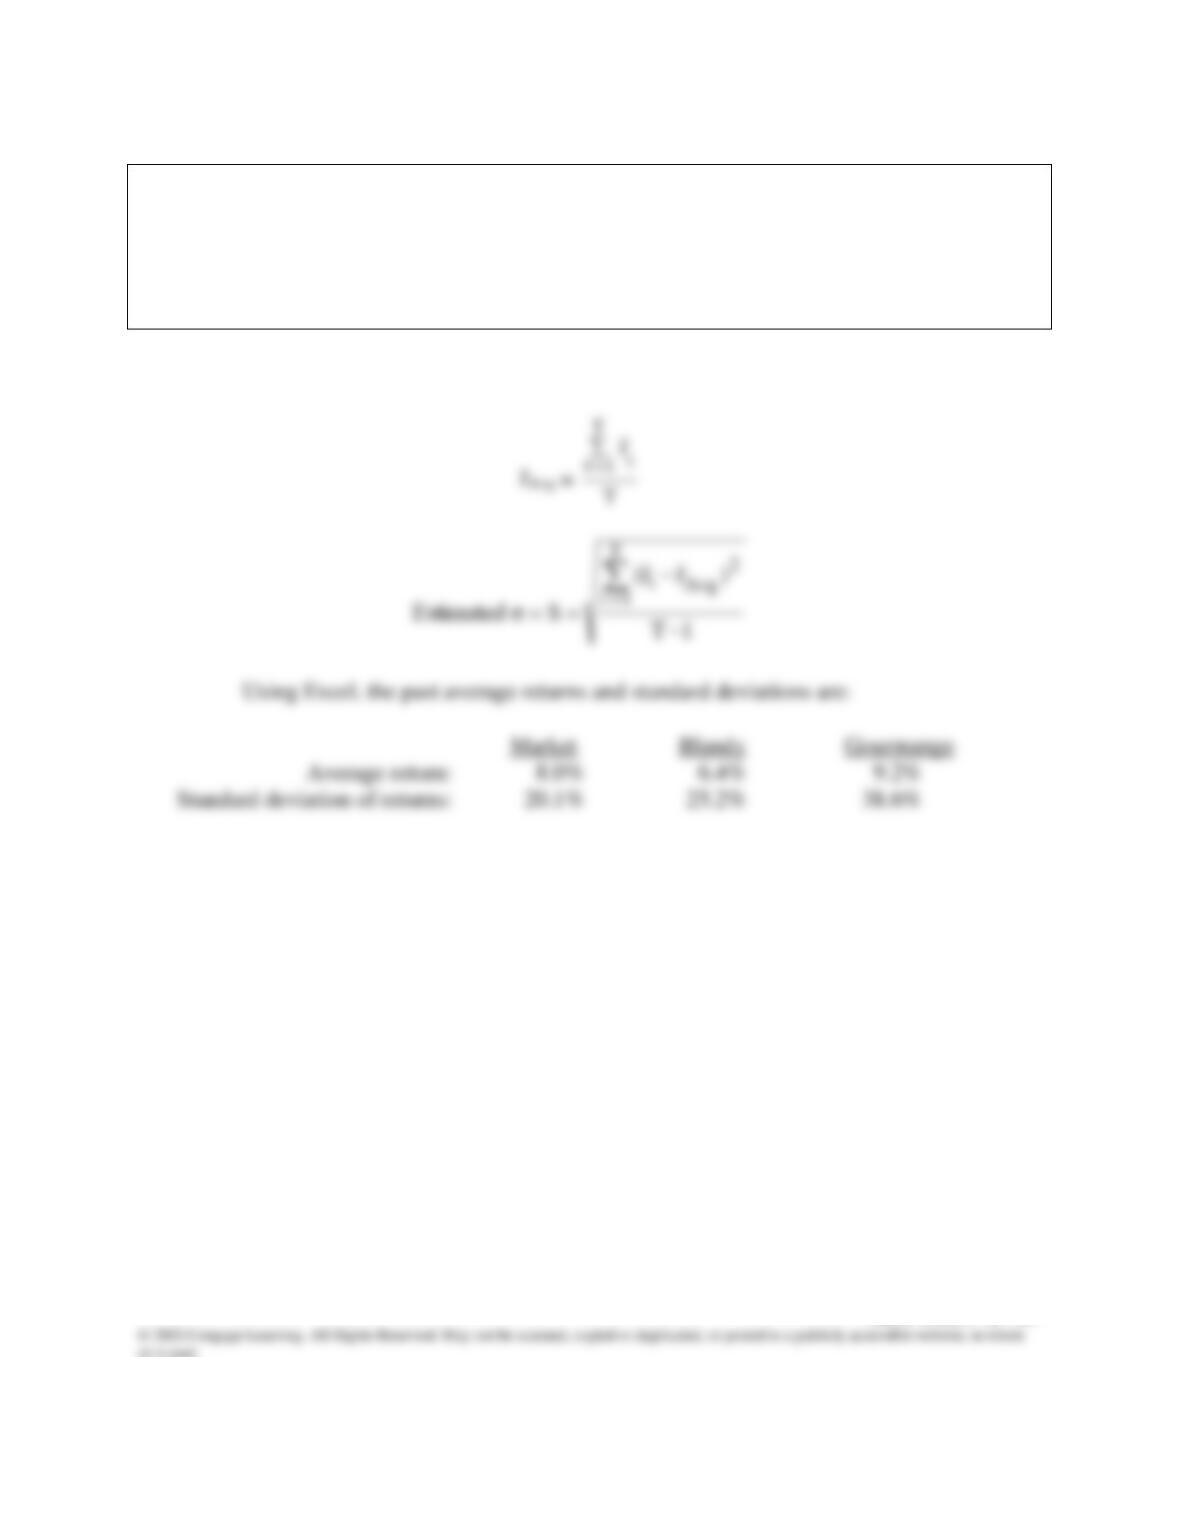
Answer: The formulas are shown below:
Mini Case: 6 – 18
f. Your client is shocked at how much risk Blandy stock has and would like to reduce
the level of risk. You suggest that the client sell 25% of the Blandy stock and create
a portfolio with 75% Blandy stock and 25% in the high-risk Gourmange stock.
How do you suppose the client will react to replacing some of the Blandy stock
with high-risk stock? Show the client what the proposed portfolio return would
have been in each of year of the sample. Then calculate the average return and
standard deviation using the portfolio’s annual returns. How does the risk of this
two-stock portfolio compare with the risk of the individual stocks if they were held
in isolation?
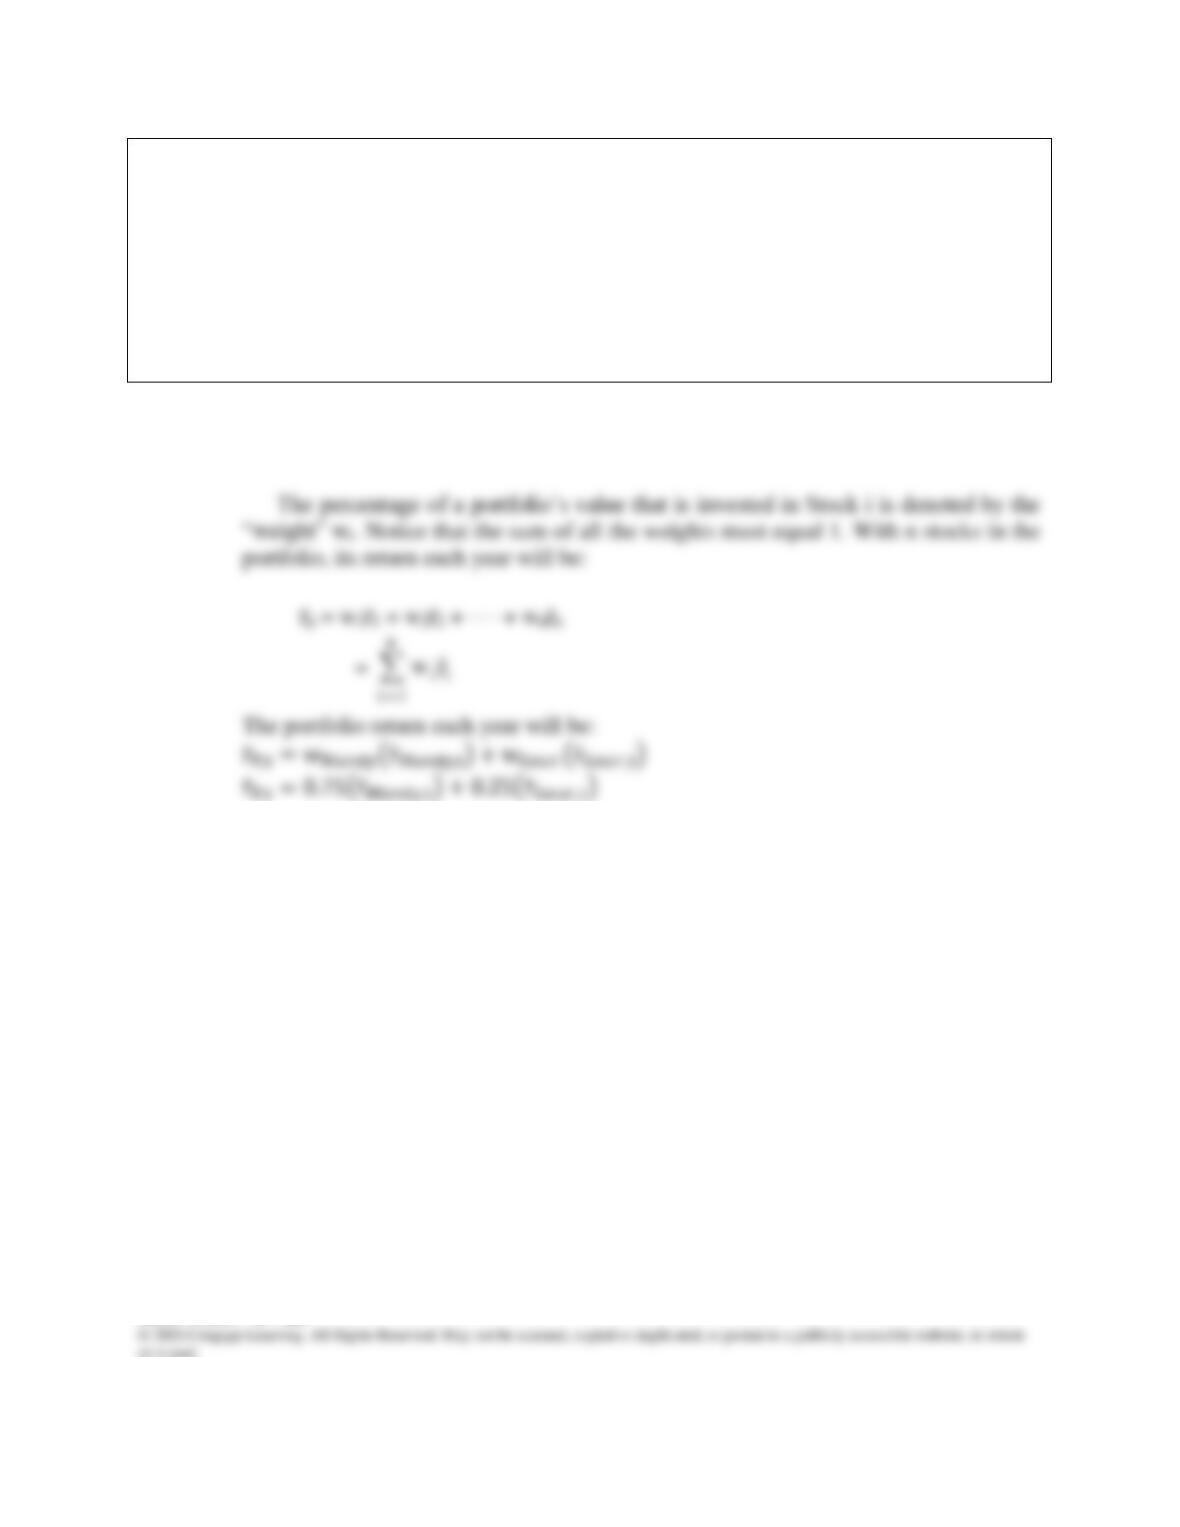
Answer: To find historical returns on the portfolio, we first find each annual return for the
portfolio using the portfolio weights and the annual stock returns:
Mini Case: 6 – 19
Following is a table showing the portfolio’s return in each year. It also shows the
average return and standard deviation during the past 10 years.
Stock Returns
Year
Blandy
Gourmange
Portfolio
1
26%
47%
31.3%
2
15%
-54%
-2.3%
3
-14%
15%
-6.8%
4
-15%
7%
-9.5%
5
2%
-28%
-5.5%
6
-18%
40%
-3.5%
7
42%
17%
35.8%
8
30%
-23%
16.8%
9
-32%
-4%
-25.0%
10
28%
75%
39.8%
Average return:
6.4%
9.2%
7.1%
Standard deviation of returns:
25.2%
38.6%
22.2%
Notice that the portfolio risk is actually less than the standard deviations of the
stocks making up the portfolio.
The average portfolio return during the past 10 years can be calculated as average
return of the 10 yearly returns. But there is another way—the average portfolio return
over a number of periods is also equal to the weighted average of the stock’s average
Mini Case: 6 – 20
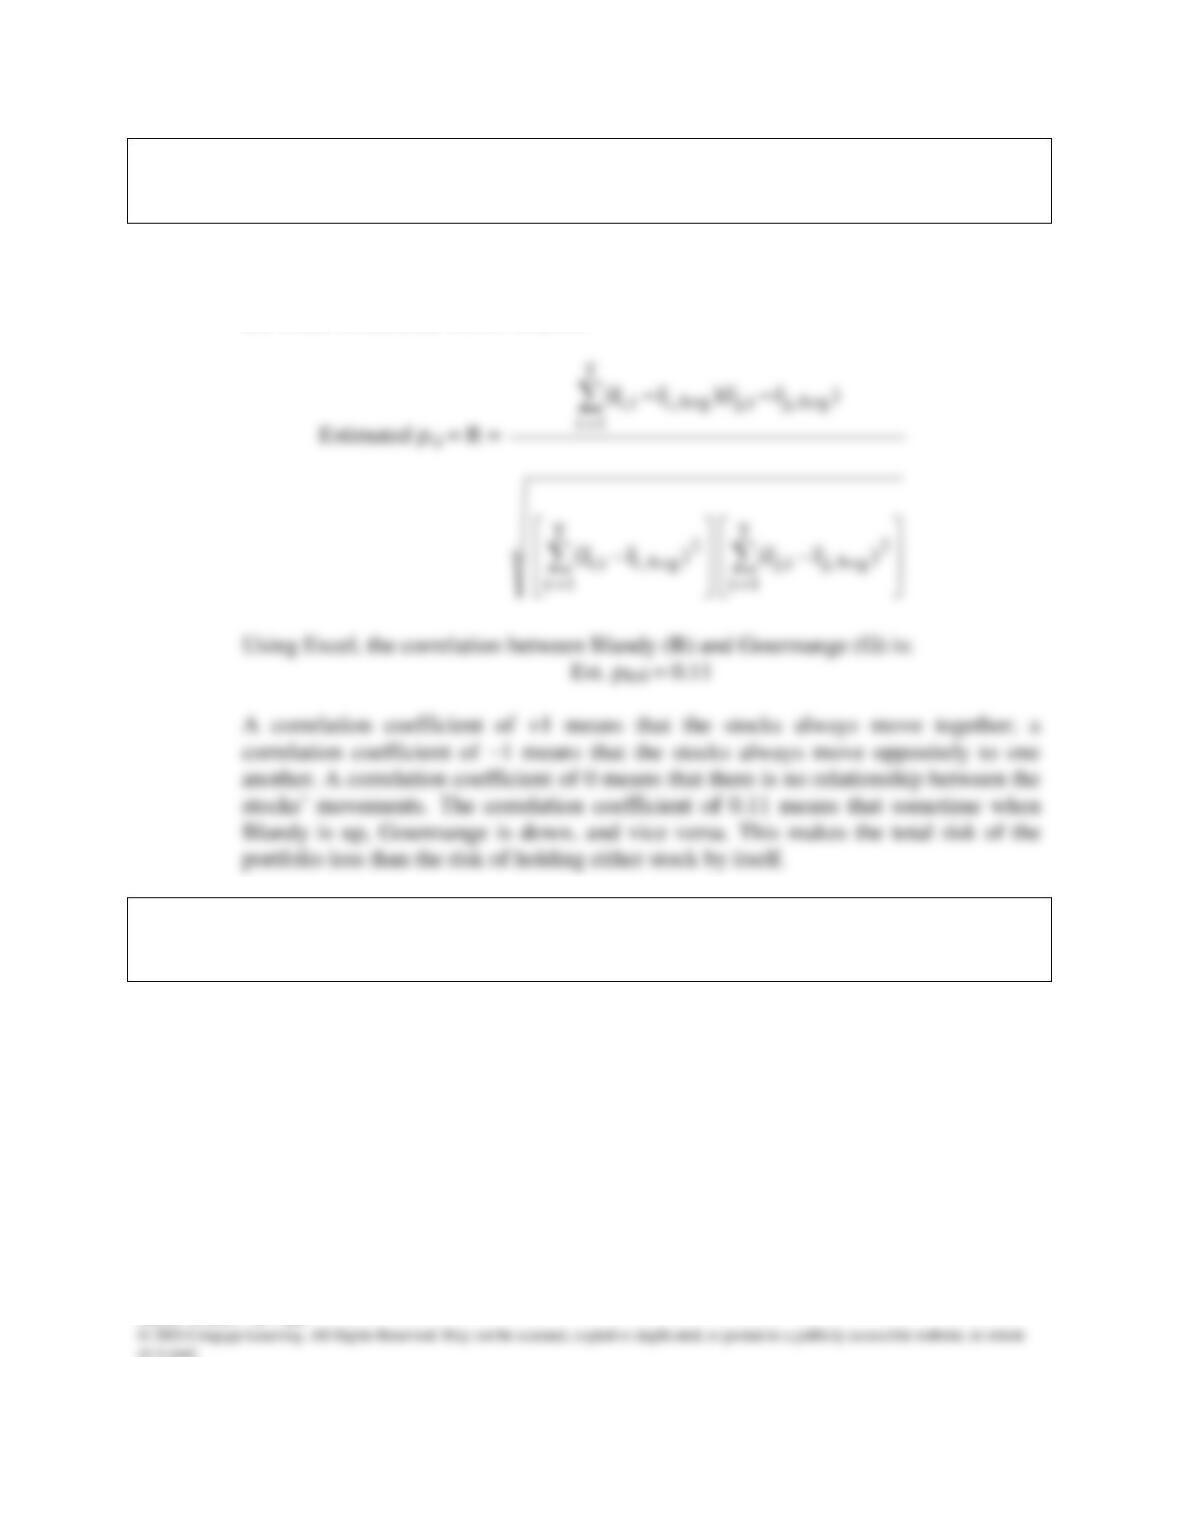
g. Explain correlation to your client. Calculate the estimated correlation between
Blandy and Gourmange. Does this explain why the portfolio standard deviation
was less than Blandy’s standard deviation?
Answer: Loosely speaking, the correlation (ρ) coefficient measures the tendency of two
variables to move together. The formula, shown below, is complicated, but it is easy to
use Excel to calculate the correlation.
h. Suppose an investor starts with a portfolio consisting of one randomly selected
stock. As more and more randomly selected stocks are added to the portfolio, what
happens to the portfolio’s risk?
Answer: The standard deviation gets smaller as more stocks are combined in the portfolio, while
rp (the portfolio’s return) remains constant. Thus, by adding stocks to your portfolio,
which initially started as a 1-stock portfolio, risk has been reduced.
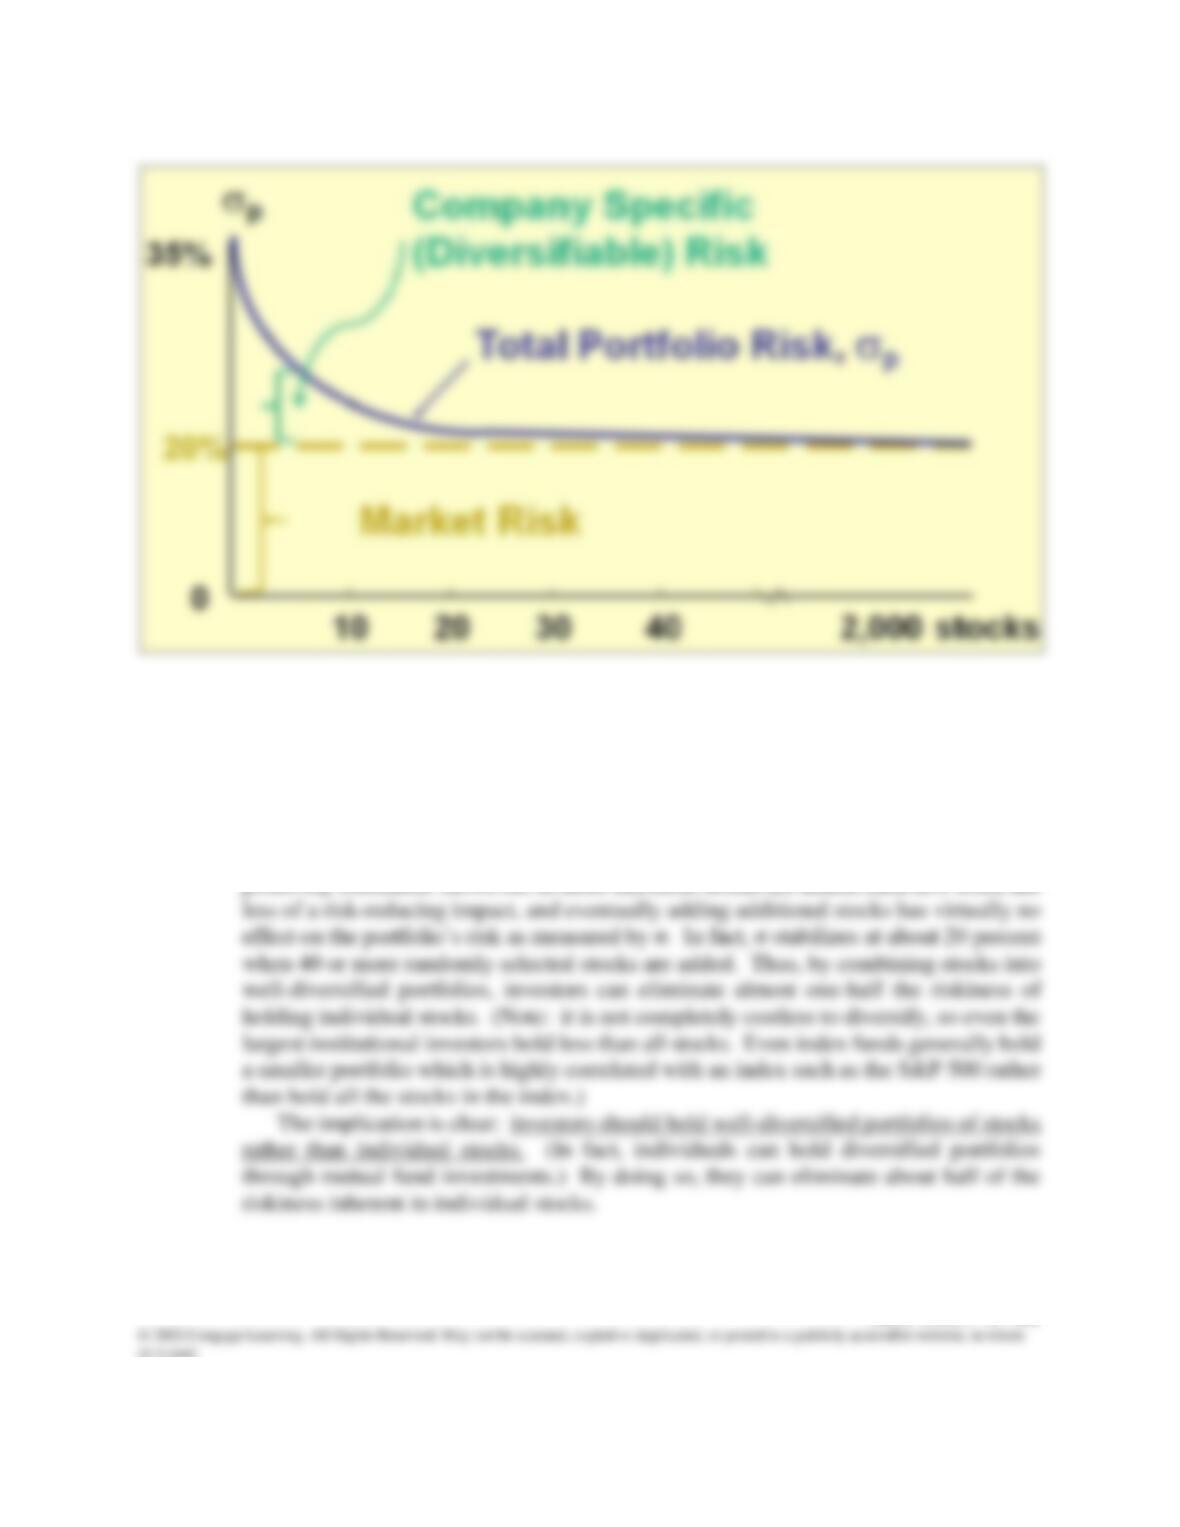
Mini Case: 6 – 21
In the real world, stocks are positively correlated with one another—if the economy
does well, so do stocks in general, and vice versa. Correlation coefficients between
stocks generally range from +0.5 to +0.7. The average correlation between stocks is
about 0.35. A single stock selected at random would on average have a standard
deviation of about 35 percent. As additional stocks are added to the portfolio, the
portfolio’s standard deviation decreases because the added stocks are not perfectly
positively correlated. However, as more and more stocks are added, each new stock has
Mini Case: 6 – 22
i. 1. Should portfolio effects influence how investors think about the risk of individual
stocks?
Answer: Portfolio diversification does affect investors’ views of risk. A stock’s stand-alone risk
as measured by its σ or CV, may be important to an undiversified investor, but it is not
i. 2. If you decided to hold a one-stock portfolio and consequently were exposed to
more risk than diversified investors, could you expect to be compensated for all of
your risk; that is, could you earn a risk premium on that part of your risk that
you could have eliminated by diversifying?
Answer: If you hold a one-stock portfolio, you will be exposed to a high degree of risk, but you
won’t be compensated for it. If the return were high enough to compensate you for
j. According to the Capital Asset Pricing Model, what measures the amount of risk
that an individual stock contributes to a well-diversified portfolio? Define this
measurement.
Answer: Market risk, which is relevant for stocks held in well-diversified portfolios, is defined
as the contribution of a security to the overall risk of the portfolio. It is measured by a
Mini Case: 6 – 23
k. What is the Security Market Line (SML)? How is beta related to a stock’s
required rate of return?
Answer: Here is the SML equation:
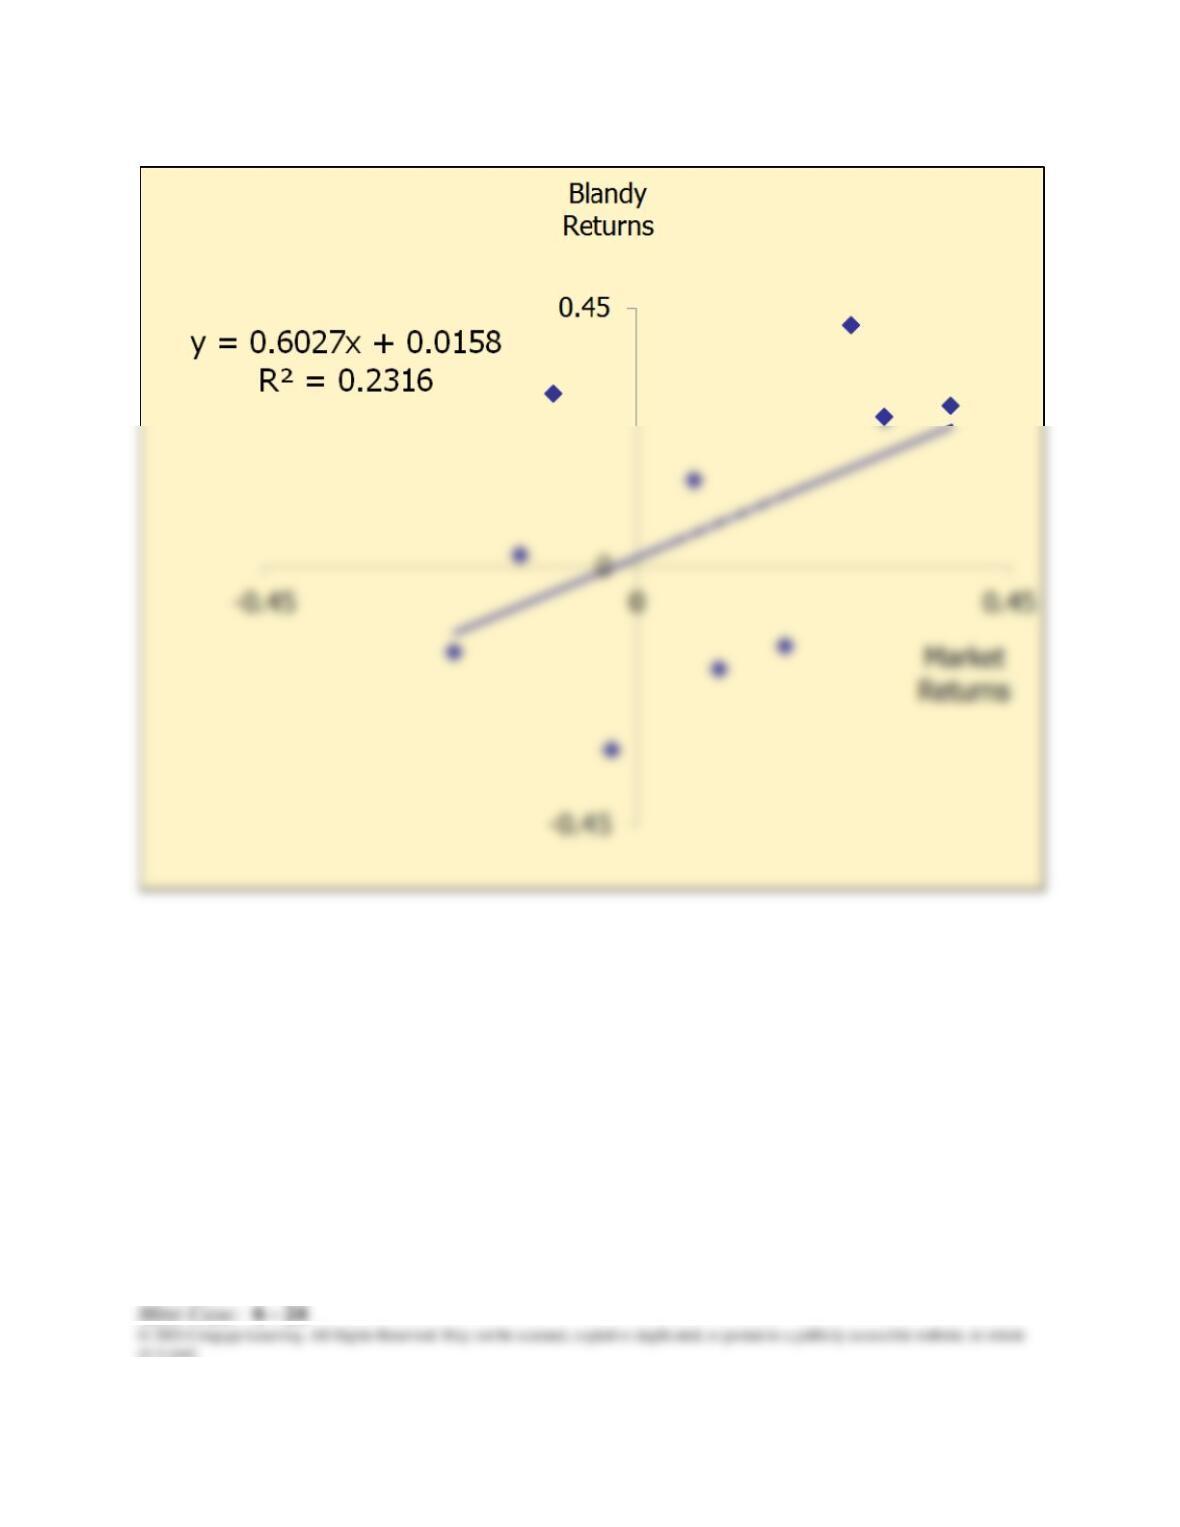
l. Calculate the correlation coefficient between Blandy and the market. Use this and
the previously calculated (or given) standard deviations of Blandy and the market
to estimate Blandy’s beta. Does Blandy contribute more or less risk to a well–
diversified portfolio than does the average stock? Use the SML to estimate
Blandy’s required return.
Answer: Using the formula for correlation or the Excel function, CORREL, Blandy’s correlation
with the market (ρB,M) is:
ρB,M = 0.481
m. Show how to estimate beta using regression analysis.
Mini Case: 6 – 25
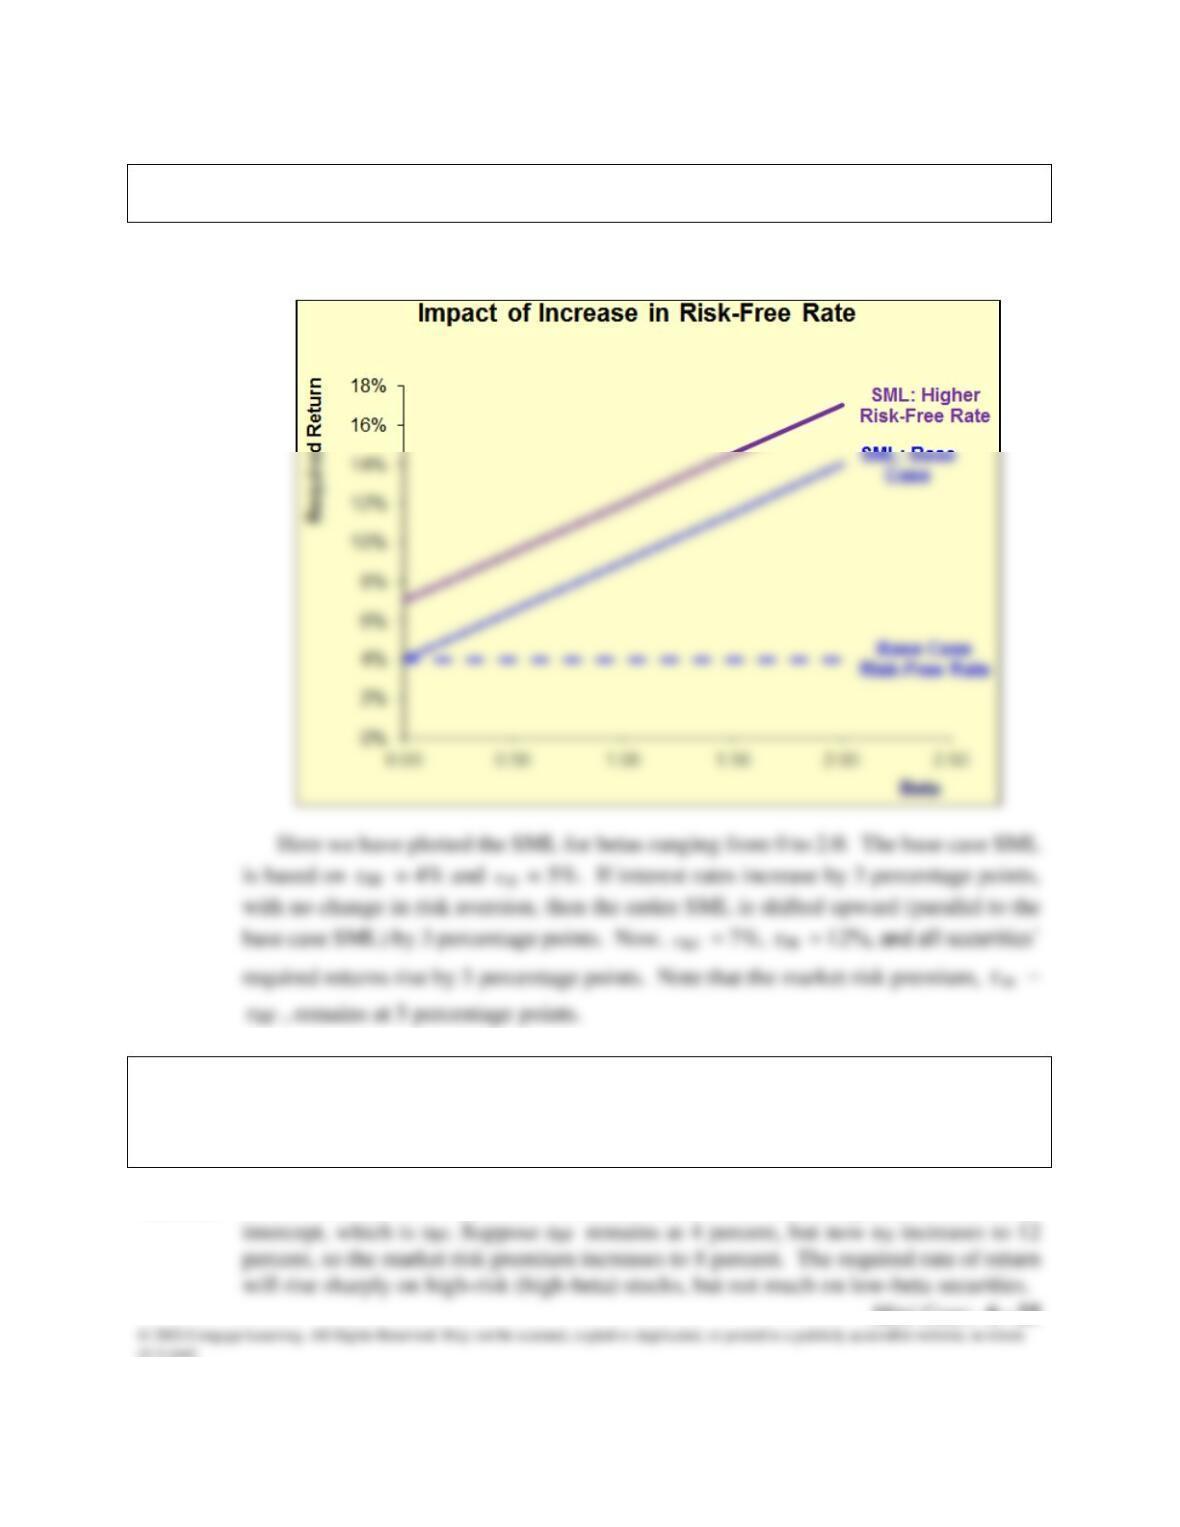
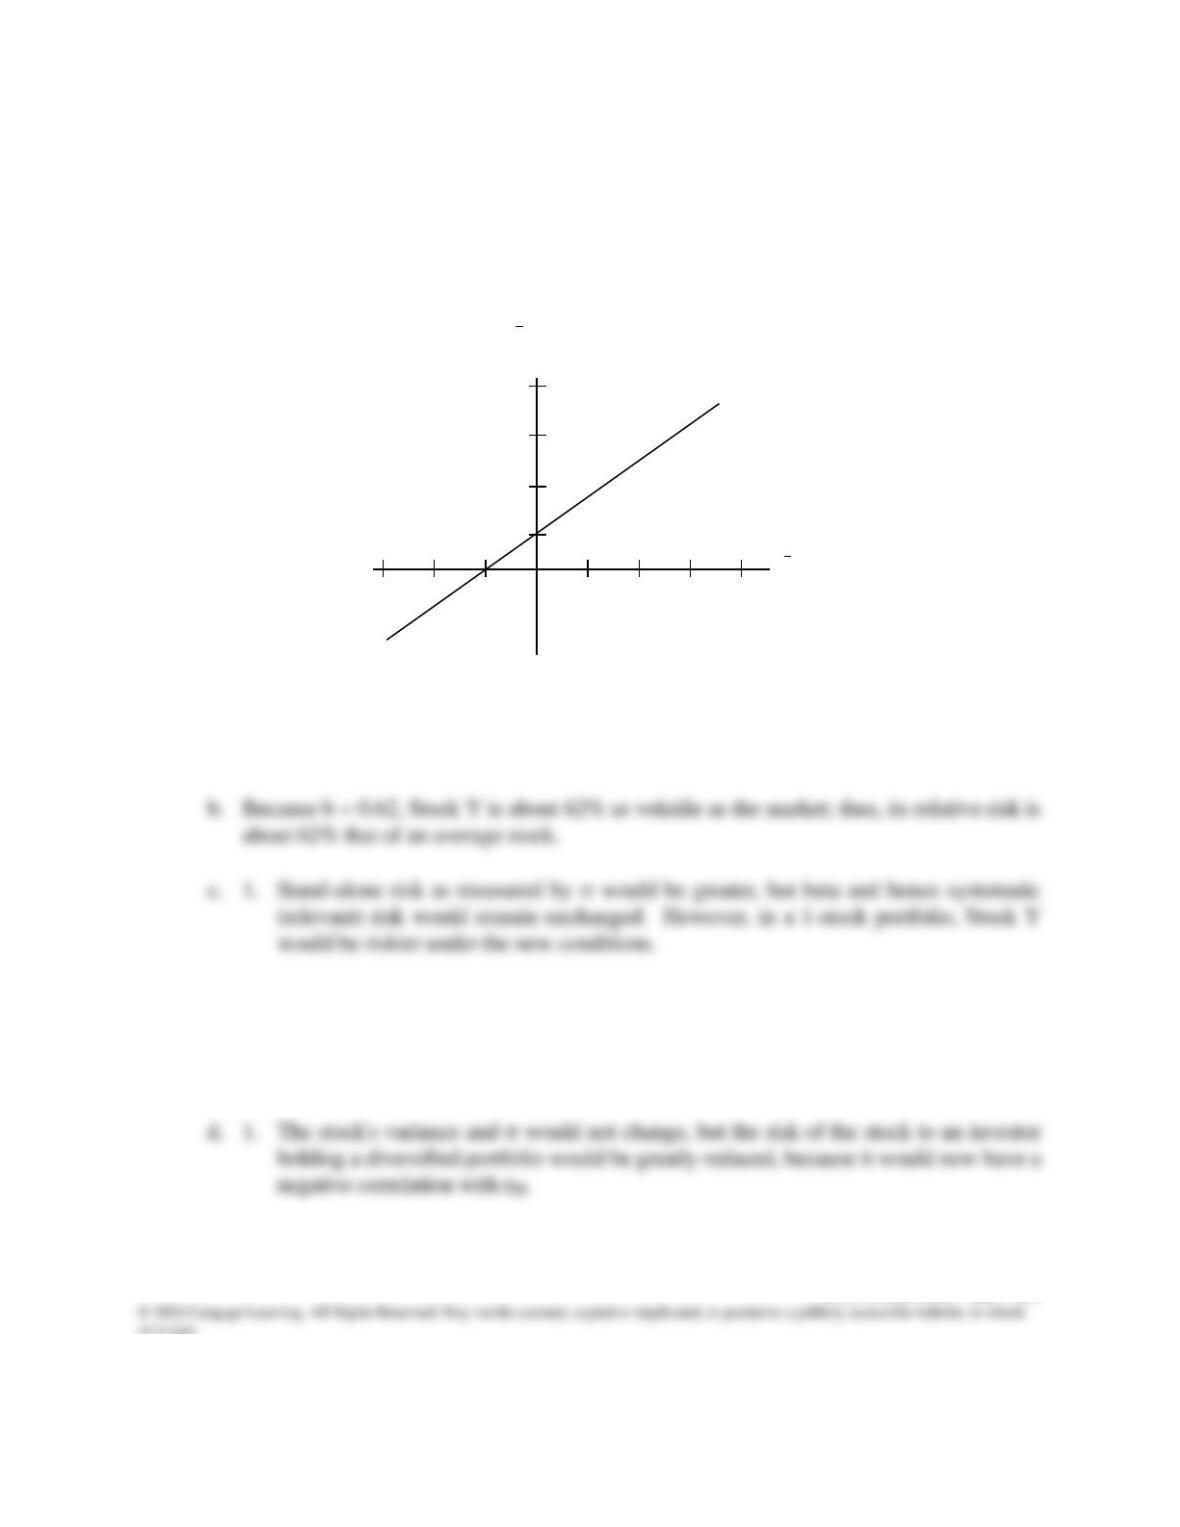
n. 1. Suppose the risk-free rate goes up to 7%. What effect would higher interest rates have
on the SML and on the returns required on high-risk and low-risk securities?
Answer: The SML is shifted higher, but the slope is unchanged.
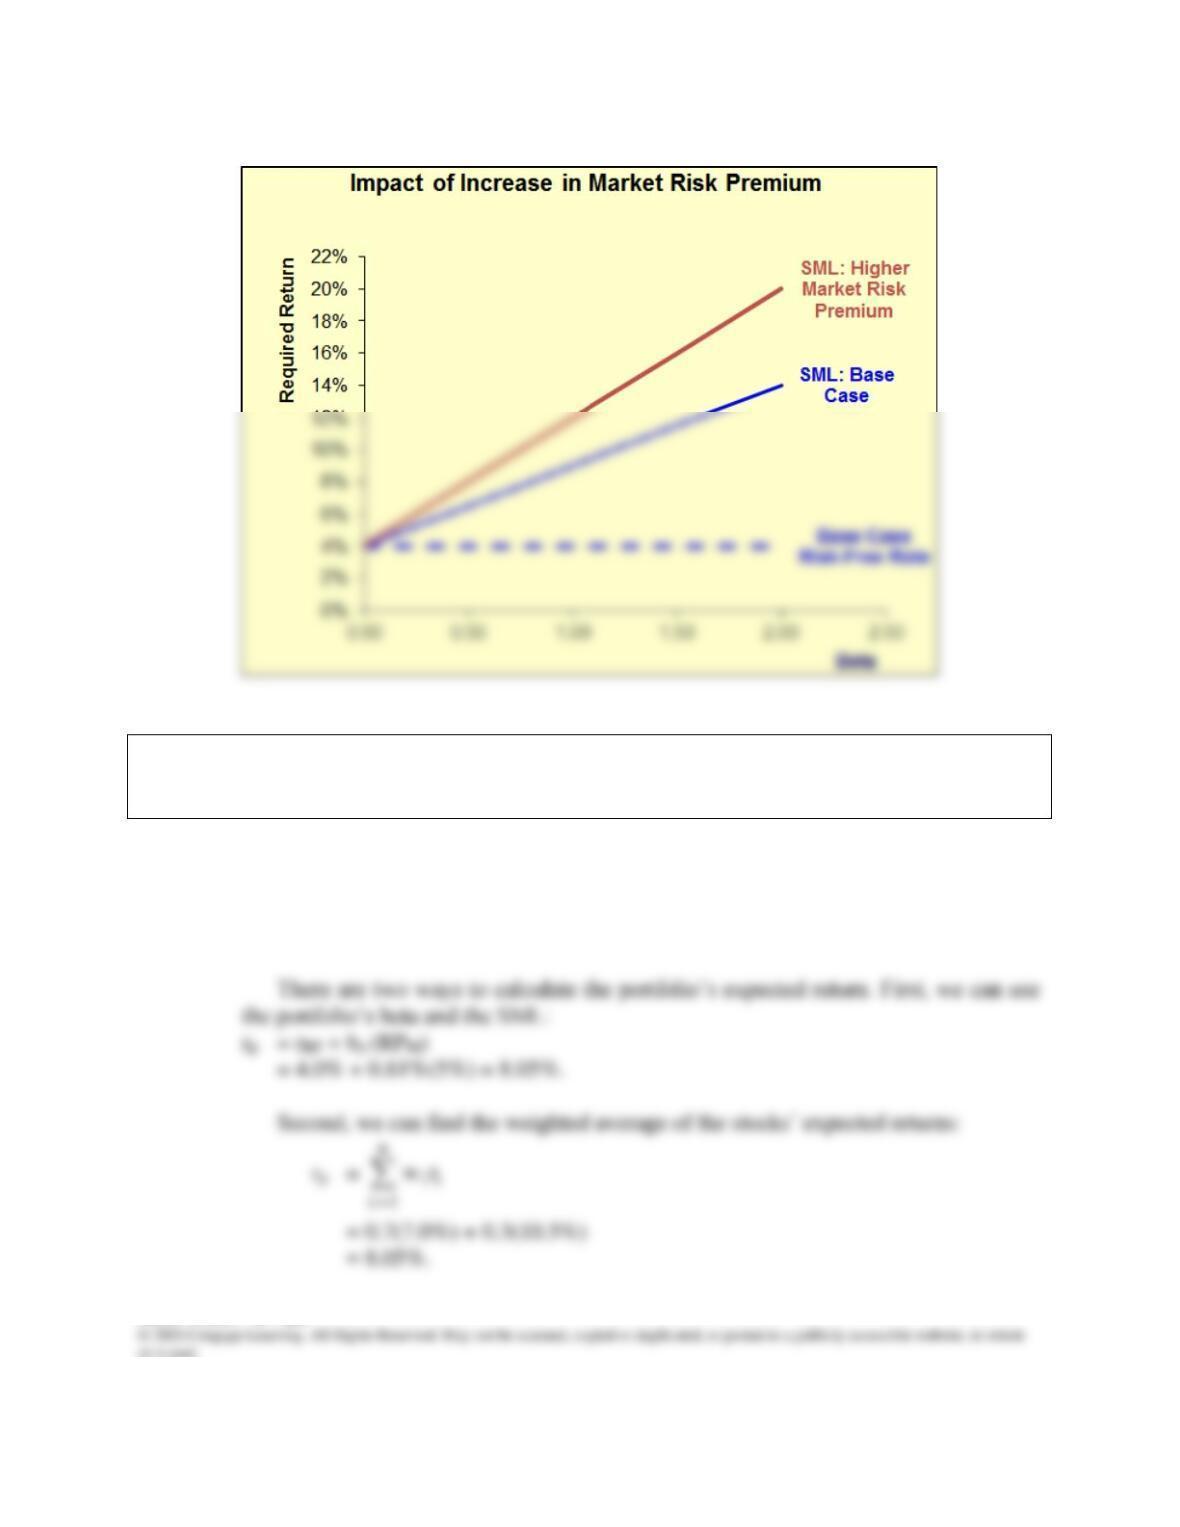
n. 2. Suppose instead that investors’ risk aversion increased enough to cause the
market risk premium to increase to 8%. (Assume the risk-free rate remains
constant.) What effect would this have on the SML and on returns of high– and
low-risk securities?
Answer: When investors’ risk aversion increases, the SML is rotated upward about the y–
Mini Case: 6 – 26
o. Your client decides to invest $1.4 million in Blandy stock and $0.6 million in
Gourmange stock. What are the weights for this portfolio? What is the portfolio’s
beta? What is the required return for this portfolio?
Answer: The portfolio’s beta is the weighted average of the stocks’ betas:
bp = 0.7(bBlandy) + 0.3(bGour.)
= 0.7(0.60) + 0.3(1.30)
= 0.81.
Mini Case: 6 – 27
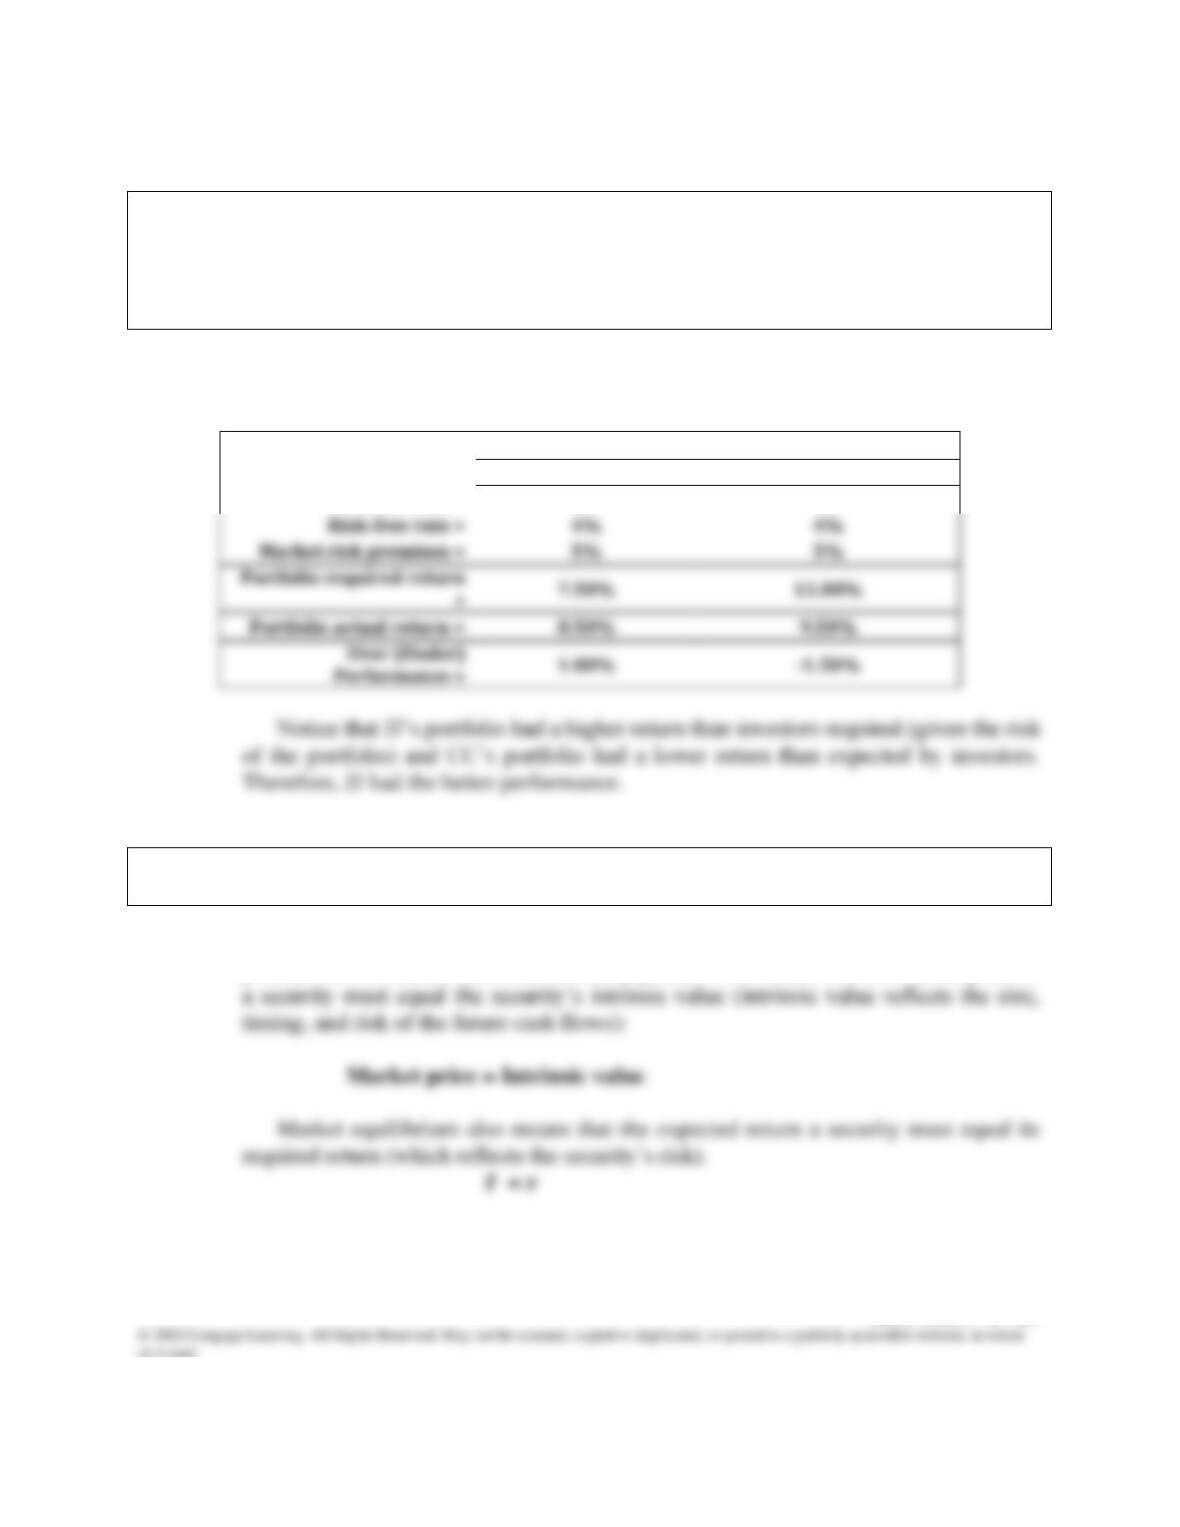
p. Jordan Jones (JJ) and Casey Carter (CC) are portfolio managers at your firm.
Each manages a well-diversified portfolio. Your boss has asked for your opinion
regarding their performance in the past year. JJ’s portfolio has a beta of 0.6 and
had a return of 8.5%; CC’s portfolio has a beta of 1.4 and had a return of 9.5%.
Which manager had better performance? Why?
Answer: To evaluate the managers, calculate the required returns on their portfolios using the
SML and compare the actual returns to the required returns, as follows:
Portfolio Manager
JJ
CC
Portfolio beta =
0.7
1.4
Risk-free rate =
q. What does market equilibrium mean? If equilibrium does not exist, how will it be
established?
Answer: Market equilibrium means that marginal investors (the ones whose trades determine
prices) believe that all securities are fairly priced. This means that the market price of
Mini Case: 6 – 28
r. What is the Efficient Markets Hypothesis (EMH) and what are its three forms?
What evidence supports the EMH? What evidence casts doubt on the EMH?
Answer: The EMH is the hypothesis that securities are normally in equilibrium, and are “priced
fairly,” making it impossible to “beat the market.”
Weak-form efficiency says that investors cannot profit from looking at past
movements in stock prices—the fact that stocks went down for the last few days is no
reason to think that they will go up (or down) in the future. This form has been proven
Web Solutions: 6B – 29
Web Appendix 6B
Calculating Beta Coefficients With a Financial Calculator
Solutions to Problems
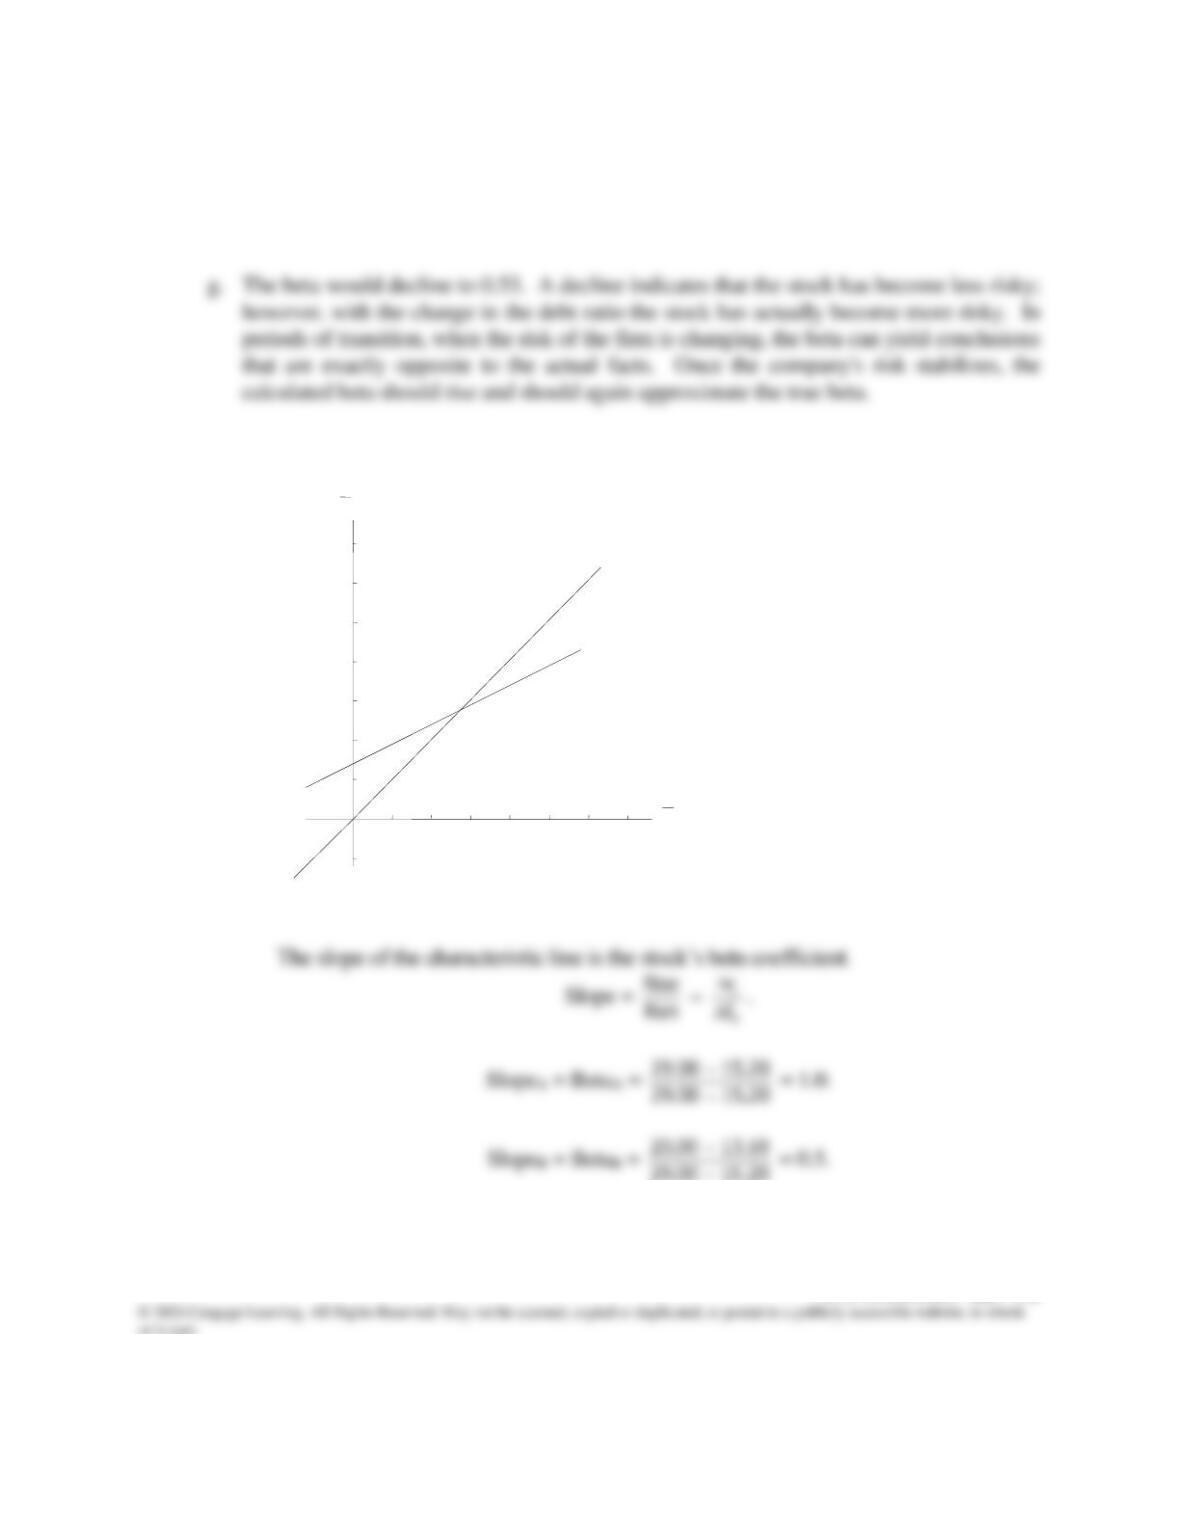
6B-1 a.
b = Slope = 0.62. However, b will depend on students’ freehand line. Using a calculator,
we find b = 0.6171 ≈ 0.62.
2. CAPM assumes that company–specific risk will be eliminated in a portfolio, so the risk
premium under the CAPM would not be affected. However, if the scatter were wide,
we would not have as much confidence in the beta, and this could increase the stock’s
risk and thus its risk premium.
(%)rY
40
30
20
10
–30 –20 –10 10 20 30 40
(%)rM
Web Solutions: 6B – 30
2. Because of a relative scarcity of such stocks and the beneficial net effect on portfolios
that include it, its “risk premium” is likely to be very low or even negative.
Theoretically, it should be negative.
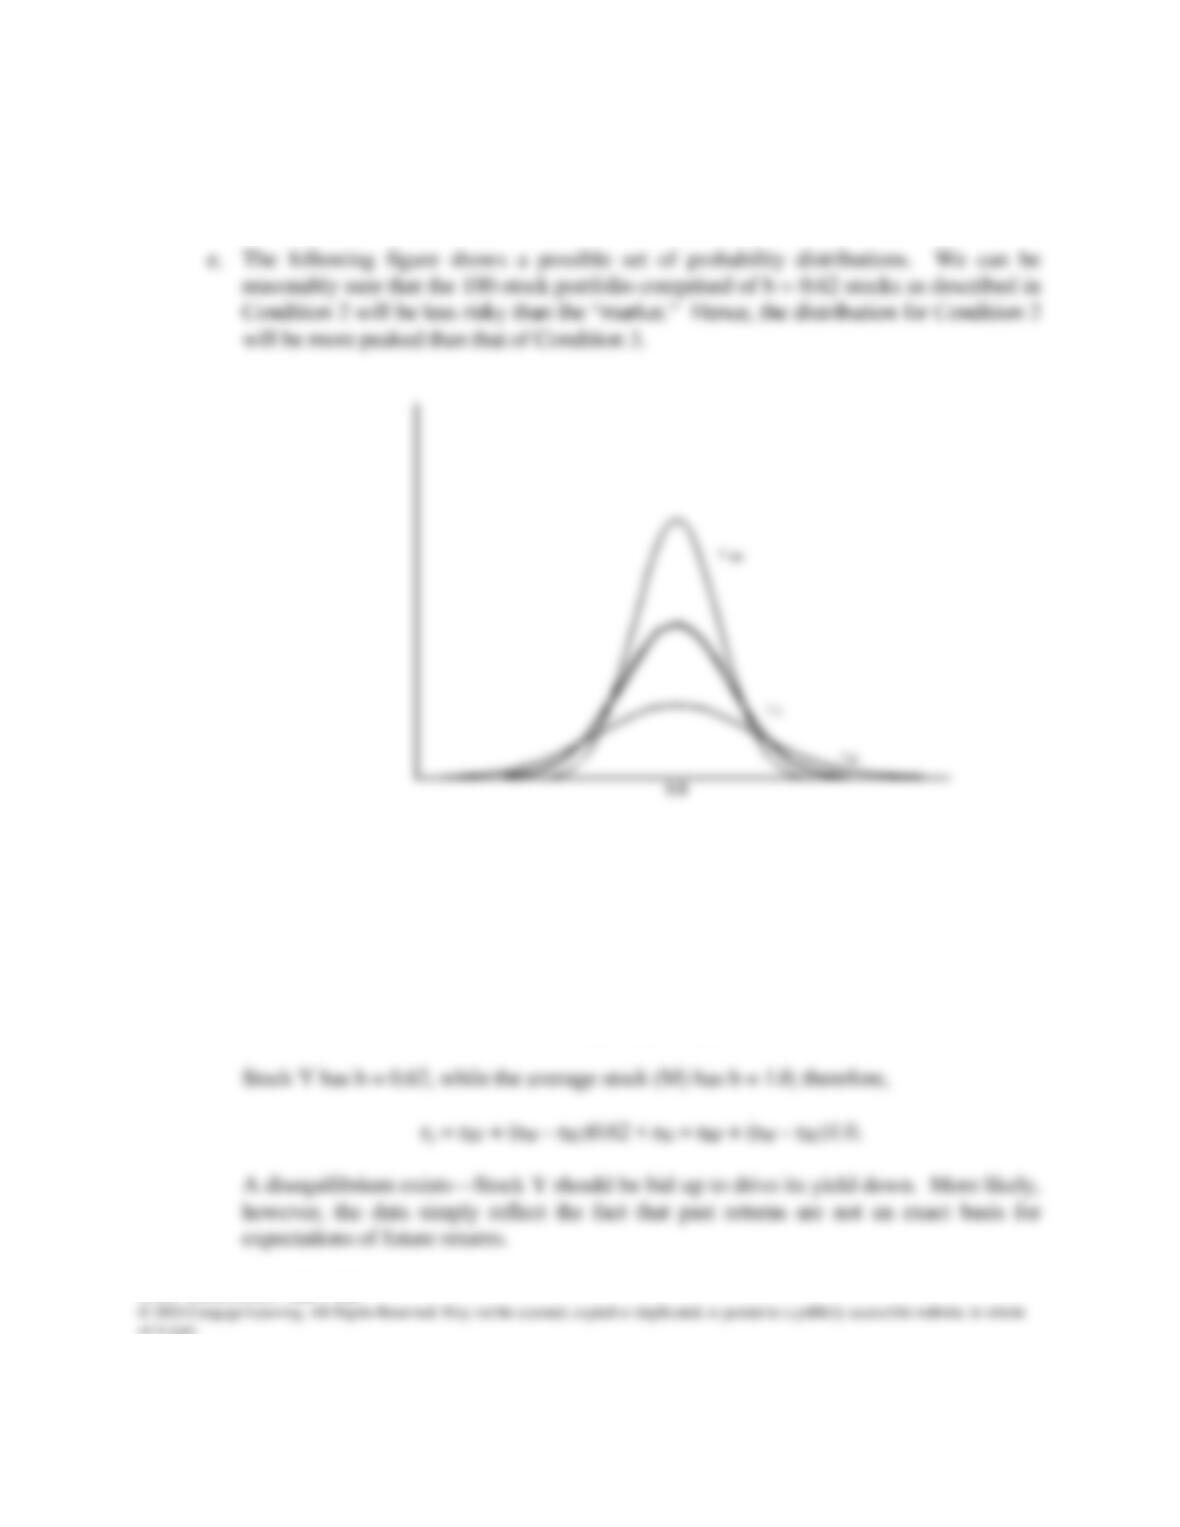
We can also say on the basis of the available information that Y is smaller than M;
Stock Y’s market risk is only 62% of the “market,” but it does have company-specific risk,
while the market portfolio does not, because it has been diversified away. However, we
know from the given data that Y = 13.8%, while M = 19.6%. Thus, we have drawn the
distribution for the single stock portfolio more peaked than that of the market. The relative
rates of return are not reasonable. The return for any stock should be
ri = rRF + (rM – rRF)bi.
Web Solutions: 6B – 31
f. The expected return could not be predicted with the historical characteristic line because
the increased risk should change the beta used in the characteristic line.
6B-2 a.
20.1500.29
−
b.
M
r
ˆ
= 0.1(-14%) + 0.2(0%) + 0.4(15%) + 0.2(25%) + 0.1(44%)
= -1.4% + 0% + 6% + 5% + 4.4% = 14%.
-5
5
10
15
20
25
30
35
510 15 20 25 30 35
ri(%)
rM(%)
Stock A
Stock B
-5
5
10
15
20
25
30
35
510 15 20 25 30 35
ri(%)
rM(%)
Stock A
Stock B
Web Solutions: 6B – 32
The graph of the SML is as follows:
The equation of the SML is thus:
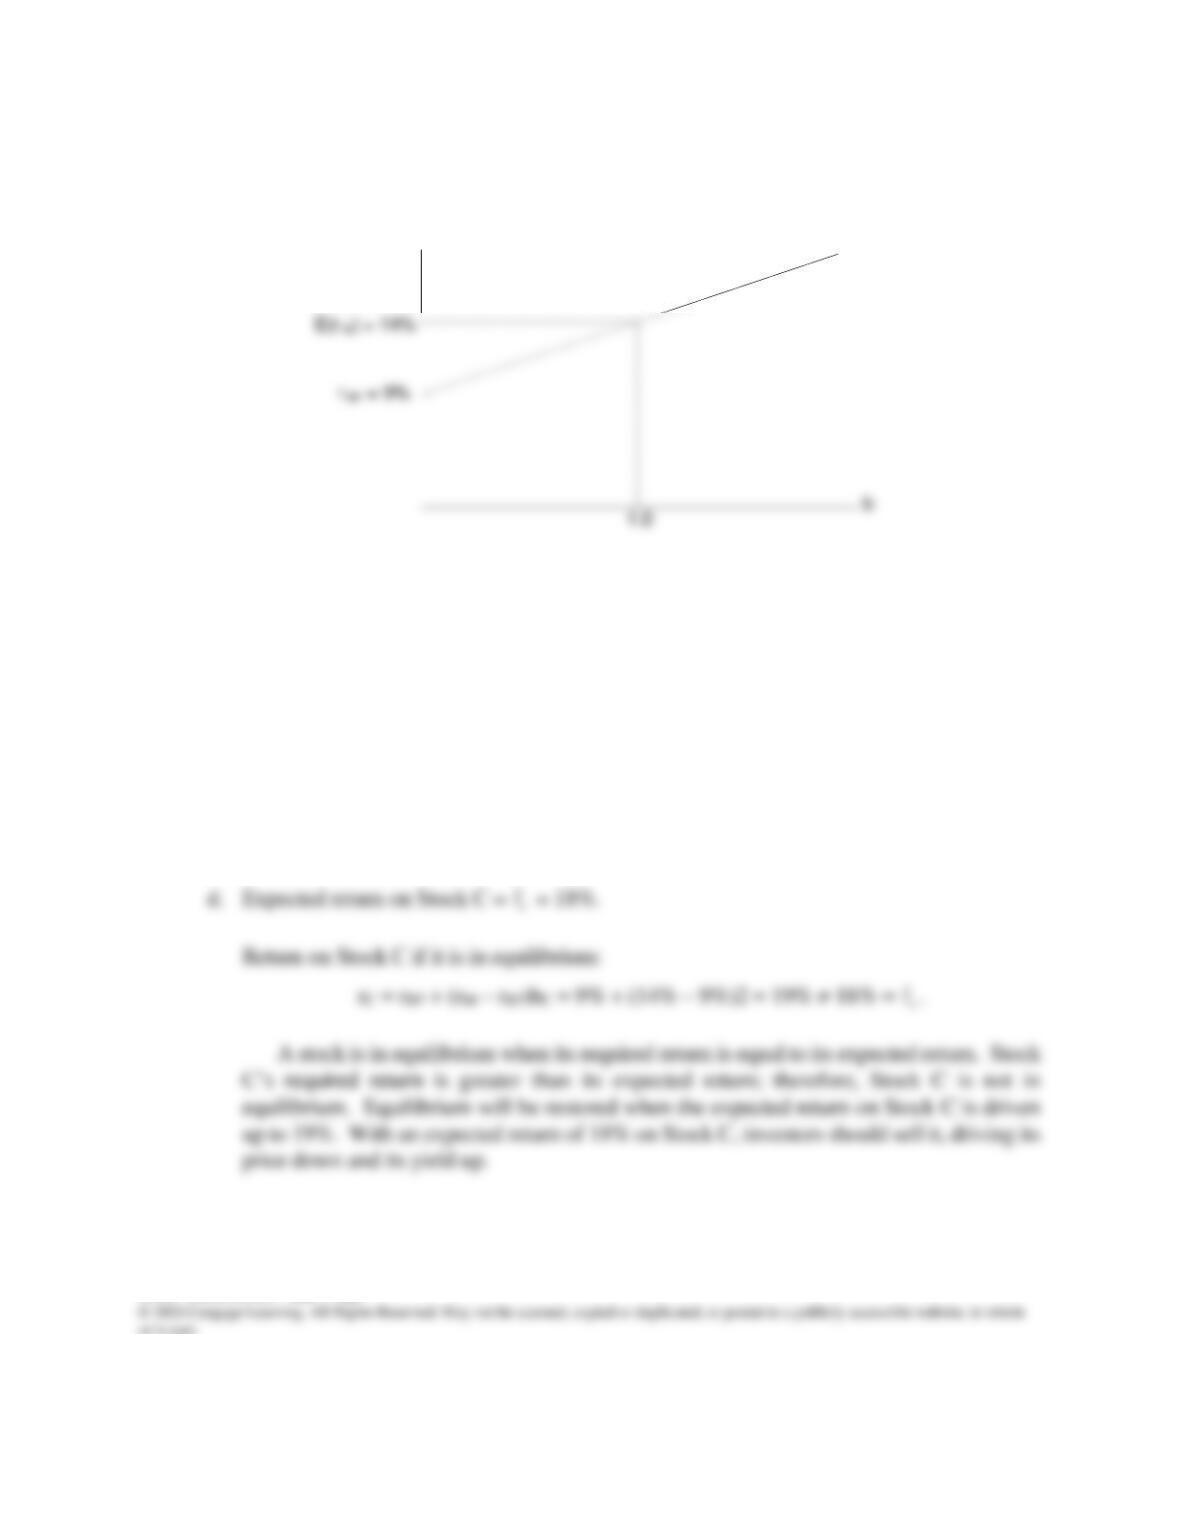
ri = rRF + (rM – rRF)bi = 9% + (14% – 9%)bi = 9% + (5%)bi.
c. Required rate of return on Stock A:
rA = rRF + (rM – rRF)bA = 9% + (14% – 9%)1.0 = 14%.
Required rate of return on Stock B:
rB = 9% + (14% – 9%)0.5 = 11.50%.
SML
ri
SML
ri
SML
ri