
CHAPTER 5
EFFICIENT CAPITAL MARKETS AND TECHNICAL ANALYSIS
Answers to Questions
1. There are several reasons why one would expect capital markets to be efficient, the foremost
being that there are a large number of independent, profit-maximizing investors engaged in
the analysis and valuation of securities. A second assumption is that new information comes
to the market in a random fashion. The third assumption is that the numerous profit–
maximizing investors will adjust security prices rapidly to reflect this new information.
2. The weak-form efficient market hypothesis contends that current stock prices reflect all
available security-market information, including the historical sequence of prices, price
(2) tests of trading rules. Statistical tests of independence can be divided further into two
groups: the autocorrelation tests and the runs tests. The autocorrelation tests are used to test
the existence of significant correlation, whether positive or negative, of price changes on a
particular day with a series of consecutive previous days. The runs tests examine the

5 –
2
3. The semistrong-form efficient market hypothesis contends that security prices adjust rapidly
to the release of all new public information and that stock prices reflect all public
information. The semi-strong form goes beyond the weak form because it includes all market
4. The abnormal rate of return is the amount by which a security’s return differs from the
5. The CAPM is grounded in the theory that investors demand higher returns for higher risks.
As a result of risks specific to each individual security, the announcement of a significant
economic event will tend to affect individual stock prices to a greater or lesser extent than the
market as a whole. Fama, Fisher, Jensen, and Roll portrayed this unique relationship of stock
returns and market return for a period prior to and subsequent to a significant economic event
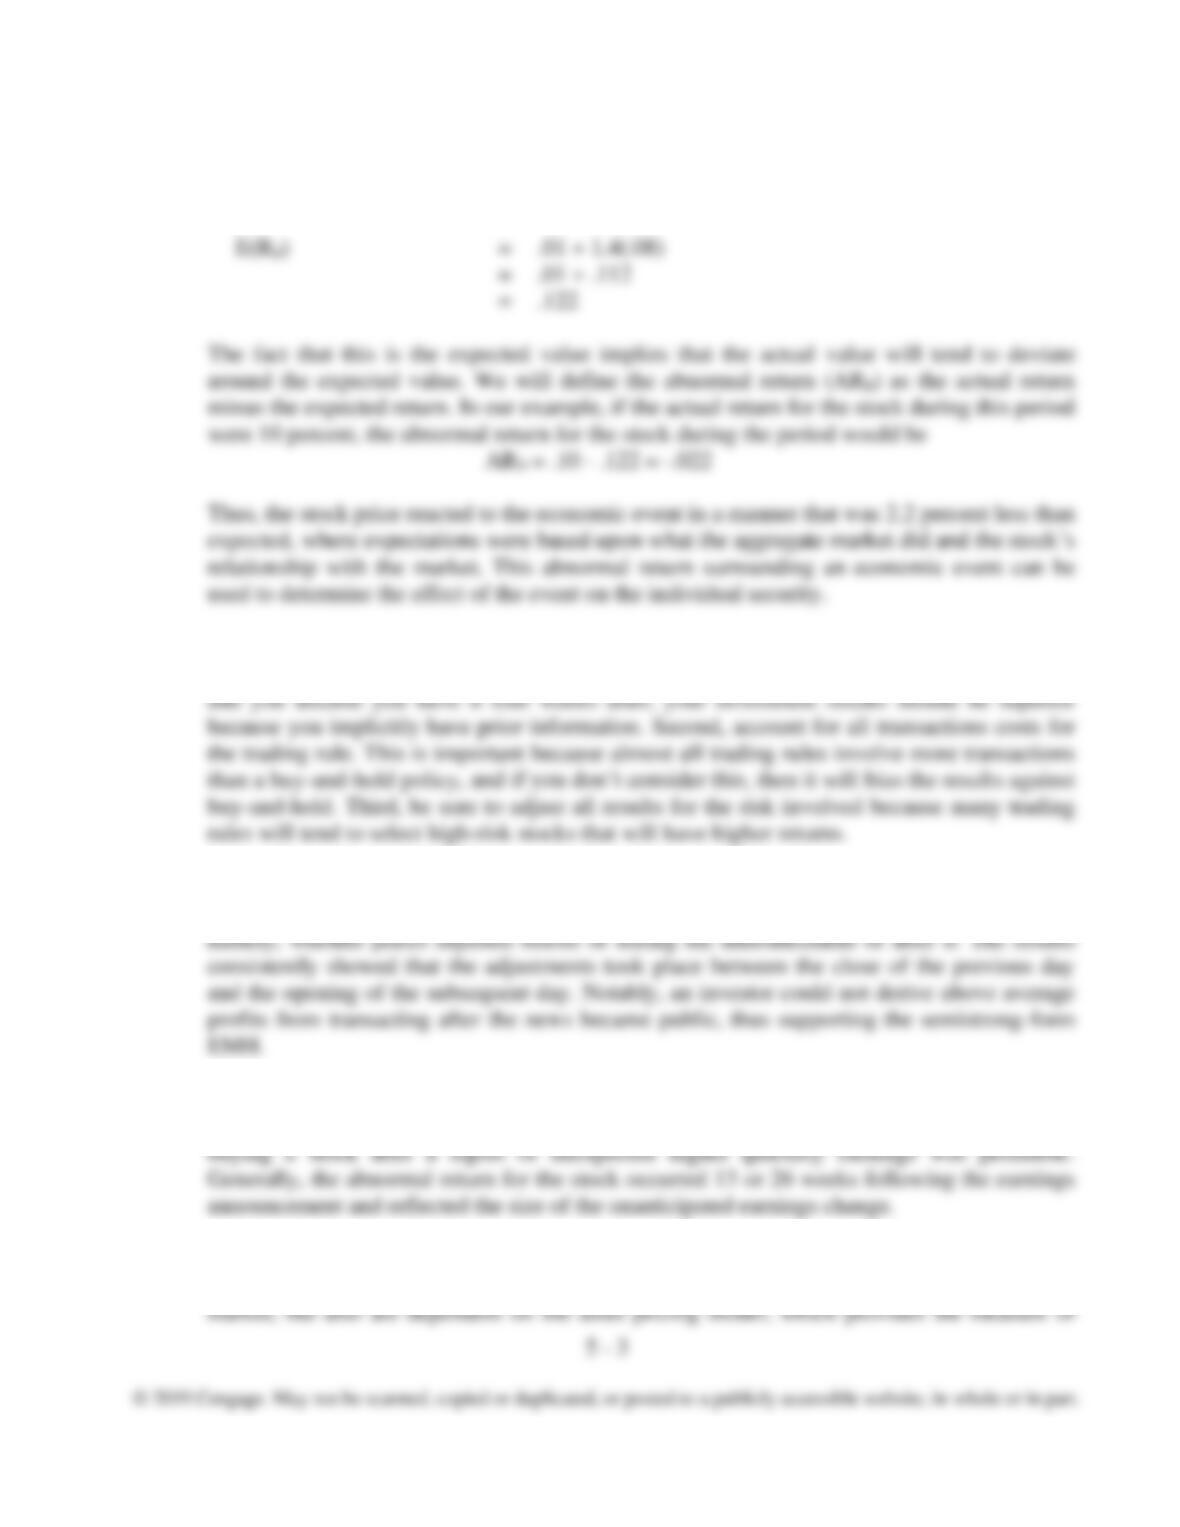
ai = .01 and Bi = 1.40
If the market return (Rmt) during the specified period were 8 percent, the expected return for
stock i would be:
6. First, only use information or data that is publicly available at the time of the decision. As an
example, if you use information that is typically not available until six weeks after a period
7. A number of studies have examined the adjustment of stock prices to major world events.
These studies analyzed the effect of several unexpected world events on stock prices,
8. In the early 1970s, several studies were performed that examined quarterly earnings reports.
The results of the studies provided evidence against the semistrong-form EMH. Specifically,
9. Studies on market efficiency are considered to be dual tests of the EMH and the CAPM.
These tests involve a joint hypothesis because they consider not only the efficiency of the

10. The strong-form efficient market hypothesis asserts that stock prices fully reflect all
information, whether public or private. It goes beyond the semistrong-form because it
11. The strong-form efficient market hypothesis goes beyond the semistrong-form in that it calls
for perfect markets, meaning that no group of investors has monopolistic access to
12. In the early 1970s, a study by the Securities and Exchange Commission found that by having
access to the limit order books as his source of monopolistic information, coupled with low
13. Studies by several authors examined the risk-adjusted performance of professional money
managers for various periods and found support for the strong-form efficient market
14. Behavioral finance deals with individual investor psychology and how it affects individuals’
actions as investors, analysts, and portfolio managers. The goal of behavioral finance is to
15. The proponents of behavioral finance contend that, although standard finance theory is
16. The basic premise of technical analysis is that the information dissemination process is
slow—thus, the adjustment of prices is not immediate but forms a pattern. This view is

17. The proponents of fundamental analysis advocate that at one point in time there is a basic
intrinsic value for the aggregate stock market, alternative industries, and individual securities,
and if this intrinsic value is substantially different from the prevailing market value, then the
18. To be superior in an efficient market, the analyst must be aware of the relevant variables
influencing stock prices and be able to consistently project these accurately. If the analyst
does not have access to inside information and lacks superior analytical ability, then there is
19. Superior analysts should concentrate their efforts in the second tier of stocks because they do
20. The major efforts of the portfolio manager should be directed toward determining the risk
preferences of his clients and offering, accordingly, a portfolio approximating the risk and
return desires of the clientele. Given evidence of the stationarity of beta for a portfolio, this
would not be a difficult task. Further, the level of risk can be controlled by committing a

5 –
6
21. Index funds are security portfolios specially designed to duplicate the performance of the
overall security market, as represented by some selected market index series. The first group
of index funds was created in the early 1970s because people started realizing that capital
markets are efficient and that it is extremely difficult to be a superior analyst. Thus, instead
22. The portfolio manager should continue to allow his two superior analysts to make investment
recommendations for some proportion of the portfolio, making sure that their
recommendations are implemented in a way that would conform to the risk preference of the
23
23(a). The efficient market hypothesis (EMH) states that a market is efficient if security prices
immediately and fully reflect all available relevant information. Efficient means
informationally efficient, not operationally efficient. Operational efficiency deals with the
cost of transferring funds. If the market fully reflects information, the knowledge that
information would not allow anyone to profit from it because stock prices already
incorporate the information.
1. Weak form asserts that stock prices already reflect all information that can be derived by
examining market trading data, such as the history of past prices and trading volume.
2. Semi-strong form states that a firm’s stock price already reflects all publicly available
information about a firm’s prospects. Examples of publicly available information are annual

5 –
7
3. The strong form of EMH holds that current market prices reflect all information, whether
publicly available or privately held, that is relevant to the firm.
Empirical evidence does not support the strong form.
23(b). Technical analysis in the form of charting involves the search for recurrent and predictable
patterns in stock prices to enhance returns. The EMH implies that this type of technical
analysis is without value. If past prices contain no useful information for predicting future
prices, then there is no point in following any technical trading rule for timing the purchases
and sales of securities. According to weak-form efficiency, no investor can earn excess
returns by developing trading rules based on historical price and return information. A simple
23(c). Portfolio managers have several roles or responsibilities even in perfectly efficient markets.
The most important responsibility is to:

1. Identify the risk/return objectives for the portfolio given the investor’s constraints. In an
efficient market, portfolio managers are responsible for tailoring the portfolio to meet the
2. Develop a well-diversified portfolio with the selected risk level. Although an efficient
market prices securities fairly, each security still has firm-specific risk that portfolio
3. Reduce transaction costs with a buy-and-hold strategy. Proponents of the EMH advocate a
passive investment strategy that does not try to find under-or-overvalued stocks. A buy-and-
4. Developing capital market expectations. As part of the asset-allocation decision, portfolio
5. Implement the chosen investment strategy and review it regularly for any needed
24. The principal contention of technicians is that stock prices move in trends that persist for
25. Technicians expect trends in stock price behavior because they believe that new information
that causes a change in the relationship between supply and demand does not come to the
26. The problems encountered when doing a fundamental analysis of financial statements are: (1)
much of the information in financial statements is not useful; (2) there are comparability

27. The disadvantages of technical analysis are: (1) past price patterns may not be repeated in the
28. The mutual fund cash position of 12 percent is relatively high. This would indicate a bullish
market because: (1) the theory of contrary-opinion states that mutual funds are the odd-lot
29. Credit balances result when investors sell securities and leave the proceeds with their broker
with the intent of reinvesting the funds shortly. Therefore, they can be considered a source of
30. This index indicates what proportion of investment advisory services are bearish, and 61
31. Debit balances represent borrowing by sophisticated investors; therefore, higher debit
32. The Dow Theory contends that stock prices move in waves. Specifically, these waves may be
grouped into three categories based upon the period of the wave: (1) major trends for long
33. The direction of a price movement accompanied by high volume is more important than if
34. The breadth of the market index is a time series calculated as the cumulative number of net
advances or net declines. It indicates a peak or trough in stock prices prior to the peak (or

35. Technicians following the breadth of market rules may interpret the event as indicative of a
possible market peak. Because the DJIA is a value-weighted series confined to 30 large well–
36. A support level is a price range in which considerable demand is expected, while a resistance
level is a price range in which a large supply is expected. Support and resistance levels exist
due to the behavior of a number of investors who are closely monitoring the market and will
37. A moving average line indicates the major trend of a security’s price. When daily prices
38. If current prices break through the 50-day MA line from above on heavy volume, technicians
39. Relative strength is the ratio of a firm’s stock price to a market price series. If the relative
40. Technicians recognize that there is no single technical trading rule that is correct all the
time—even the best ones miss certain turns or give false signals. Also, various indicators
5 –
11
CHAPTER 5
Answers to Problems
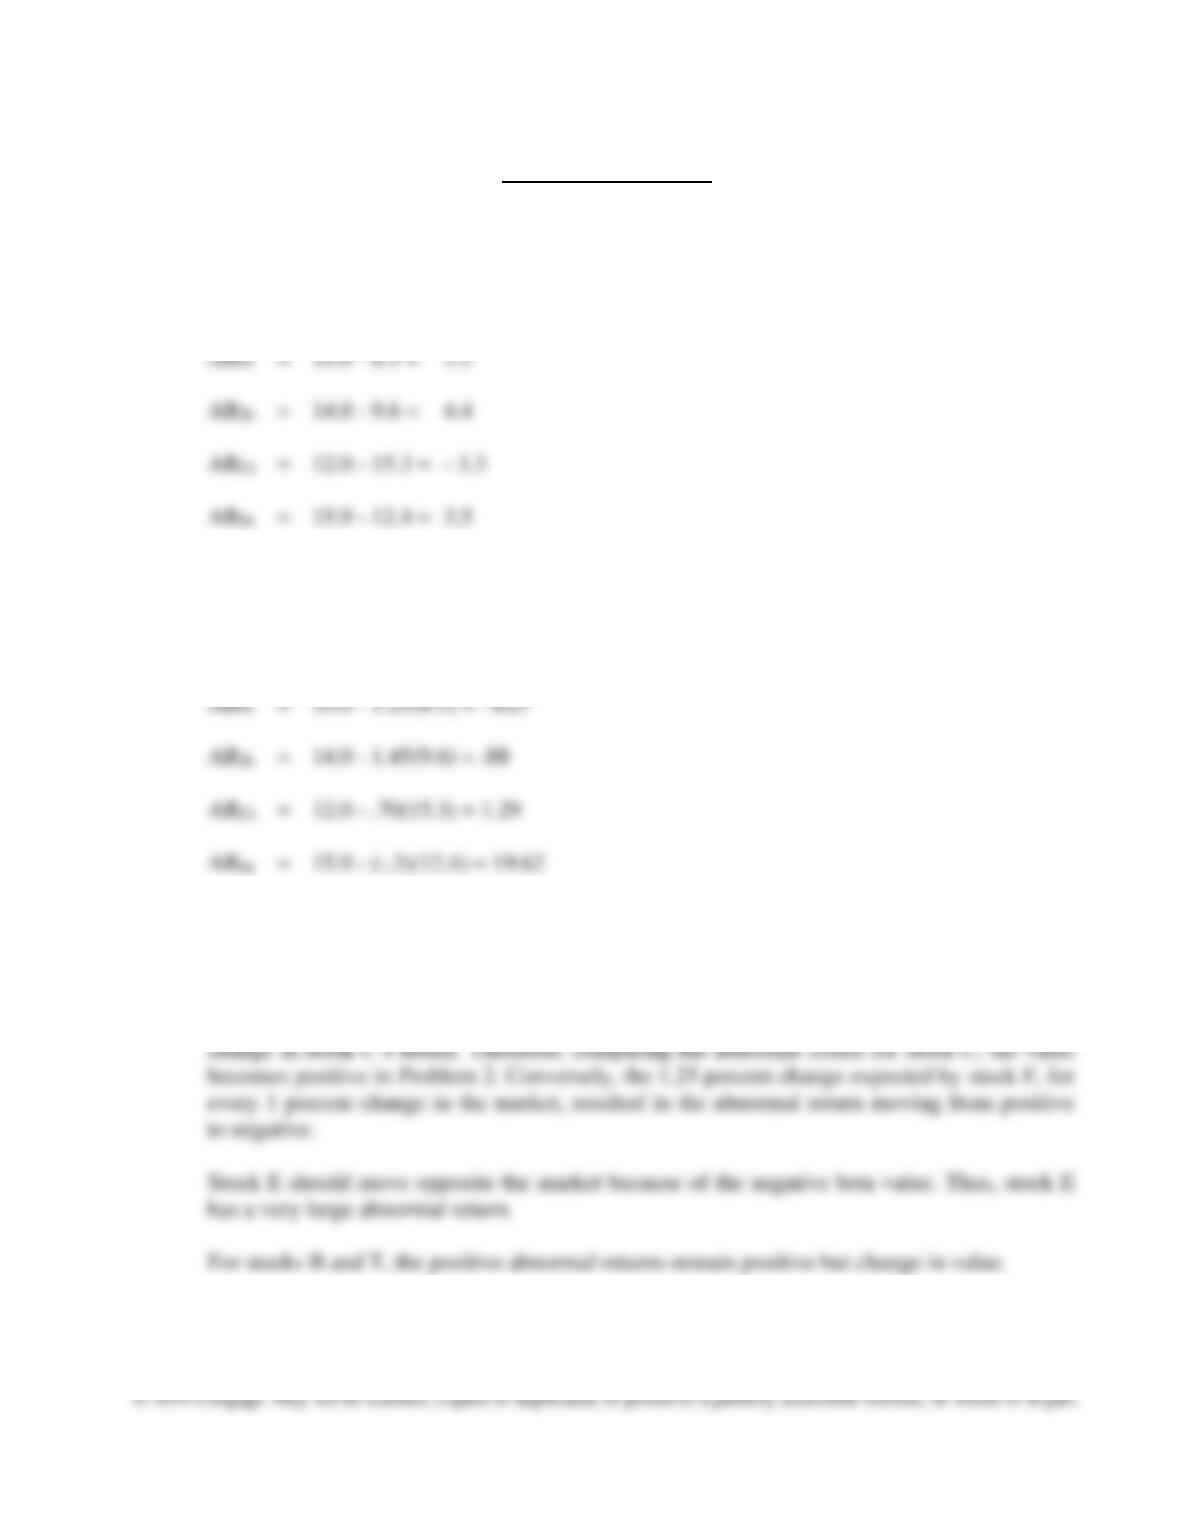
1. ARit = Rit – Rmt
ARBt = 11.5 – 4.0 = 7.5
2. ARit = Rit – (beta) (Rmt)
ARBt = 11.5 – .95(4.0) = 7.7
3. The reason for the difference in each case is due to the implications of beta. Beta determines
how the stock will move in relation to movements in the market.
Considering stock C, a one percent change in the market return will result in a .70 percent
4. Student Exercise

5 –
12
6. Student Exercise
8. 40
39
38 X 0
37 X 0
36 X 0
25 X
24 X
23 X
9.a. Day 4 = (14,010 + 14,100 + 14,165 + 14,080)/4 = 56,355/4 = 14,088.75
Day 5 = (14,100 + 14,165 + 14,080 + 14,070)/4 = 56,415/4 = 14,103.75

9.b. With this value for Day 13, the four-day moving average would be
10. Day 1 2 3 4 5
Net advances +448 +95 +519
-499 -193
(advances minus declines)