C04
Chapter 4 Spreadsheet Problem Solutions (C04)
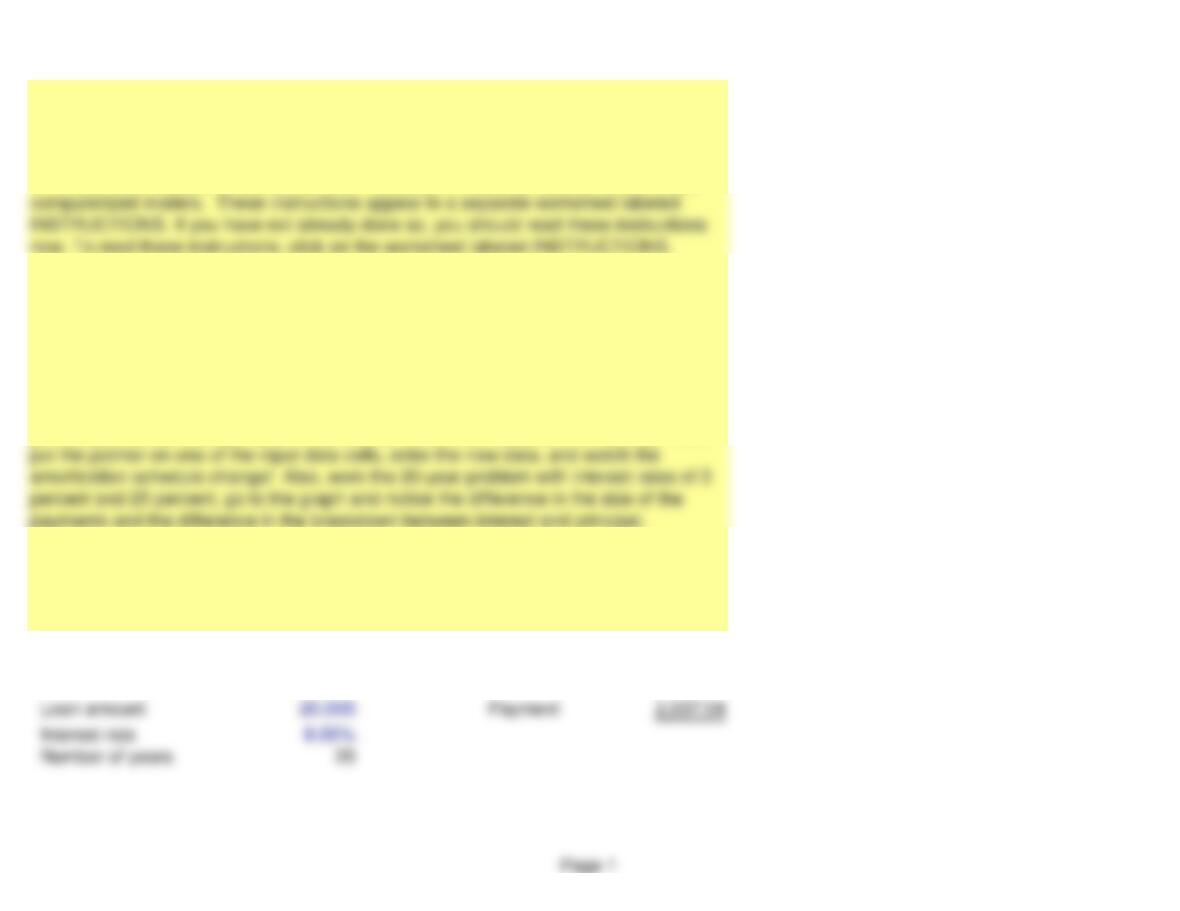
INPUT DATA: KEY OUTPUT:
Amortization Schedule
1. There are a number of instructions with which you should be familiar to use these
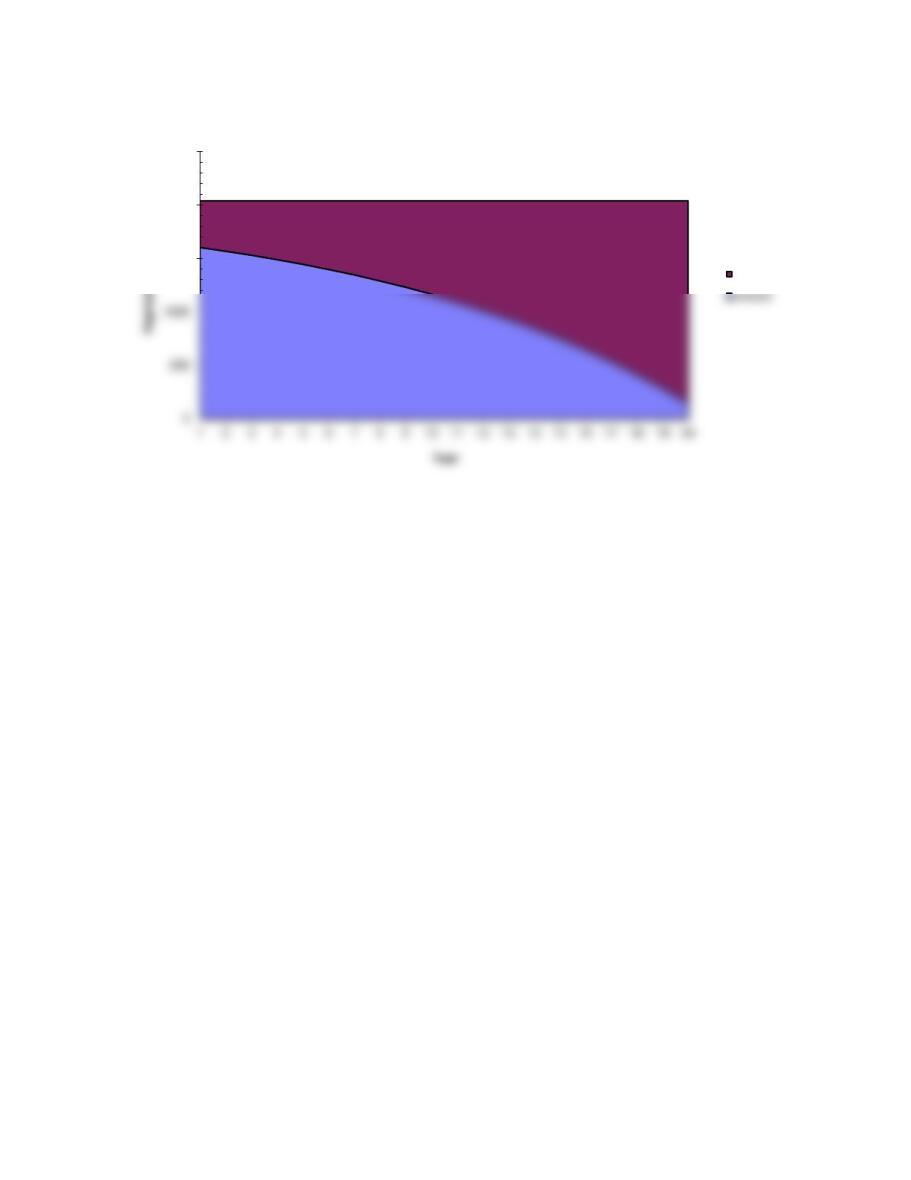
2. A graph that shows the total payment, the interest component, and the principal
repayment component for the 20-year loan will be displayed if you click the worksheet
labeled GRAPH at the bottom of this spreadsheet. To return to this worksheet, click on
the worksheet labeled C04 at the bottom of the GRAPH worksheet.
3. Begin by arranging the worksheet so that Row 21 is the top line on the screen. This
permits you to see the input data and the amortization schedule simultaneously. Then
amortization schedule change! Also, work the 20-year problem with interest rates of 3
percent and 25 percent, go to the graph and notice the difference in the size of the
payments and the difference in the breakdown between interest and principal.
4. Cells F25..F44 contain the present value of each annual payment discounted at the
appropriate interest rate. As you change the interest rate you can see what happens to
each discounted payment. The sum of this range is equal to the original amount of the
loan.
C04
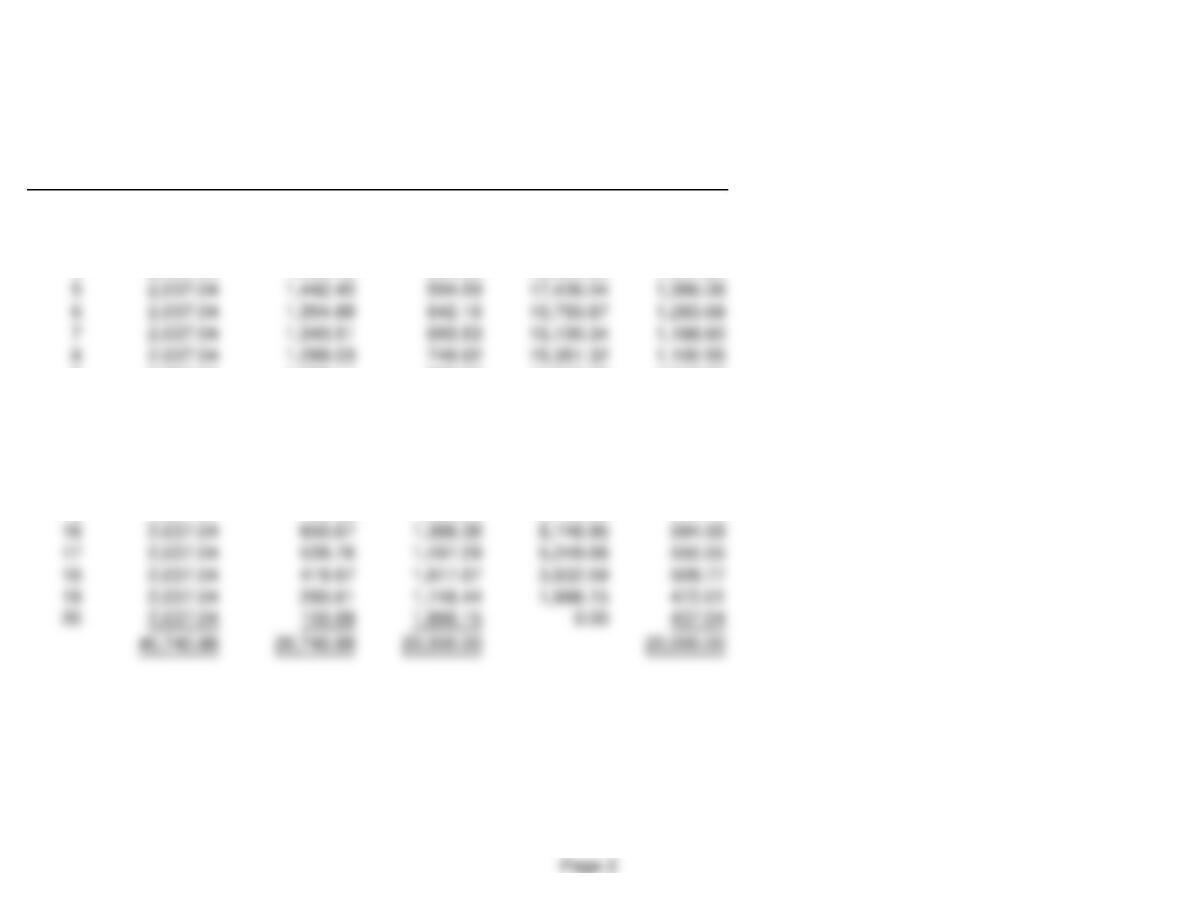
MODEL-GENERATED DATA:
Amortization schedule:
Principal Remaining PV of
Year Payment Interest Repayment Balance Payments
1 2,037.04 1,600.00 437.04 19,562.96 1,886.15
2 2,037.04 1,565.04 472.01 19,090.95 1,746.44
3 2,037.04 1,527.28 509.77 18,581.18 1,617.07
9 2,037.04 1,228.11 808.94 14,542.39 1,019.03
10 2,037.04 1,163.39 873.65 13,668.73 943.55
11 2,037.04 1,093.50 943.55 12,725.19 873.65
12 2,037.04 1,018.01 1,019.03 11,706.16 808.94
13 2,037.04 936.49 1,100.55 10,605.61 749.02
14 2,037.04 848.45 1,188.60 9,417.01 693.53
15 2,037.04 753.36 1,283.68 8,133.33 642.16
GRAPH
1500
2000
2500
Principal
Page 3

We have already entered the base case data for each model in this
file, and the models have performed the analysis for preceding parts
of the problem. You will need to enter the data for each of the
remaining parts of the problem–we indicate in each problem the parts
that should be done using the spreadsheet. However, there are several
points worth noting before you go into a model:
1. The input data are entered in specified cells in the INPUT DATA
section. When you change an input item, the model automatically
2. The key output data are displayed to the right of the INPUT DATA
section or immediately below it. This placement permits you to
change an input and instantly see how that change affects the output
of the model. This is extremely useful in sensitivity analysis.
3. Input data items that you can change are distinguished from the
ones you should not change. The items that you can change are
highlighted in color (blue) whereas the other items are printed in black.
5. Instructions and comments concerning specific models accompany
GENERAL INSTRUCTIONS FOR COMPUTERIZED PROBLEM SOLUTIONS