CHAPTER 4
SECURITY MARKET INDEXES AND INDEX FUNDS
Answers to Questions
1. The purpose of security-market indexes is to provide a general indication of the aggregate
market changes or market movements. More specifically, the indexes are used to derive
market returns for a period of interest and then used as a benchmark for evaluating the
2. A characteristic that differentiates alternative market indexes is the sample—the size of
the sample (how representative of the total market it is) and the source (whether securities
3. A price-weighted series is an arithmetic average of current prices of the securities
included in the sample—i.e., closing prices of all securities are summed and divided by
4. A value-weighted index begins by deriving the initial total market value of all stocks used
in the series (market value equals number of shares outstanding multiplied by current
4-
2
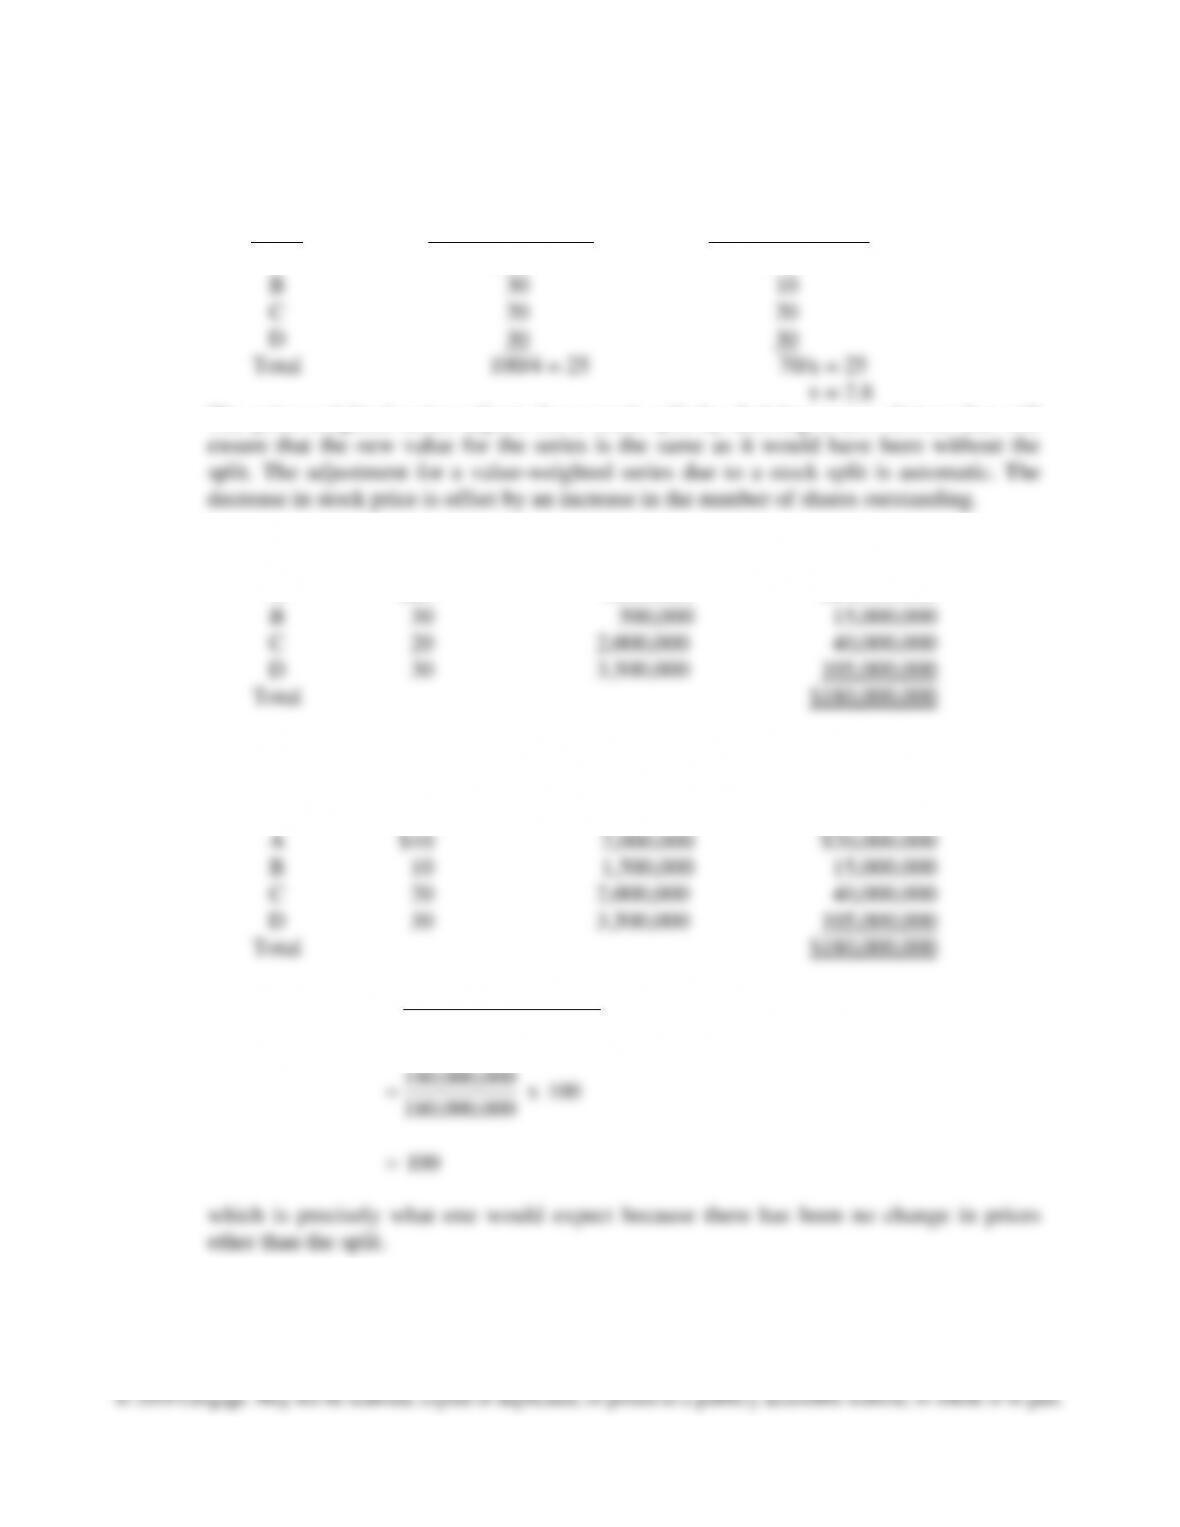
5. Given a four security series and a 2-for-1 split for security A and a 3-for-1 split for
security B, the divisor would change from 4 to 2.8 for a price-weighted series.
Stock Before Split Price After Split Prices
A $20 $10
The price-weighted series adjusts for a stock split by deriving a new divisor that will
Before Split
Stock Price/Share # of Shares Market Value
A $20 1,000,000 $20,000,000
The $180,000,000 base value is set equal to an index value of 100.
After Split
Stock Price/Share # of Shares Market Value
6. In an unweighted price index series (perhaps more appropriately called an “unweighted”
or “equally–weighted” index), all stocks carry equal weight irrespective of their price
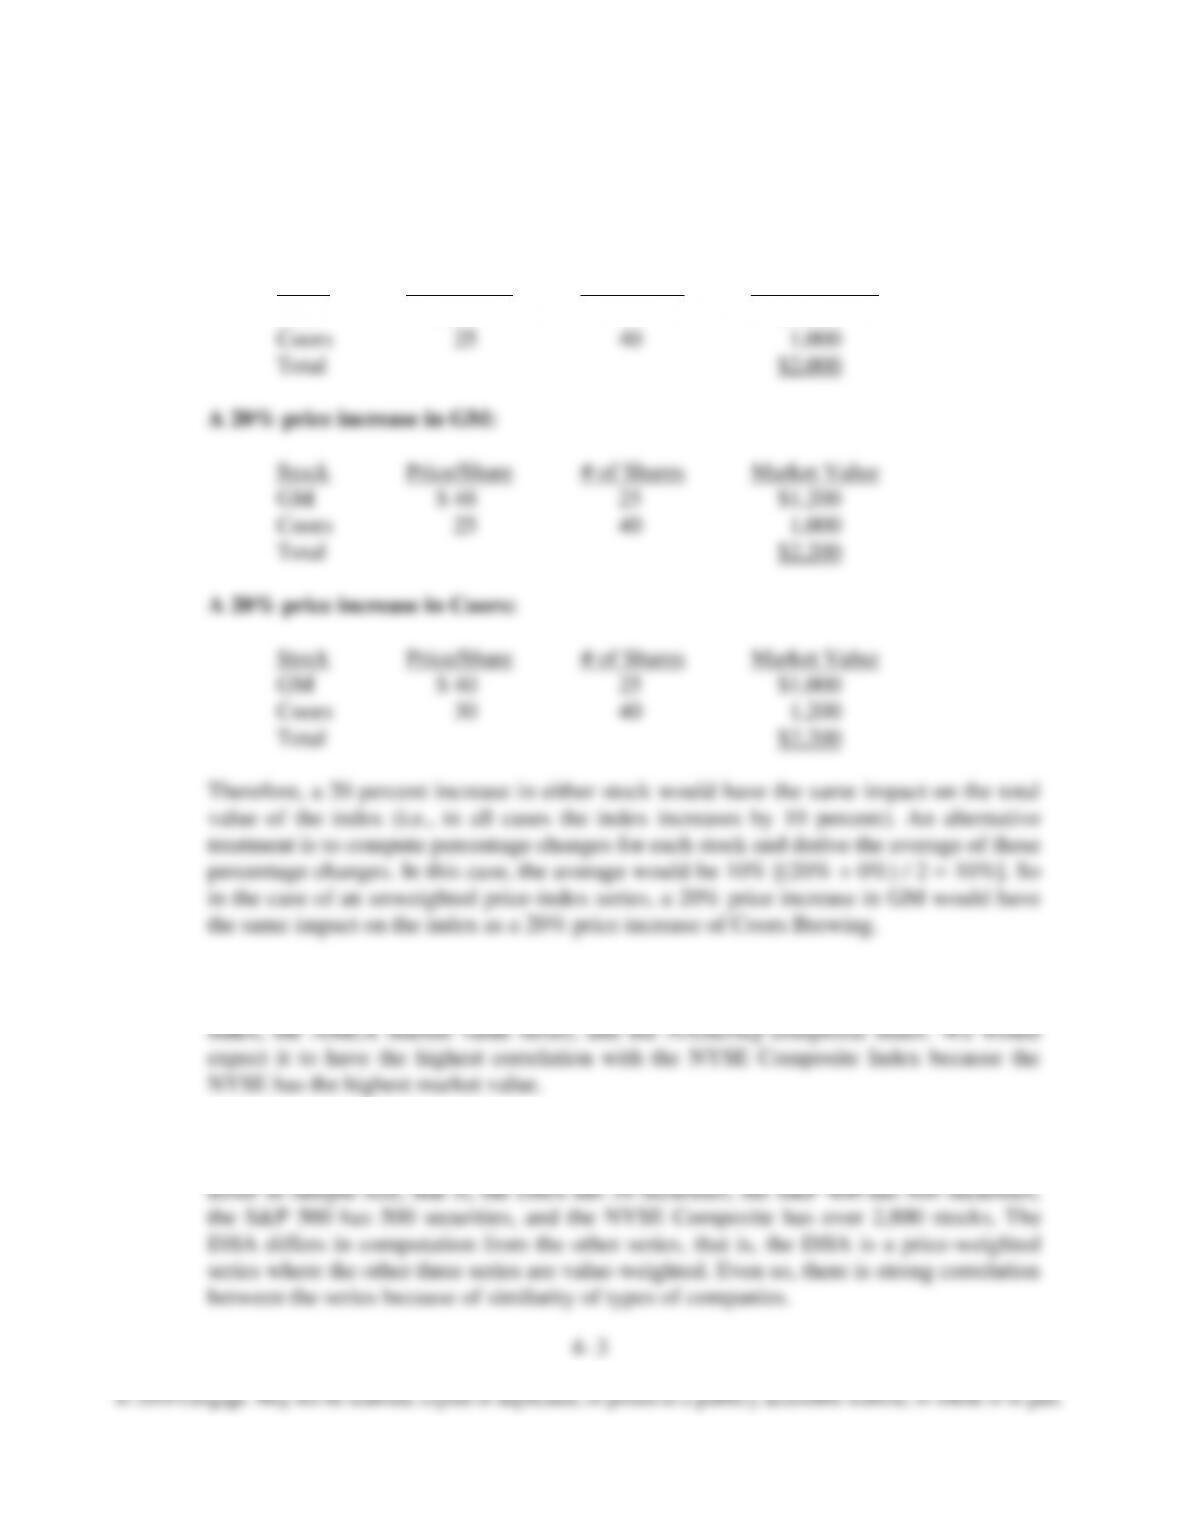
and/or their value. One way to visualize an unweighted series is to assume that equal
dollar amounts are invested in each stock in the portfolio, for example, an equal amount
of $1,000 is assumed to be invested in each stock. Therefore, the investor would own 25
shares of GM ($40/share) and 40 shares of Coors Brewing ($25/share). An unweighted
price index that consists of these two stocks would be constructed as follows:
Stock Price/Share # of Shares Market Value
GM $ 40 25 $1,000
7. Based upon the sample from which it is derived and the fact that is a value-weighted
index, the Wilshire 5000 Equity Index is a weighted composite of the NYSE composite
8. The high correlations between returns for alternative NYSE price index series can be
attributed to the source of the sample (i.e., stock traded on the NYSE). The four series
9. The two price indexes (Tokyo SE and Nikkei) for the Tokyo Stock Exchange show a
high positive correlation (0.82). However, the two indexes represent substantially
10. Because the equal-weighted series implies that all stocks carry the same weight,
irrespective of price or value, the results indicate that on average all stocks in the index
11. The bond-market series are more difficult to construct due to the wide diversity of bonds
available. Also bonds are hard to standardize because their maturities and market yields
12. Because the Merrill Lynch-Wilshire Capital Markets index is composed of a distribution
13. The Russell 1000 and Russell 2000 represent two different samples of stocks, segmented
by size. The fact that the Russell 2000 (which is composed of the smallest 2,000 stocks in
14. One would expect that the level of correlation between the various world indexes should
15. High yield bonds (ML High Yield Bond Index) have definite equity characteristics.
16. Indexes with the broadest representation of U.S. stocks include the Wilshire 5000, the
NYSE Composite, and possibly the Nasdaq composite. These indexes would be
4-
5
17. Two investment products that managers may use to track the S&P 500 index include
index mutual funds, such as Vanguard’s 500 Index Fund (VFINX) and SPDRs, an ETF
CHAPTER 4
Answers to Problems
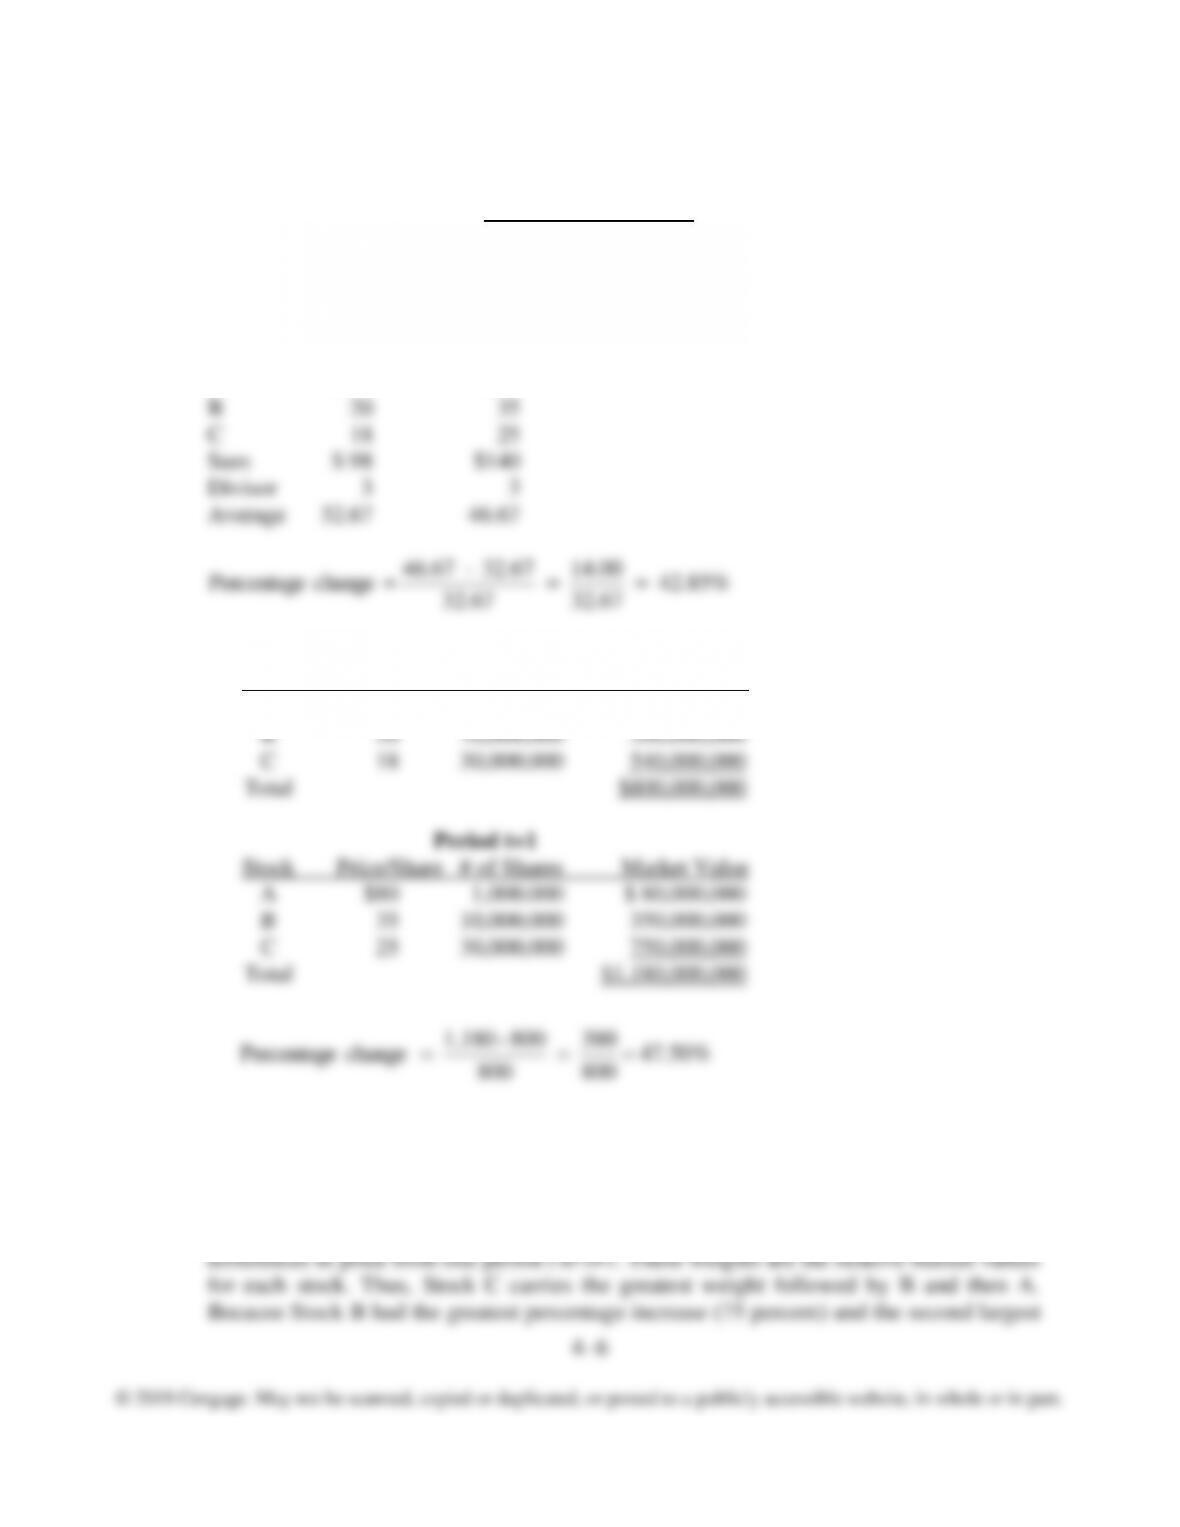
1(a). Given a three security series and a price change from period t to t+1, the percentage
change in the series would be 42.85 percent.
Period t Period t+1
A $ 60 $ 80
1(b). Period t
Stock Price/Share # of Shares Market Value
A $60 1,000,000 $ 60,000,000
1(c). The percentage change for the price-weighted series is a simple average of the
differences in price from one period to the next. Equal weights are applied to each price
change.
The percentage change for the value-weighted series is a weighted average of the
42.85%
32.67
14.00
32.67
32.67 – 46.67
change Percentage ===
47.50%
800
380
800
800 – 1,180
change Percentage ===
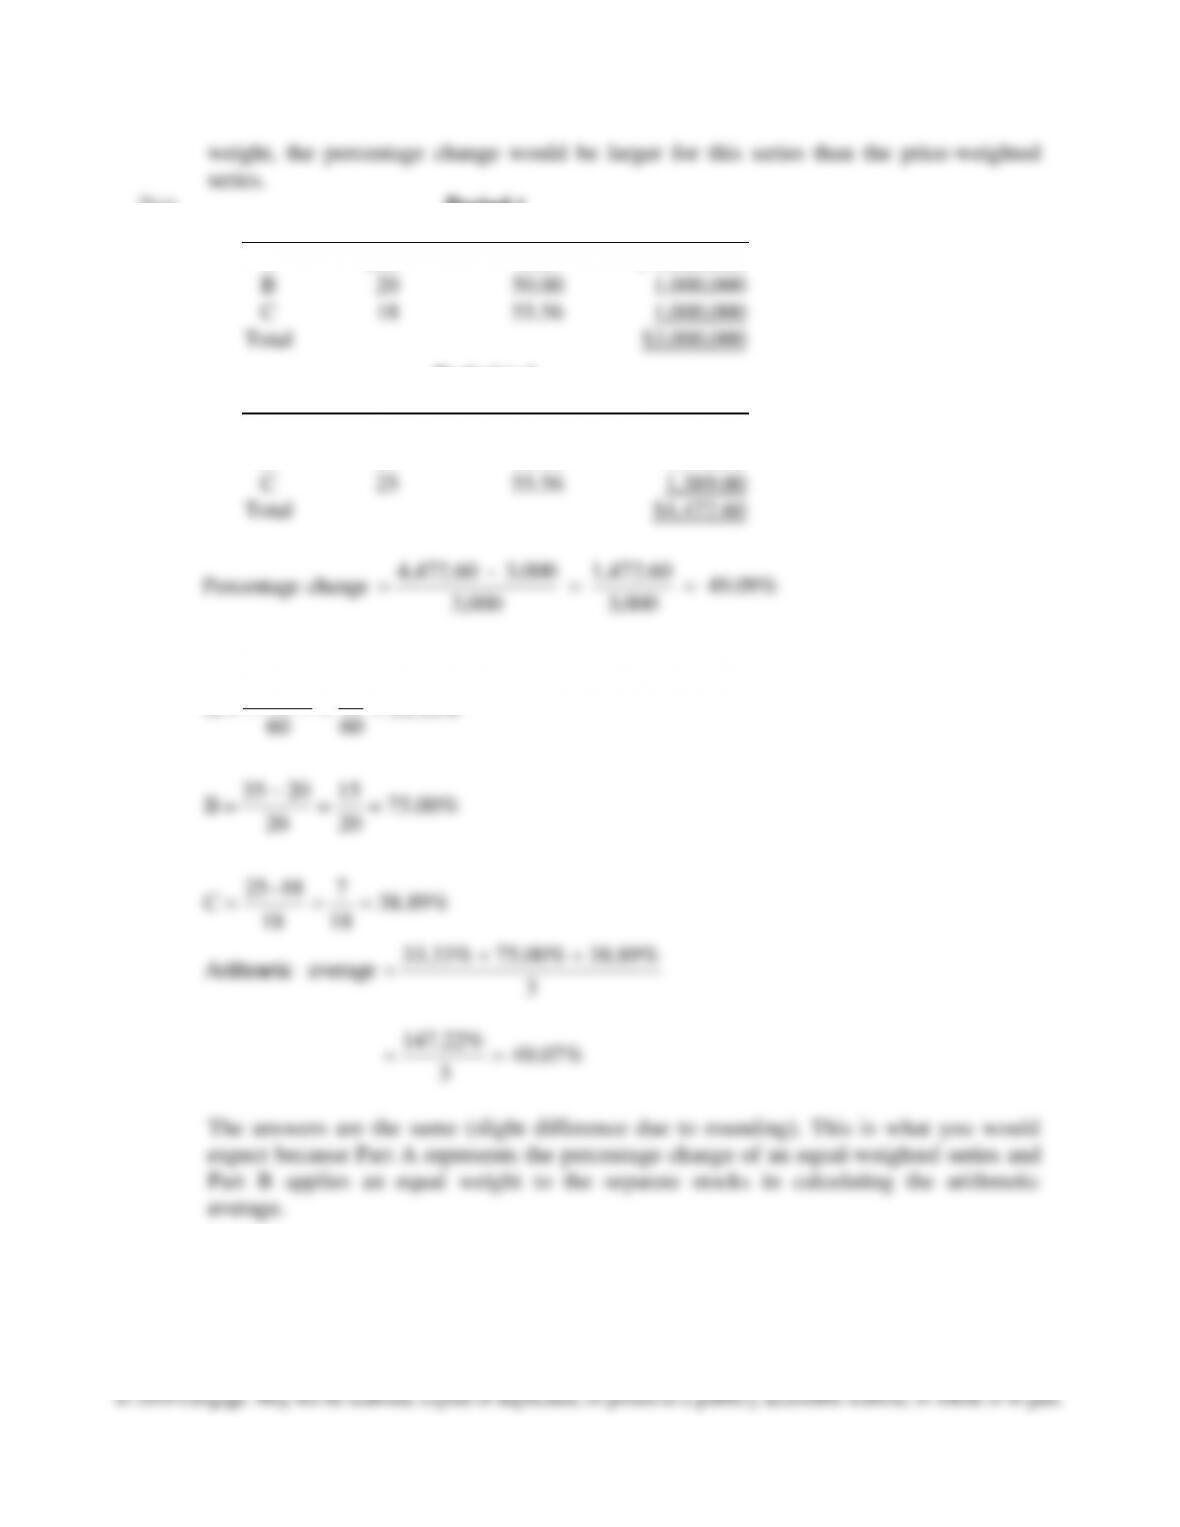
2(a). Period t
Stock Price/Share # of Shares Market Value
A $60 16.67 $ 1,000,000
Period t+1
Stock Price/Share # of Shares Market Value
A $80 16.67 $ 1,333.60
B 35 50.00 1,750.00
2(b).
2(c). Geometric average is the nth root of the product of n items.
49.09%
000,3
1,472.60
3,000
3,000 – 4,472.60
change Percentage ===
%89.38
18
7
18
18–25
C
%00.75
20
15
20
2035
B
%33.33
60
20
60
6080
A
===
==
−
=
==
−
=
%07.49
3
%22.147
3
38.89%75.00%33.33%
average Arithmetic
==
++
=
3. Student Exercise
4(a).
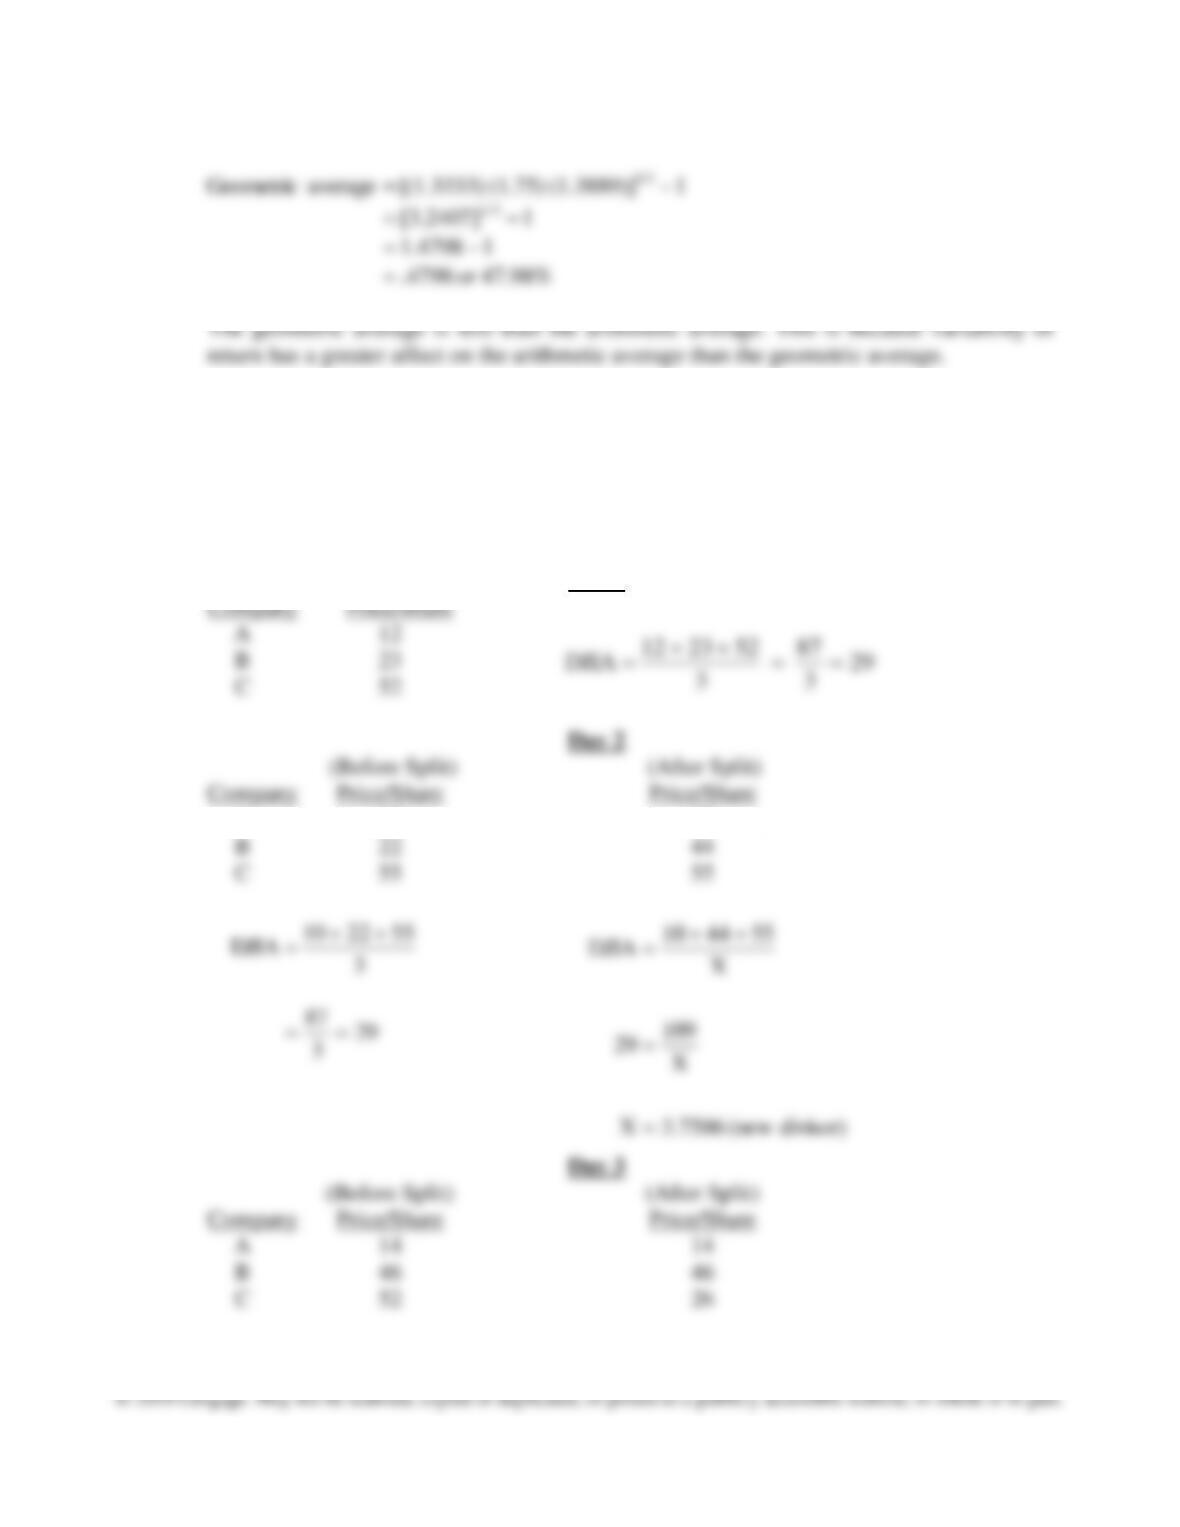
Day 1
A 10 10
47.98%or 4798. 14798.1 1]2407.3[
1(1.3889)] (1.75) [(1.3333) average Geometric
3/1
1/3
=
−=
−=
−=
=
=
30
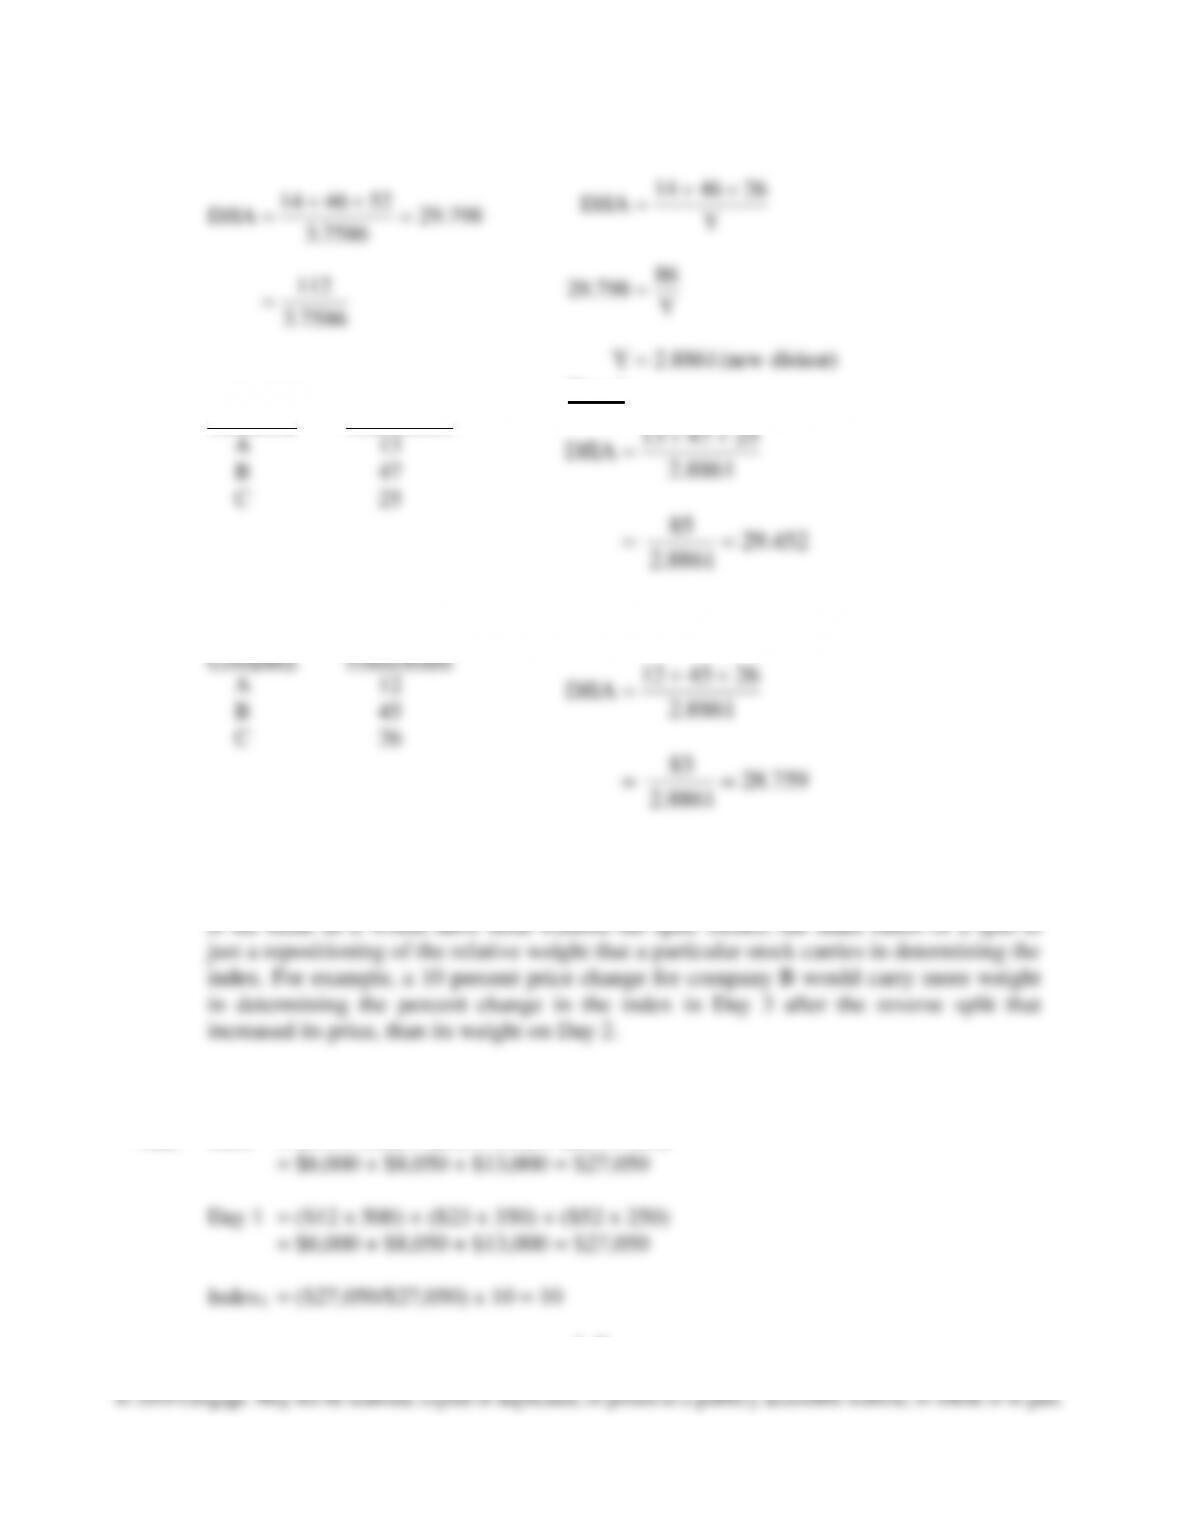
1i adjit D/P DJIA
Company Price/Share
Day 5
2.8861
26 45 12
++
4(b). Because the index is a price-weighted average, the higher priced stocks carry more
weight. But when a split occurs, the new divisor ensures that the new value for the series
4(c). Student Exercise
5(a). Base = ($12 x 500) + ($23 x 350) + ($52 x 250)
2.8861
25 47 13
++
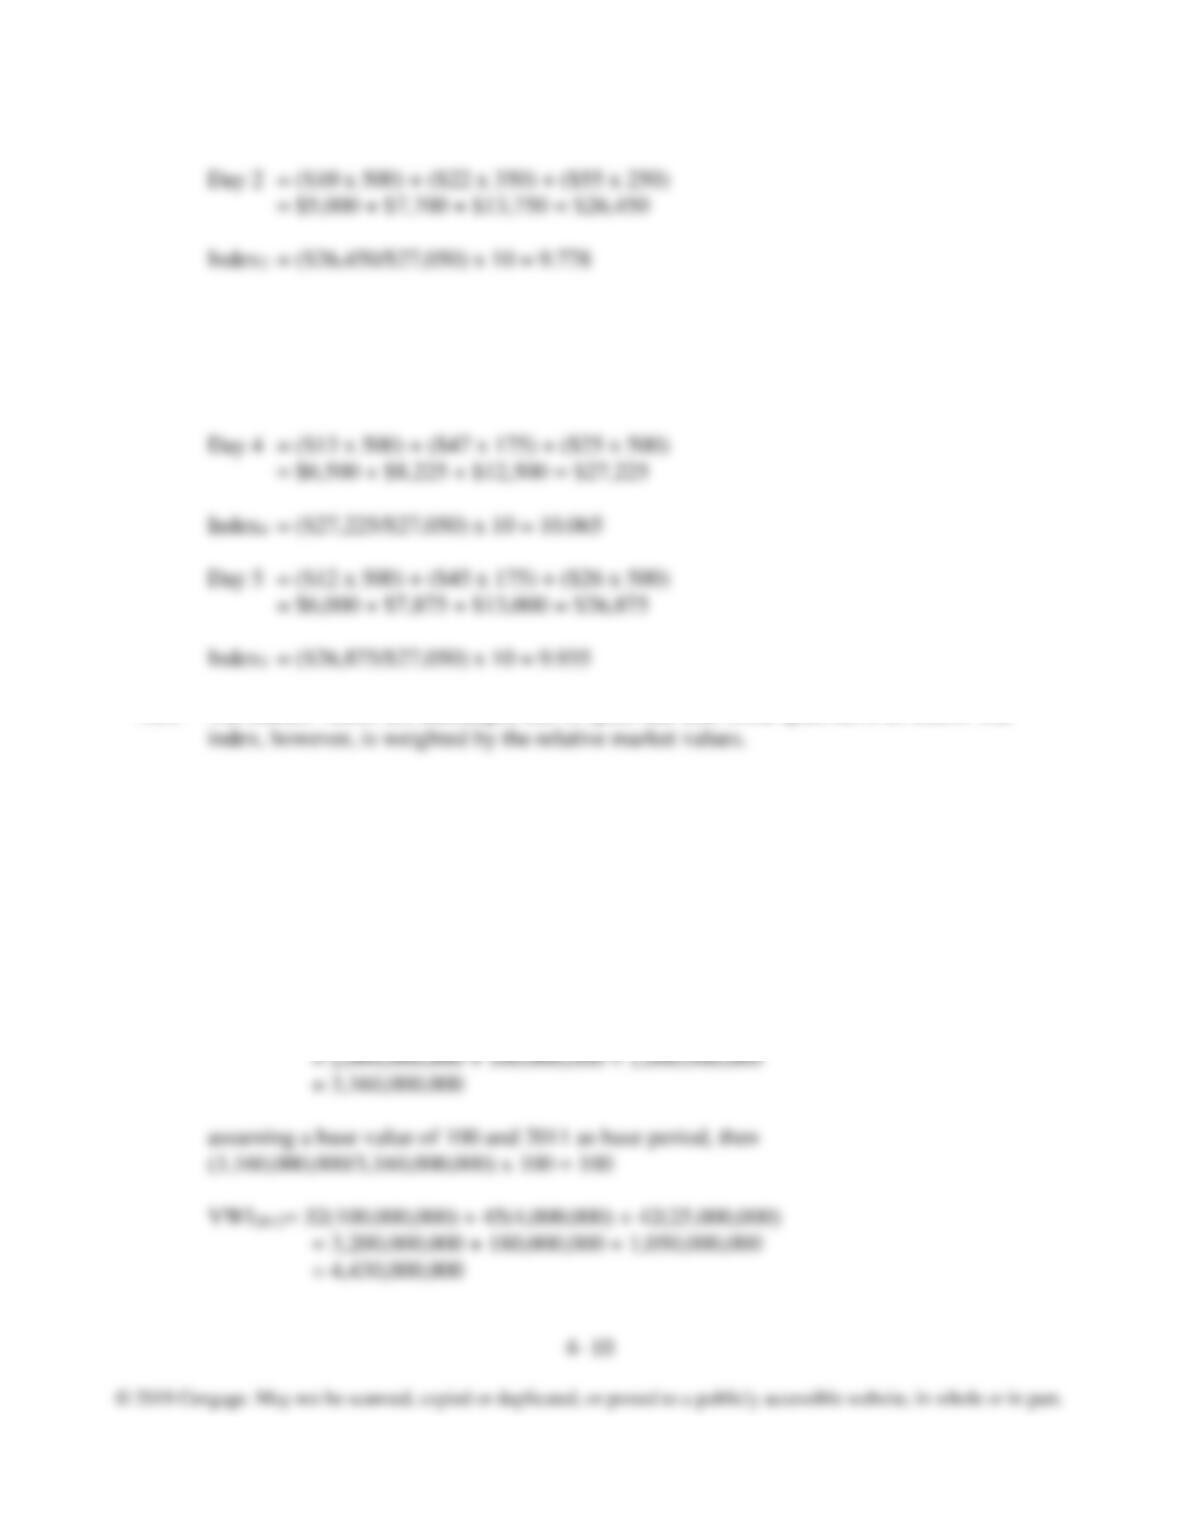
Day 3 = ($14 x 500) + ($46 x 175) + ($52 x 250)
= $7,000 + $8,050 + $13,000 = $28,050
Index3 = ($28,050/$27,050) x 10 = 10.370
5(b). The market values are unchanged due to splits and thus stock splits have no effect. The
6. Price-weighted index (PWI)2011 = (20 + 80+ 40)/3 = 46.67
To account for stock split, a new divisor must be calculated:
(20 + 40 + 40)/X = 46.67
X = 2.143 (new divisor after stock split)
Price-weighted index2012 = (32 + 45 + 42)/2.143 = 55.53
VWI2011 = 20(100,000,000) + 80(2,000,000) + 40(25,000,000)
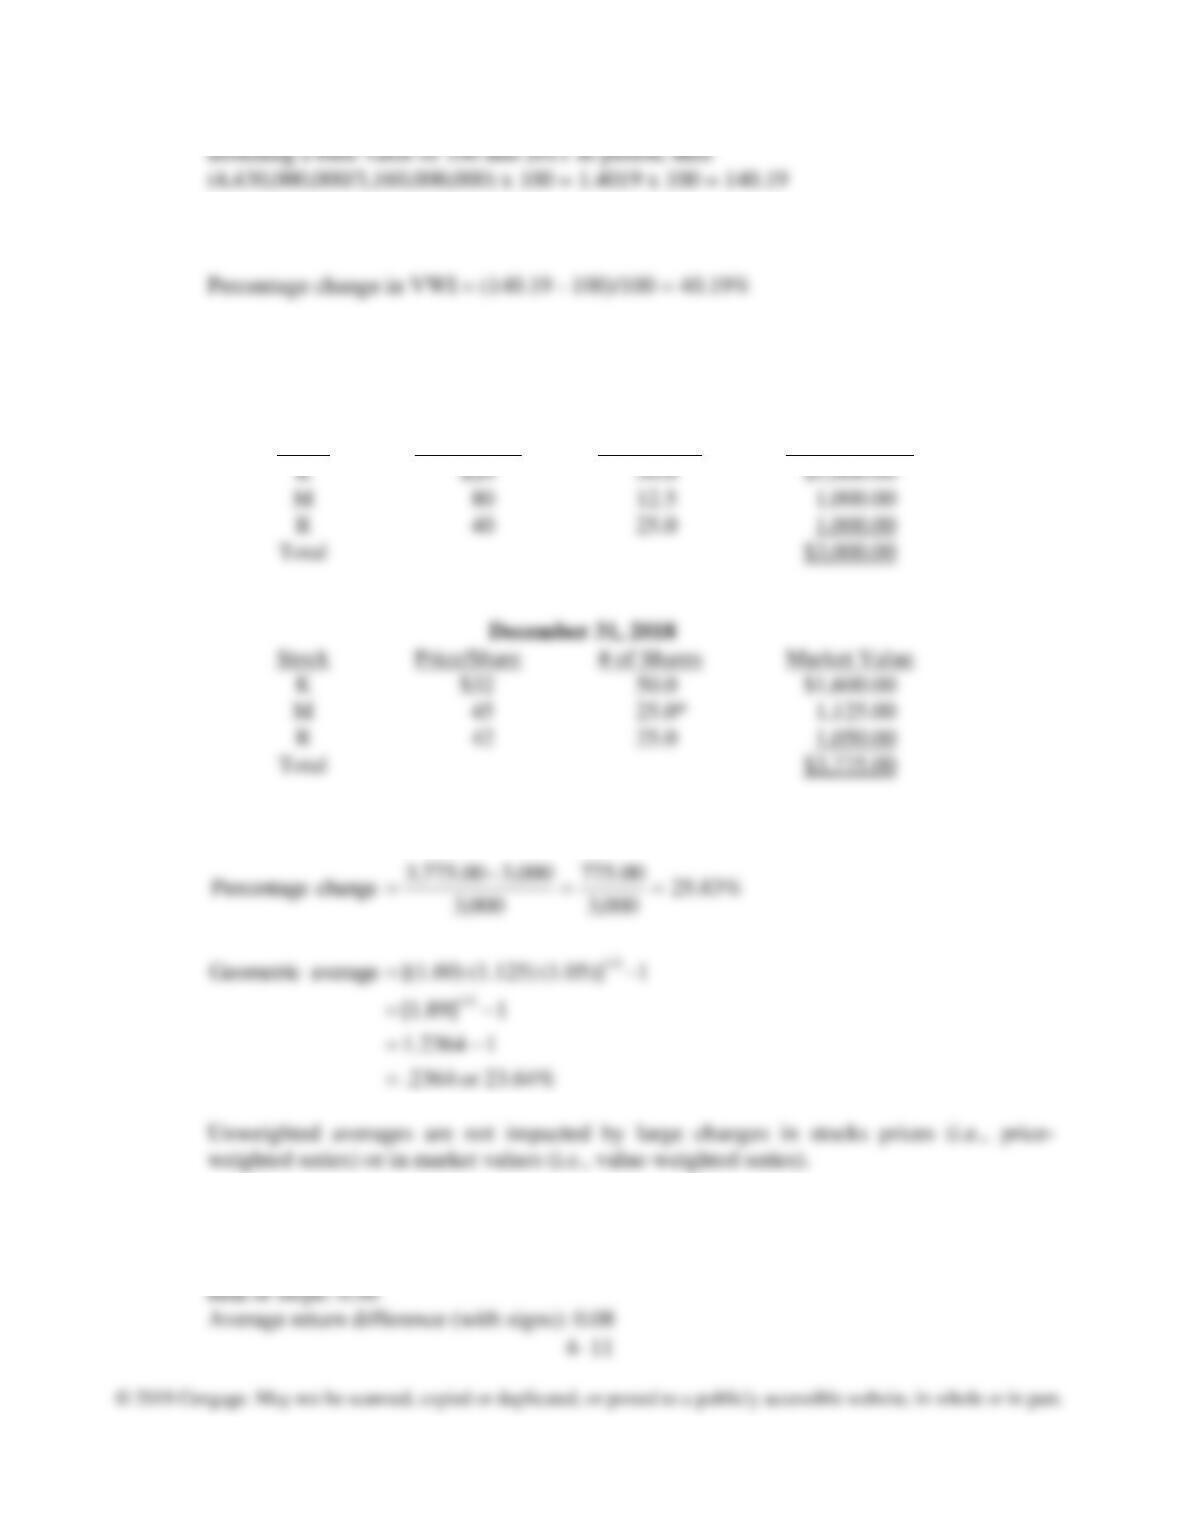
6(a). Percentage change in PWI = (55.53 – 46.67)/46.67 = 18.99%
6(b). The percentage change in VWI was much greater than the change in the PWI because the
stock with the largest market value (K) had the greater percentage gain in price (60 percent
increase).
6(c). December 31, 2017
Stock Price/Share # of Shares Market Value
(*Stock-split two-for-one during the year.)
7. Using a spreadsheet and its functions we obtain the following values:
R2 : 0.98
alpha or intercept term: 0.08
%83.25
000,3
00.775
000,3
3,000–3,775.00
change Percentage ===
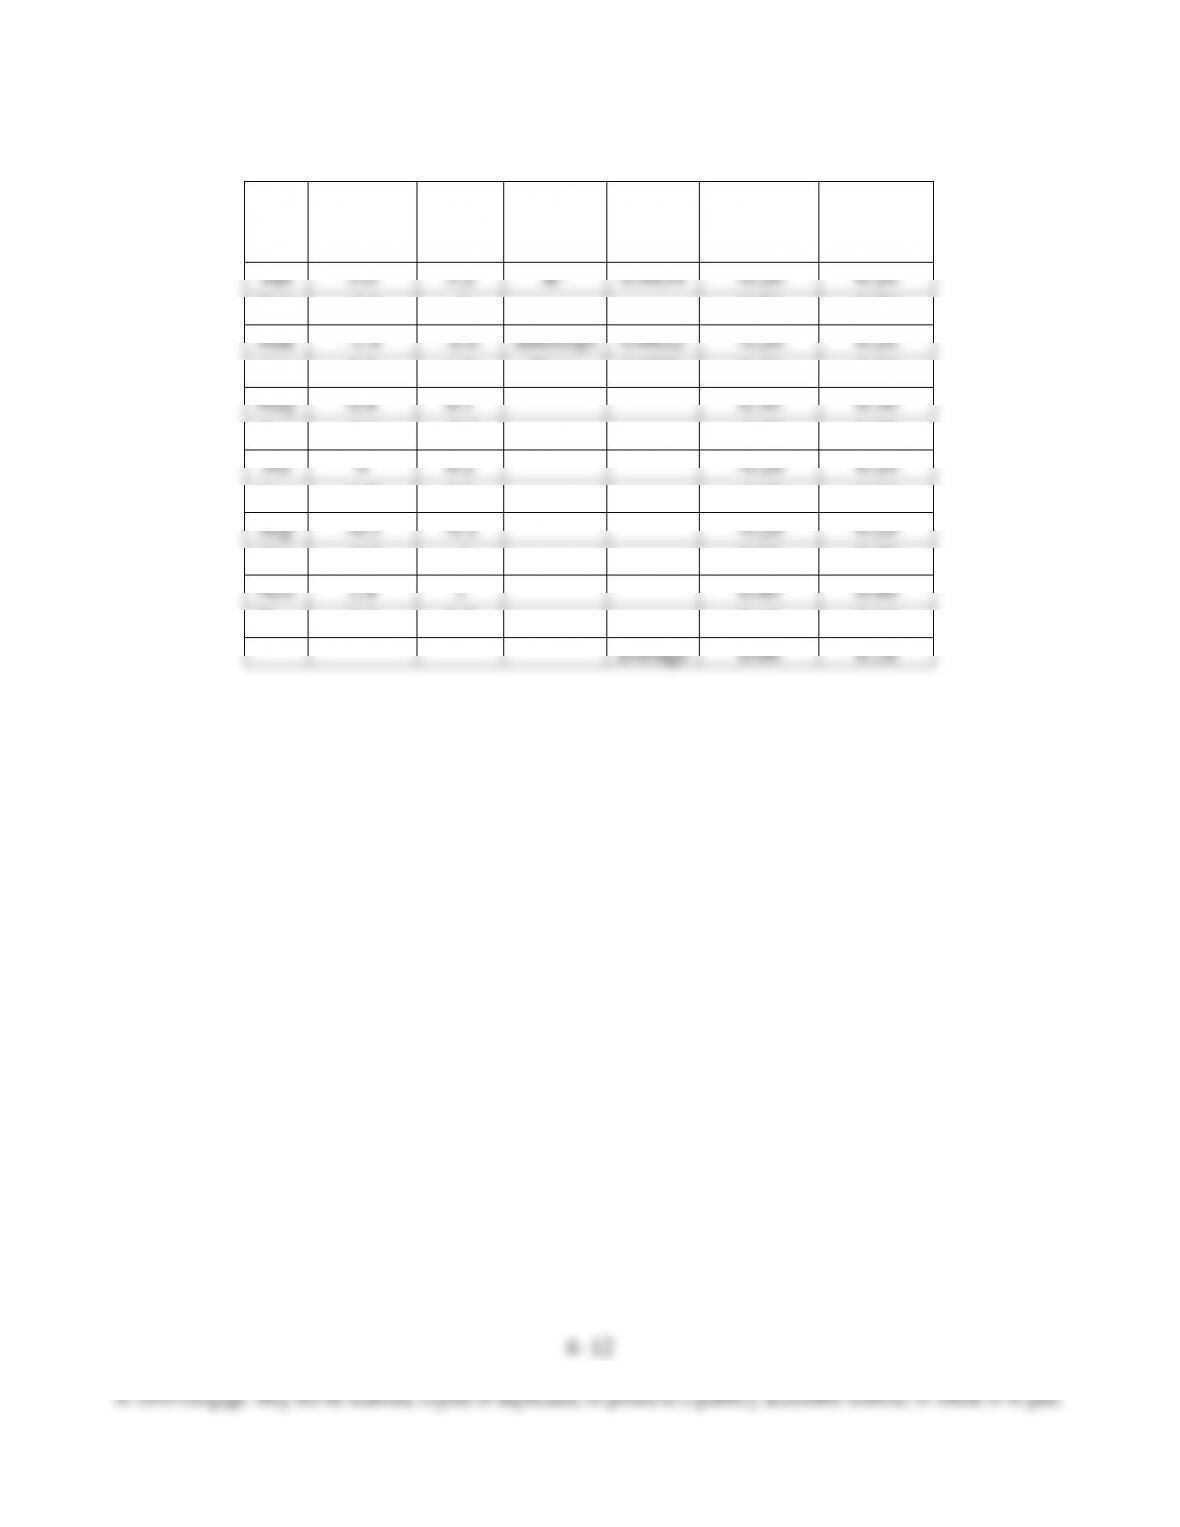
Average return difference (without signs) 0.28
Portfolio
Return
S&P
Return
Difference
in Returns
Absolute
difference
in returns
Jan
5.0
5.2
R2
0.9834
-0.20
0.20
Feb
-2.3
-3
0.70
0.70
Mar
-1.8
-1.6
Intercept
0.0822
-0.20
0.20
Apr
2.2
1.9
Slope
0.9571
0.30
0.30
May
0.4
0.1
0.30
0.30
Jun
-0.8
-0.5
-0.30
0.30
Jul
0
0.2
-0.20
0.20
Aug
1.5
1.6
-0.10
0.10
Sep
-0.3
-0.1
-0.20
0.20
Oct
-3.7
-4
0.30
0.30
Nov
2.4
2
0.40
0.40
Dec
0.3
0.2
0.10
0.10
average
0.08
0.28