Chapter 03 – Valuation
1
CHAPTER 3
Valuation
1. When computing free cash flow, EBITDA is a proxy for the sum of before tax earnings
and depreciation and amortization, which are the first components of cash flow from
operations before adjusting for operating working capital. Relative to a base forecast, if a
firm anticipates that its future cash payroll will increase, all else being the same, then it will
predict lower values for its future free cash flows. Suppose instead that the firm anticipates
grants. Alternatively, firms can avoid dilution by planning to repurchase shares on the
market, in order to deliver them to employees exercising options. This transaction will not
impact free cash flow, but will reduce the magnitude of future cash payouts, as reflected in
as the options are accounted for elsewhere in the valuation computation. The DCF valuation
in the 2003 Morgan Stanley report on eBay does not explicitly mention an adjustment for

3
©2018 McGraw-Hill Education. All rights reserved. Authorized only for instructor use in the classroom. No
reproduction or further distribution permitted without the prior written consent of McGraw-Hill Education.
5. A strong candidate is bias stemming from anchoring, in that predicting a 30 percent annual
6. If this analysis is fundamentally based, then it is wrong. The premium (P/E of eBay
relative to the P/E of the S&P 500) should be based on required return and growth
7. The Morgan Stanley team’s report features several inconsistencies. The P/E-based
computation assumes that EPS will grow at 36 percent. In contrast, the PEG-based
assumption assumes that EPS will grow at 32 percent. Moreover, the PEG-based calculation
uses an EPS value that relates to 2004E, whereas the P/E-based calculation uses an EPS

Chapter 03 – Valuation
4
©2018 McGraw-Hill Education. All rights reserved. Authorized only for instructor use in the classroom. No
reproduction or further distribution permitted without the prior written consent of McGraw-Hill Education.
growth rate (times 100), the two valuation heuristics should feature the same values of P/E
and E; and therefore they should produce the same price target. This means that the PEG-
based approach adds no additional insight.
Next consider the wide dispersion in price target valuations. The difference between the P/E-
based valuation and the PEG-based valuation stems completely from the use of inconsistent
assumptions, as discussed above. The difference between the P/E-based price target and the
increase to 70 (the value implied by a price target of $147 instead of $84). The Morgan
Stanley team’s equal weighting approach suggests that the analysts view either possibility as
equally likely.
8. Operationally, CAPM is model for short-term returns, usually monthly returns. Empirical
betas are typically derived based on 60 months of return data. In practice, annual discount
rates are obtained based on risk premiums that are annualized values for geometric monthly
5
9. The phrase “priced for perfection” suggests that Rashtchy’s forecasts were excessively
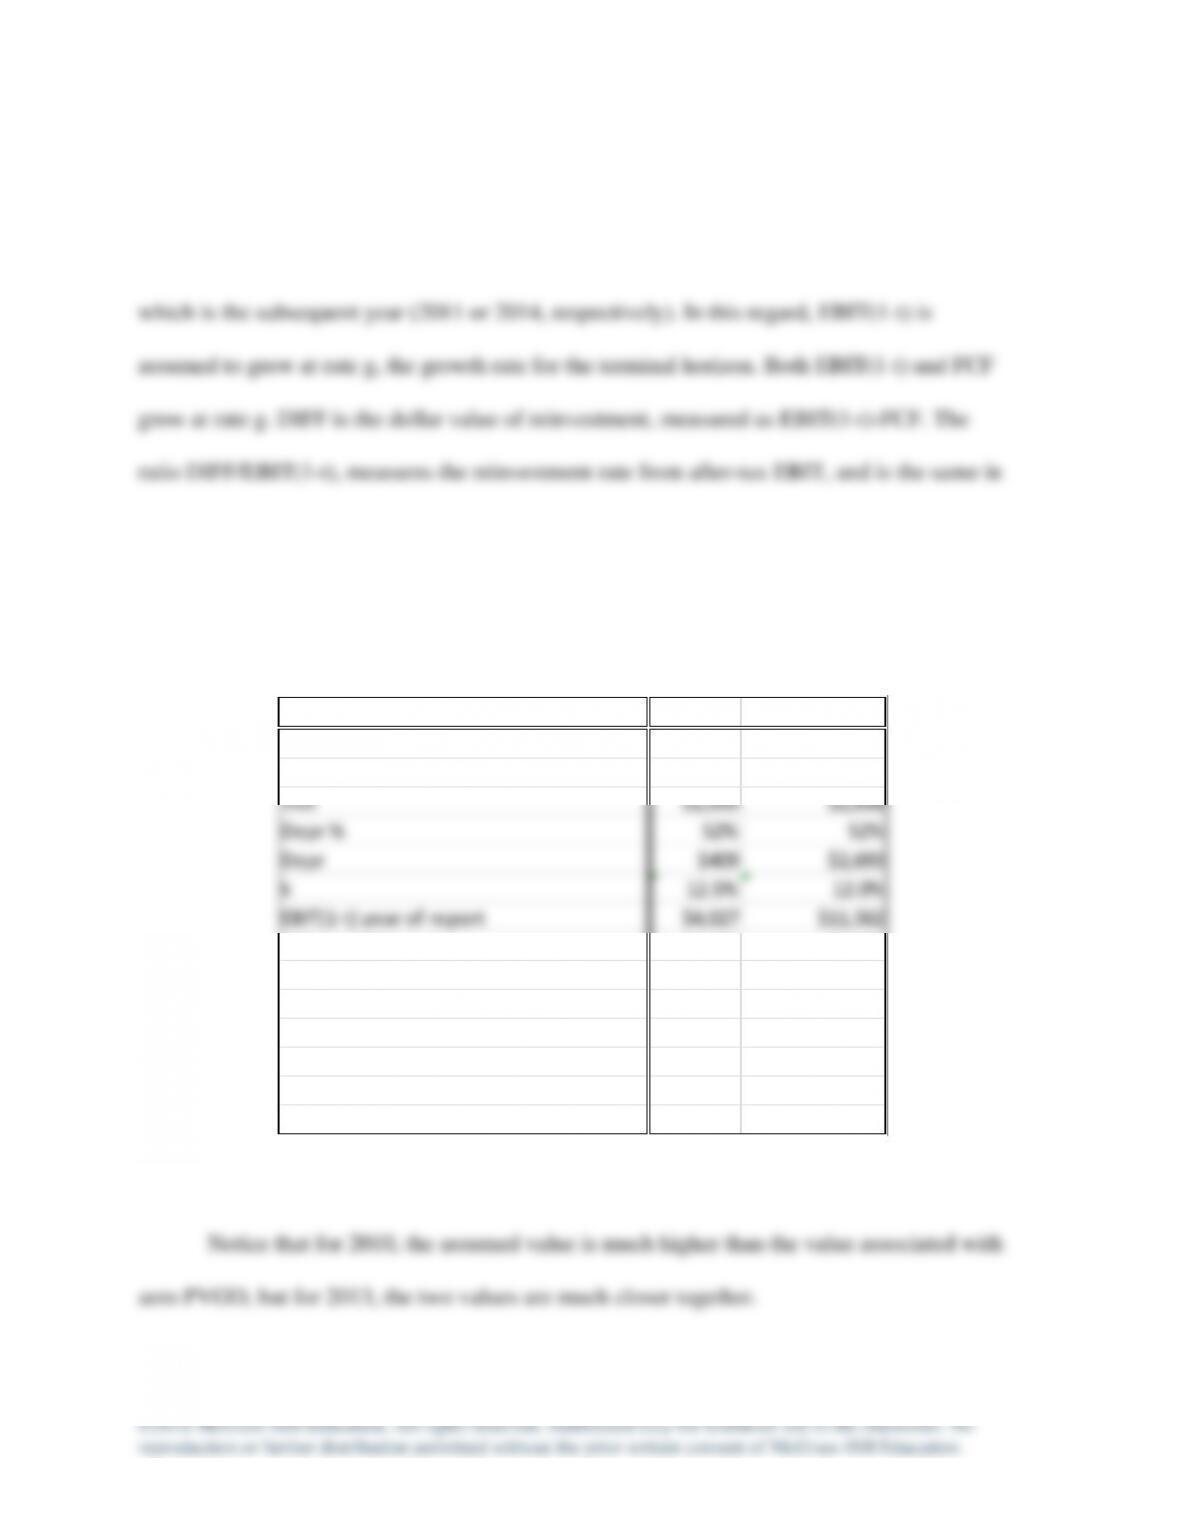
10. The table displayed below contains the computations for calculating the growth rates
associated with the zero-PVGO condition, and comparing them to the growth rate
assumptions in the reports.
The zero-PVGO condition focuses on reinvestment for growth, and begins with the
uses of cash flow associated with EBITDA. First comes DA, depreciation and amortization:
horizon be equal to the ratio g/k. In the table below, the bottom row specifies the forecasted
growth rate while the second to bottom row specifies the growth rate that would be consistent
with the reinvestment rate being equal to g/k.
Chapter 03 – Valuation
6
As you look down the items in the table, you will see two values for after-tax EBIT,
that is EBIT(1-t). The first entry is for the year of the report, meaning either 2010 or 2013,
while the second entry further down the table is for the first year of the terminal horizon,
the year of the report and the first year of the terminal horizon. The value of DIFF displayed
in the table is for the first year of the terminal horizon.
2010 2013
EBITDA $5,495 $17,093
CAPEX $786 $5,178
TAX $1,059 $2,838
Depr % 52% 52%
Depr $409 $2,693
k 12.5% 12.0%
EBIT(1–t) year of report $4,027 $11,562
FCF year of report $3,699 $7,820
DIFF year of report $328 $3,742
DIFF first year of terminal horizon $343 $3,892
k*DIFF first year of terminal horizon $43 $467
EBIT(1–t) first year of terminal horizon $4,209 $12,025
g = k*DIFF/EBIT(1-t) 1.0% 3.9%
g forecast for terminal horizon in report 4.5% 4.0%
Chapter 03 – Valuation
It is possible to probe further. On page 69 of the text there appears a discussion of
eBay’s zero PVGO growth rate for the period after 2010, based on the April 2003 report.
A comparison of the two zero PVGO TV-based valuations, viewed from 2010, of the
free cash flow stream for the period 2011 on, meaning the one from 2003 and the one from
eBay’s stock was $39,307, implying that the stock was undervalued by 13.8%. The
corresponding zero PVGO-based valuation was $33,885 million, implying an overvaluation
of 1.9%.
For their April 2003 report, had the Morgan Stanley team used a discount rate equal
to its estimate of the WACC, namely 9.5 percent, and assumed g to be its zero PVGO value,


Chapter 03 – Valuation
1. Why is the point forecast arrived at using a P/E-based approach, but the
interval forecast arrived at with a DCF-based free cash flow approach?
2. Why is the forecasted range, based on $29, positively skewed, as $29 lies
below the $31 midpoint of $24 and $38?
3. Why is the forecasted range, based on $34, negatively skewed?
4. Given the price of eBay’s shares at the date of the report, why is the point
forecast return, 3.2 percent, not only low but less than the WACC?
5. Notice that the expected return associated with the base case is over 18%. This
is very high for a WACC of 8 percent, given that for the base case, eBay’s
debt is approximately 16% of its total capitalization. (Debt is 7,600 and equity
Chapter 03 – Valuation
Minicase
Case Analysis Questions
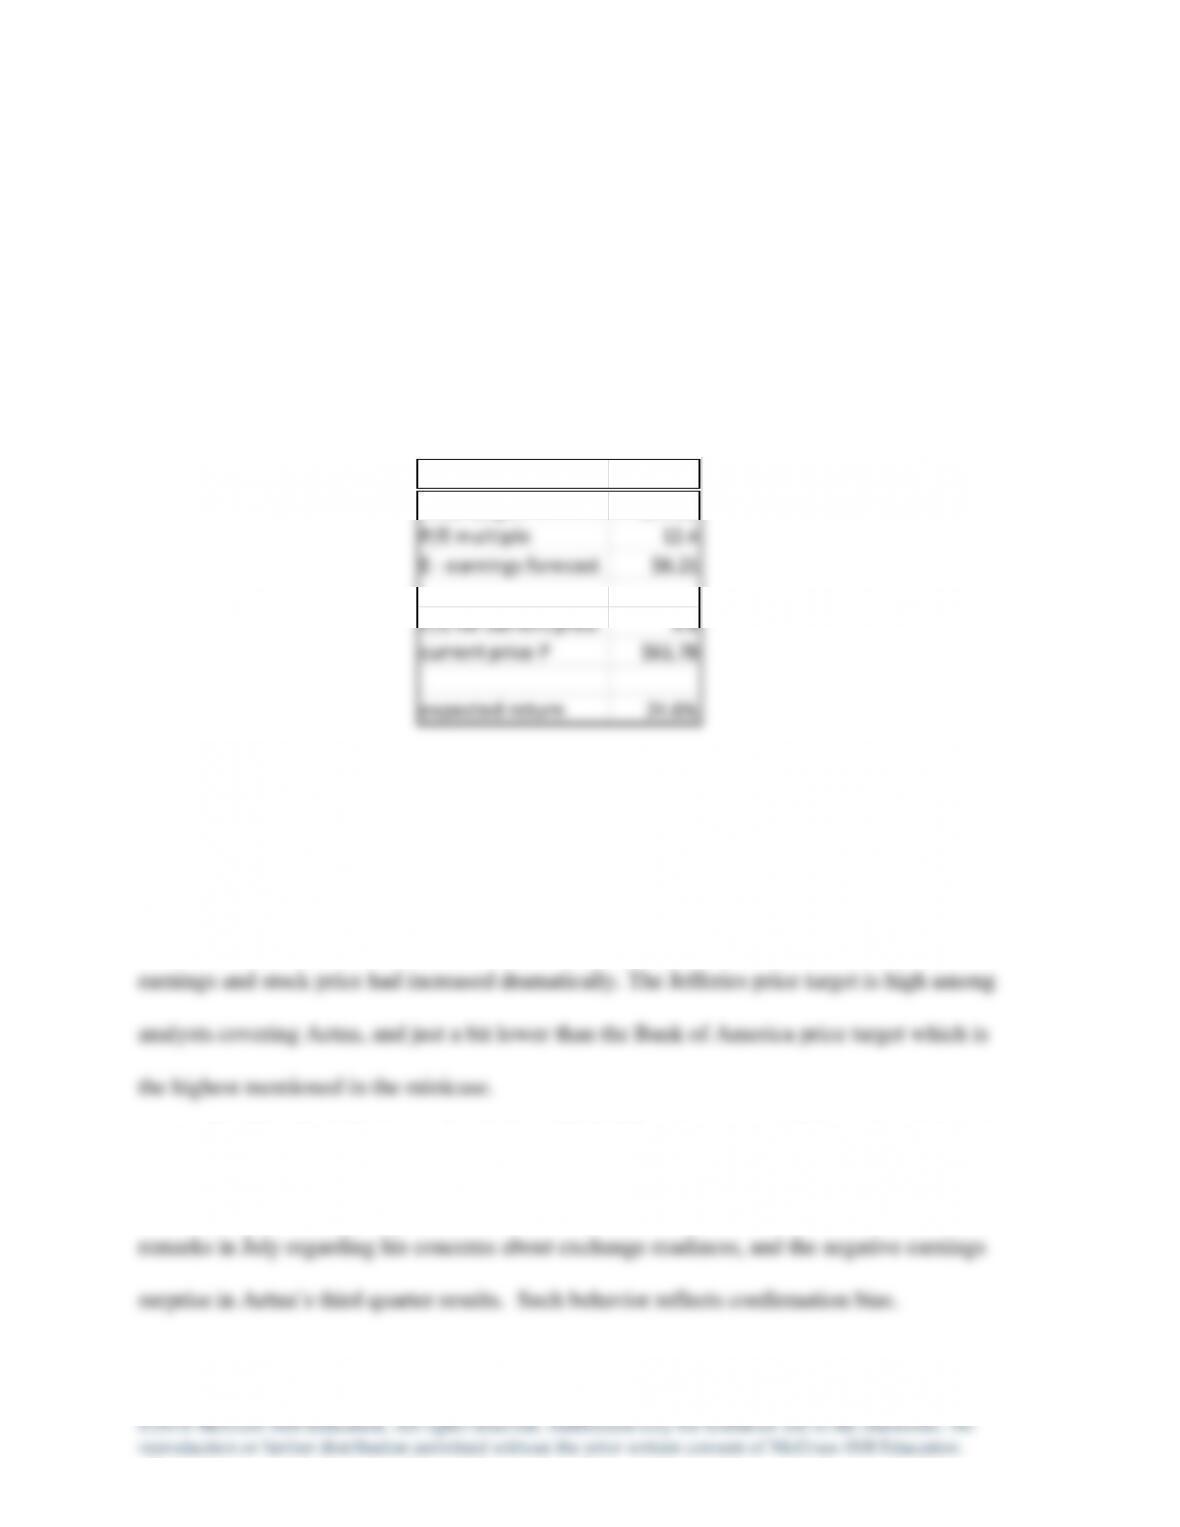
1. The Jefferies report relies on the P/E heuristic alone to arrive at a price target. The price
target of $77 represents an expected return of approximately 25 percent, as displayed in the
table below.
This return suggests excessive optimism on the part of the Jefferies analyst, based on
the recent increases in Aetna’s earnings and stock price. This is similar to the excessive
optimism displayed by in the Morgan Stanley team’s 2003 report on eBay, after eBay’s
Notably, the Jefferies analyst had established his price target in July, and maintained
it in October. In this regard, he appears to have ignored the caution in CEO Bertolini’s
Jefferies
Price target $77.00
P/E multiple 12.4
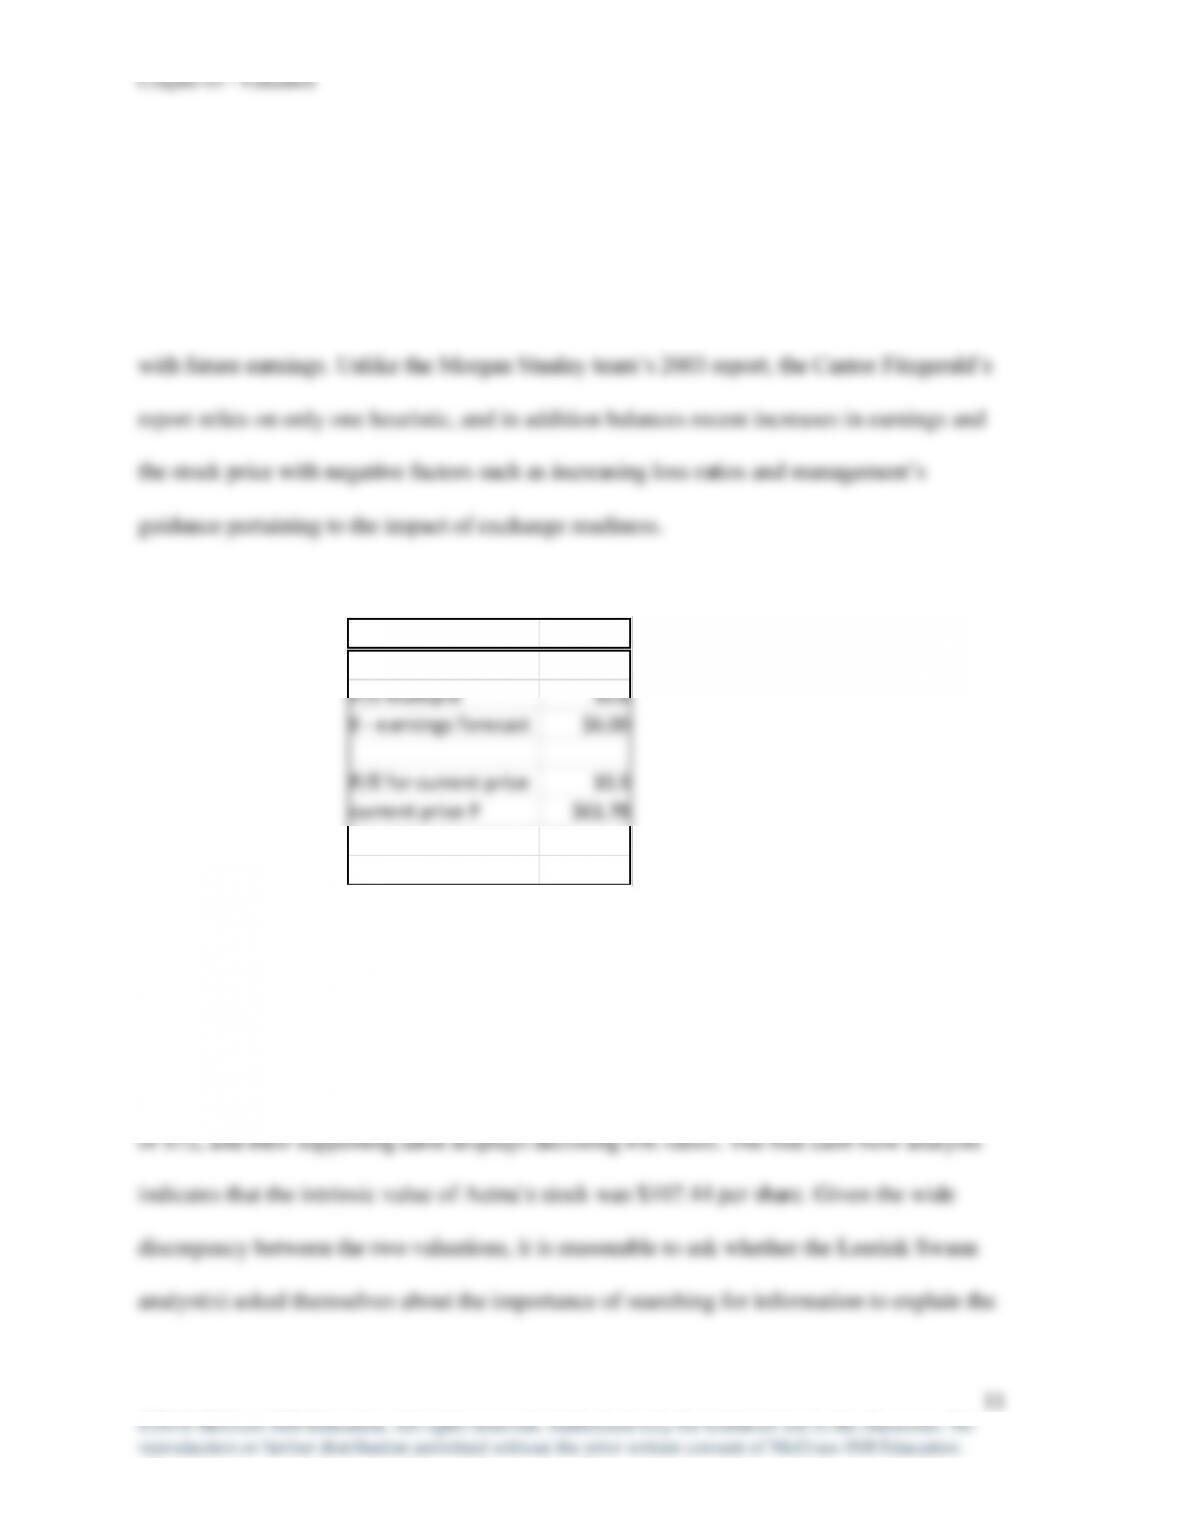
E – earnings forecast $6.21
P/E for current price 9.8
current price P $61.78
expected return 24.6%