Chapter 03 – Valuation
12
discrepancy. A lack of reflection on such an issue suggests the presence of confirmation bias,
in respect to the failure to seek disconfirming information in respect to the valuation analysis.
Leerink Swann uses both a P/E-based methodology and a DCF-based methodology,
as did the Morgan Stanley 2003 report on eBay, but unlike the latter did not use PEG or
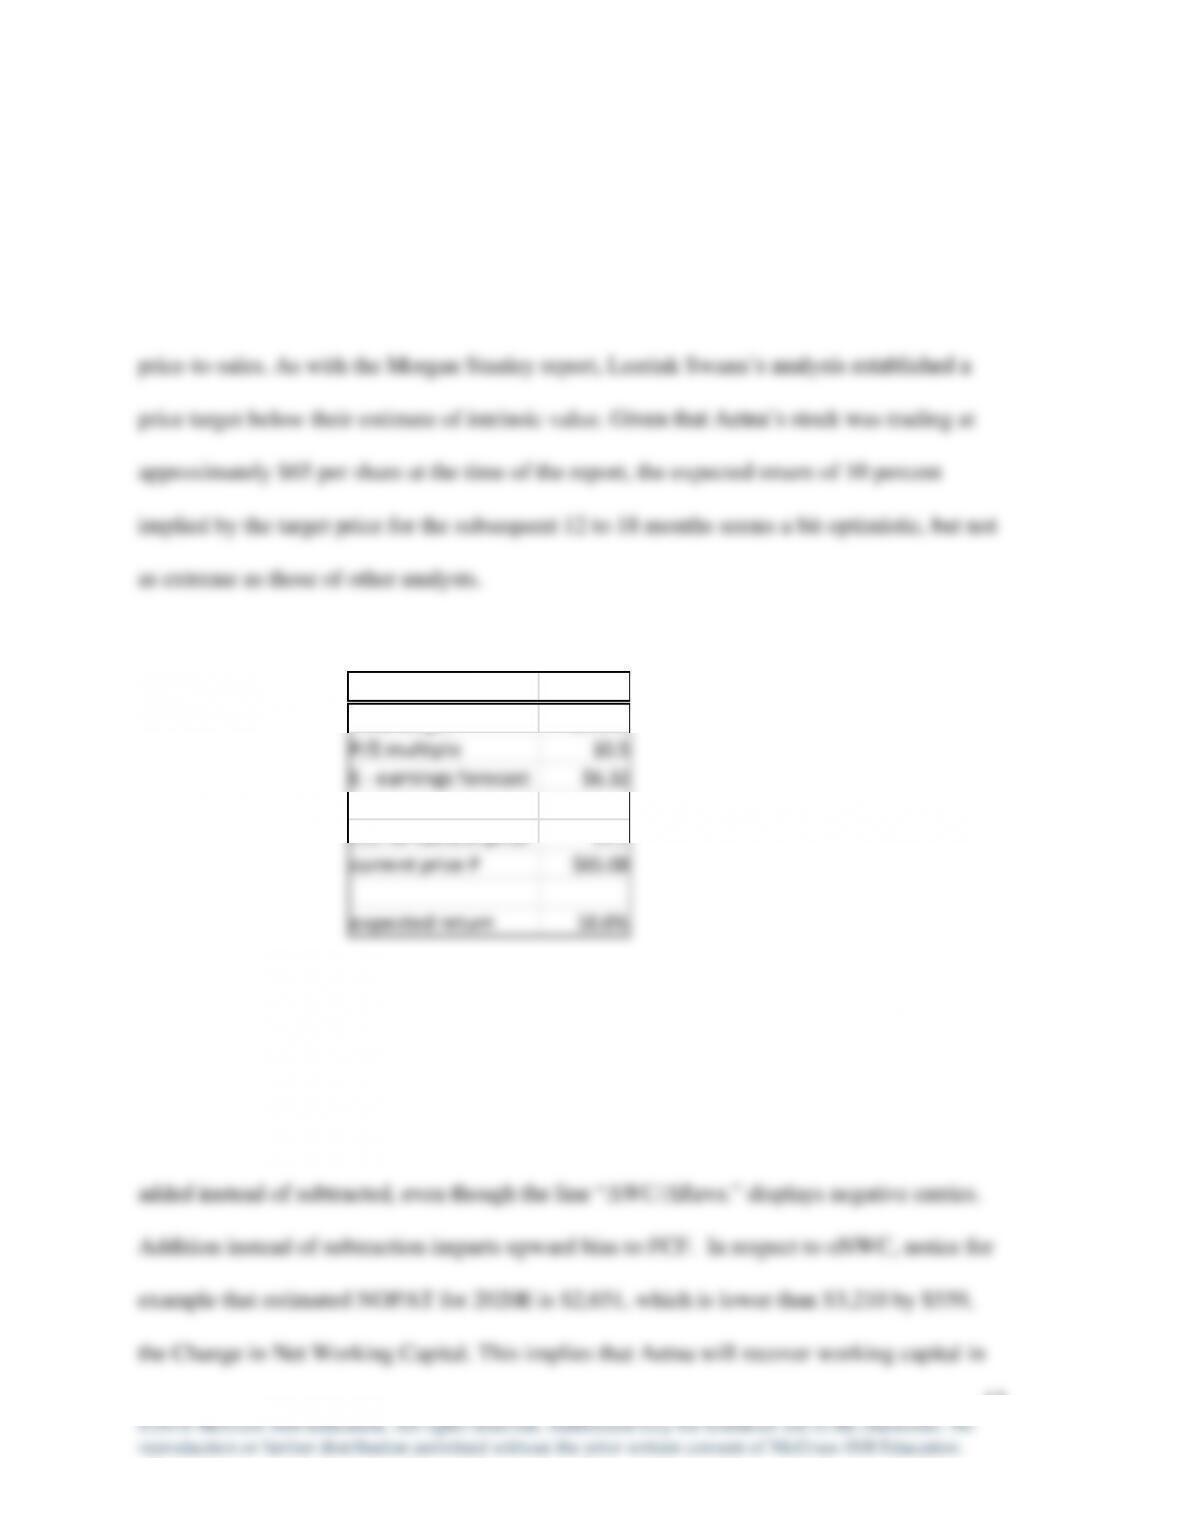
The following table summarizes Leerink Swann’s P/E based price target.
There are several major computational issues in Leerink Swan’s FCF analysis. In this
regard, Leerink Swann computes free cash flow as NOPAT + Depreciation & Amortization
(D&A) – CapEx – Change in (operating) Net Working Capital (oNWC). However, oNWC is
Leerink Swann
Price target $72.00
P/E multiple 10.5
E – earnings forecast $6.32
P/E for current price 11.1
current price P $65.08
expected return 10.6%
Chapter 03 – Valuation
13
2020E and every year thereafter, not increase its working capital as its revenues grow at the 5
percent rate assumed in the table. Given that the same feature holds for every year from 2012
on, a more likely explanation is that the Leerink Swan analysts omitted a minus sign in the
row “Chg.in Working Capital.”
The growth rate in Operating Revenues between 2019E and the Terminal Year is 5
percent. However, EBIT does not grow by 5 percent during this period, because the profit
margin (% Margin) is assumed to decline from 3.3% of Operating Revenues to 2.5%.
Therefore, EBIT declines by 21.4 percent. In this regard, the estimated annual growth rate for
Operating income minus taxes. Notably, the decline in forecasted EBIT dominates the
growth in Investment income so that in the terminal year, NOPAT declines by 9.3 percent,
and free cash flow FCF declines by 9.1 percent.
Exhibit 3-8 displays a present value for the terminal horizon equal to $42,804. This
Chapter 03 – Valuation
Terminal Horizon beginning after the Terminal Year. If so, then the FCF for the first year of
the Terminal Horizon will be
This implies that the growth rate assumed to apply after the Terminal Year is 1.4 percent.
This rate is consistent with the forecasted growth rate in the years before the Terminal year,
which decline to the region of 1 percent in 2018E. The forecasted FCF-growth rate for the
Terminal Year is actually negative (at approximately -9 percent).
power Years Out. Therefore, the present value of the Free Cash Flow stream is a sum of
products of the discount factors and the associated free cash flows. The products of free cash
flows and associated discount factors are displayed in the row labeled “PV of Cash Flows.”
For example, $22,916 is the product of $42,804, which is the present value of the constant
15
©2018 McGraw-Hill Education. All rights reserved. Authorized only for instructor use in the classroom. No
reproduction or further distribution permitted without the prior written consent of McGraw-Hill Education.
2013. The values in the Years Out column somehow seem inconsistent with this date. For
instance, why is Years Out for 2012 equal to 0, and Years Out for 2012 equal to 0.3, when
Aetna’s fiscal year ends December 31? Given that the report date is mid-November, with 1.5
actual year, and 2013 is 11/12 complete? Moreover, if the $107 is a price target, then why is
the free cash flow stream that is being valued not starting in 2014E (or November 2014E),
with Years Out being zero at the date associated with the price target, and 2015E effectively
being the first year out?
Consider next whether a terminal growth rate of 1.4 percent consistent with zero
PVGO? At issue is whether reinvestment in fixed assets and working capital is sufficient to
negative. In this regard, it appears that the reason for negative growth is the absence of a
minus sign in connection with the change in net working capital. Therefore, consider next
what happens when a negative sign is used for oNWC in the FCF computation.
Chapter 03 – Valuation
16
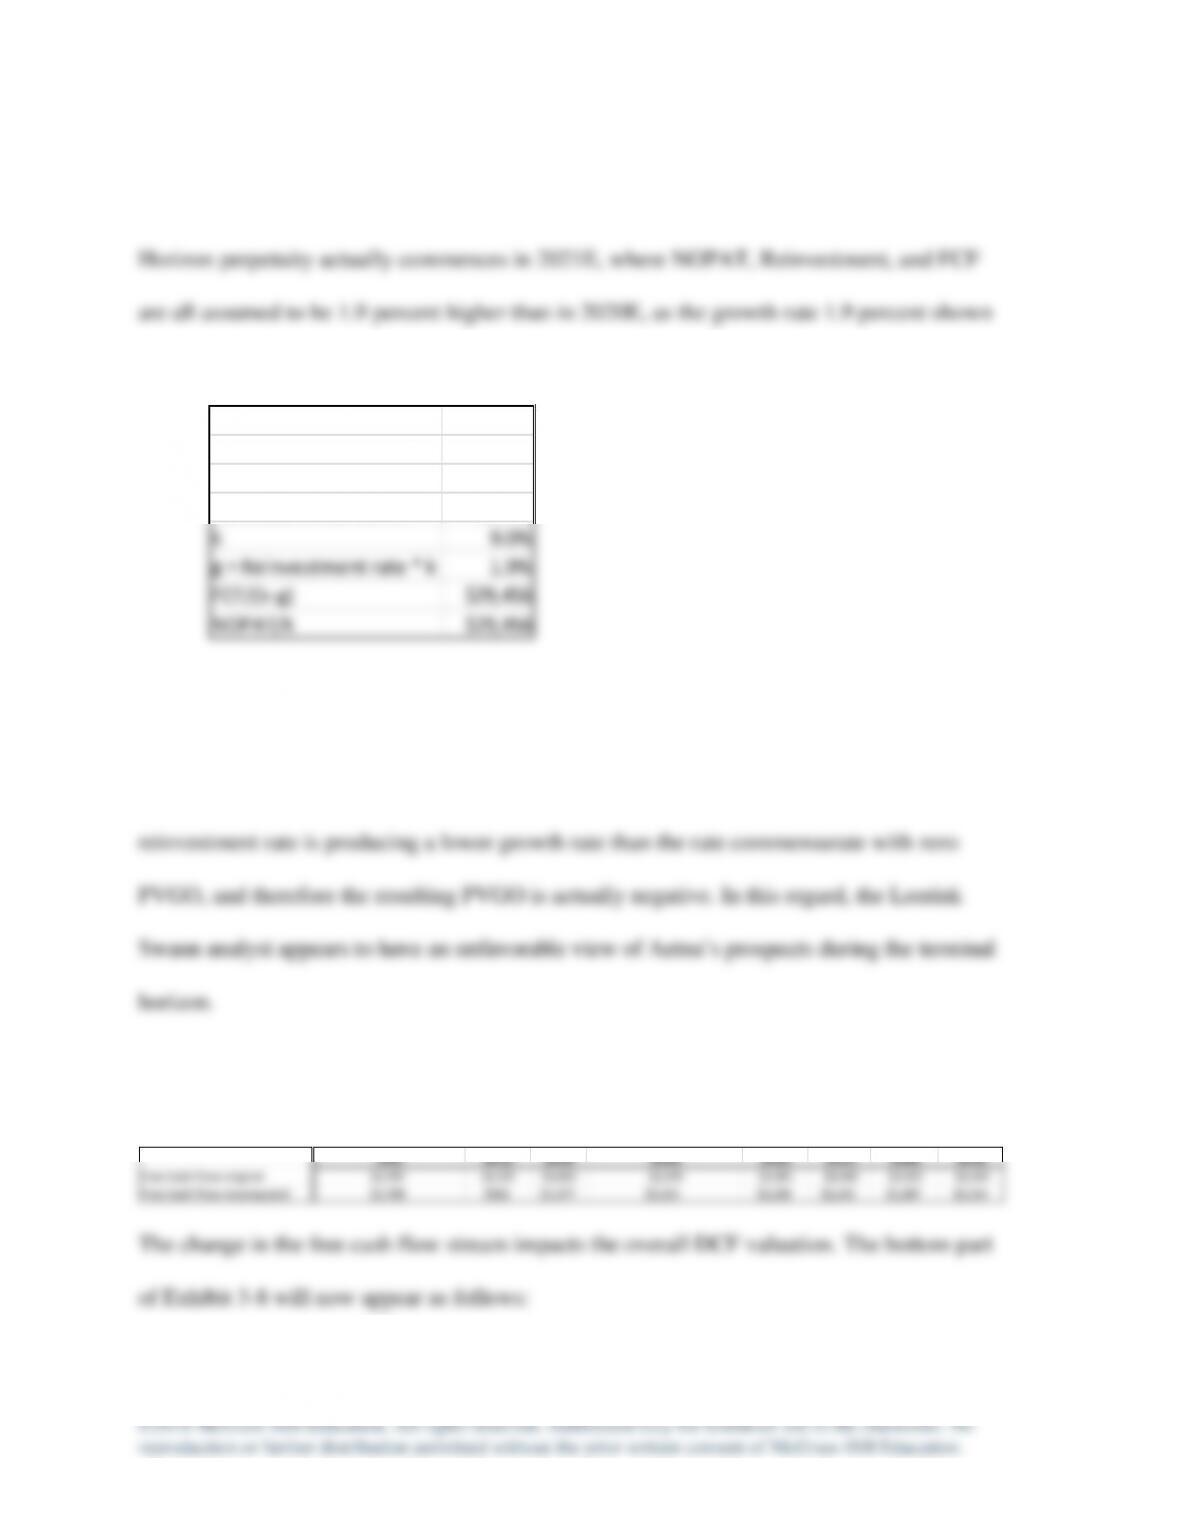
The following table displays the relevant computations for the terminal year 2020E,
with the present values of the FCF-perpetuity stream apply to 2019E. Notably, the Terminal
in the table below corresponds to zero PVGO.
As was mentioned above, the growth rate implicit in Leerink Swann’s Terminal
Horizon FCF-computation is actually 1.4 percent, less than the 1.9 percent associated with
zero PVGO. The implication of the direction of the inequality implies that Aetna’s
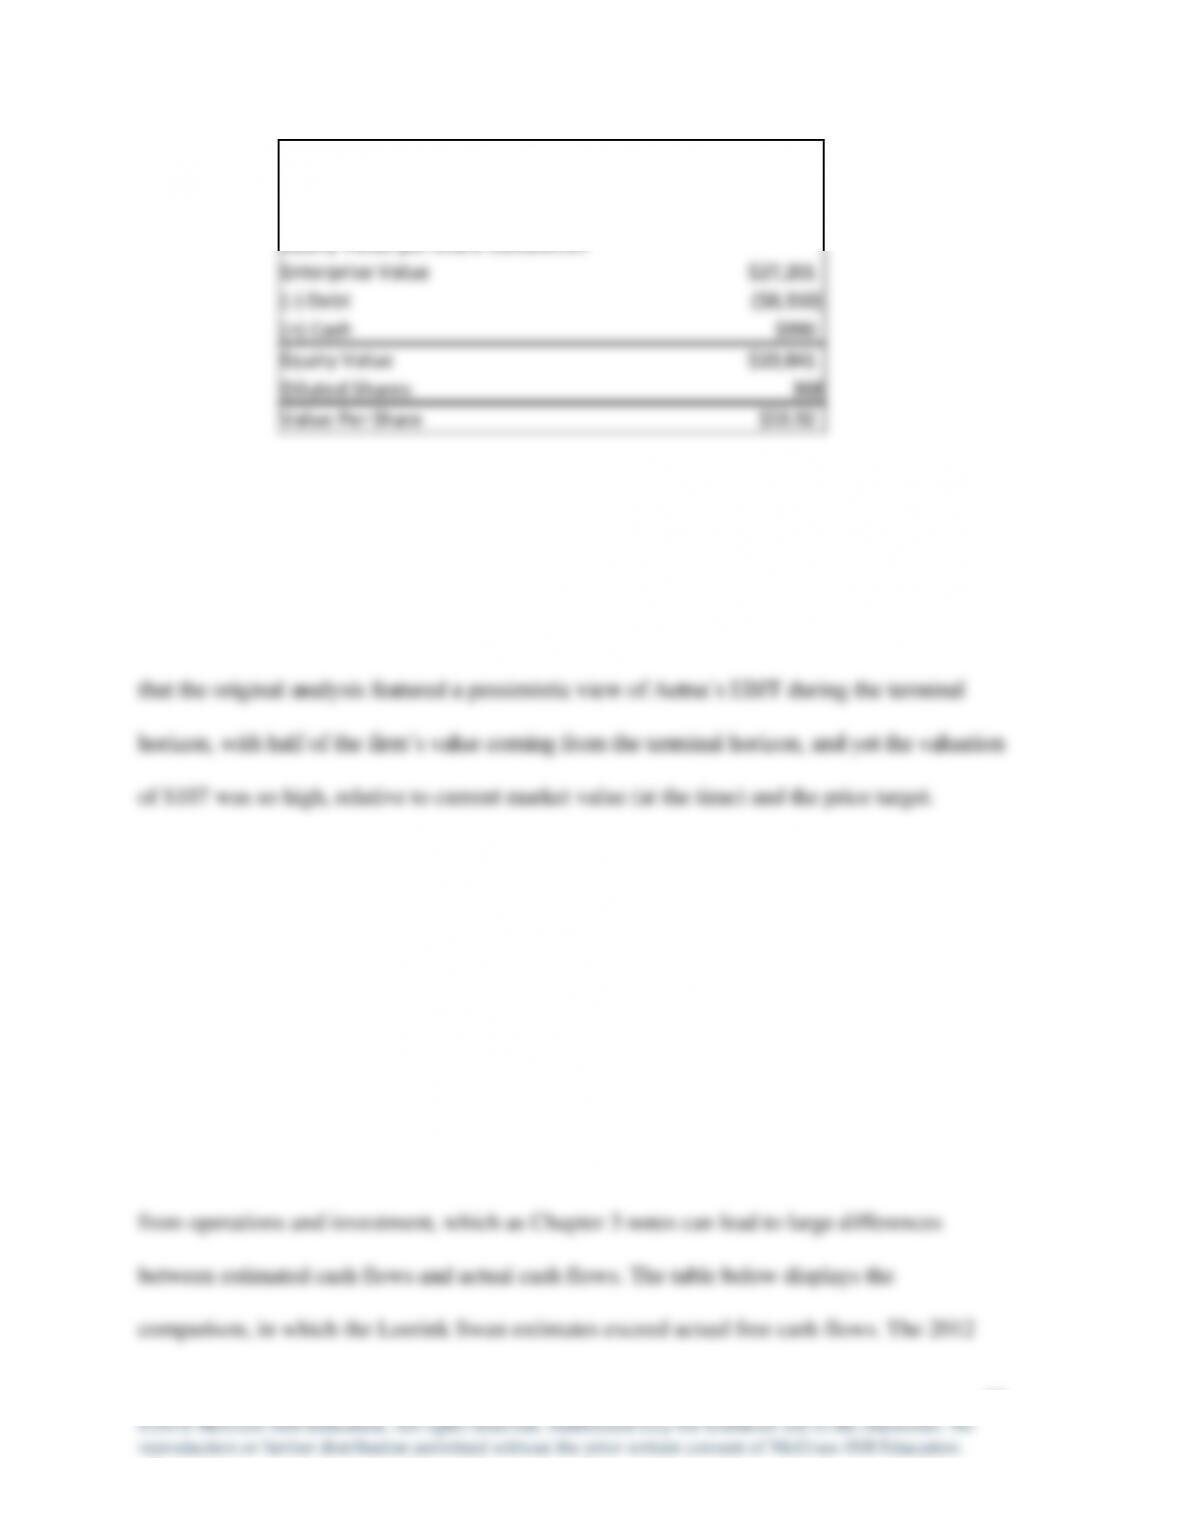
The sign correction for oNWC changes the numerical values in Exhibit 3-8. The
entire row “Free Cash Flow” how has lower entries. See below.
NOPAT $2,651
Reinvestment $559
FCF $2,092
Reinvestment/NOPAT 21.1%
k 9.0%
g = Reinvestment rate * k 1.9%
FCF/(k-g) $29,456
NOPAT/k $29,456
2012 2013E 2014E 2015E 2016E 2017E 2018E 2019E
Free Cash Flow original $2,292 $4,231 $3,852 $3,249 $3,381 $3,460 $3,502 $3,534
Free Cash Flow recomputed $1,708 $563 $1,377 $2,231 $2,208 $2,242 $2,287 $2,314
Chapter 03 – Valuation
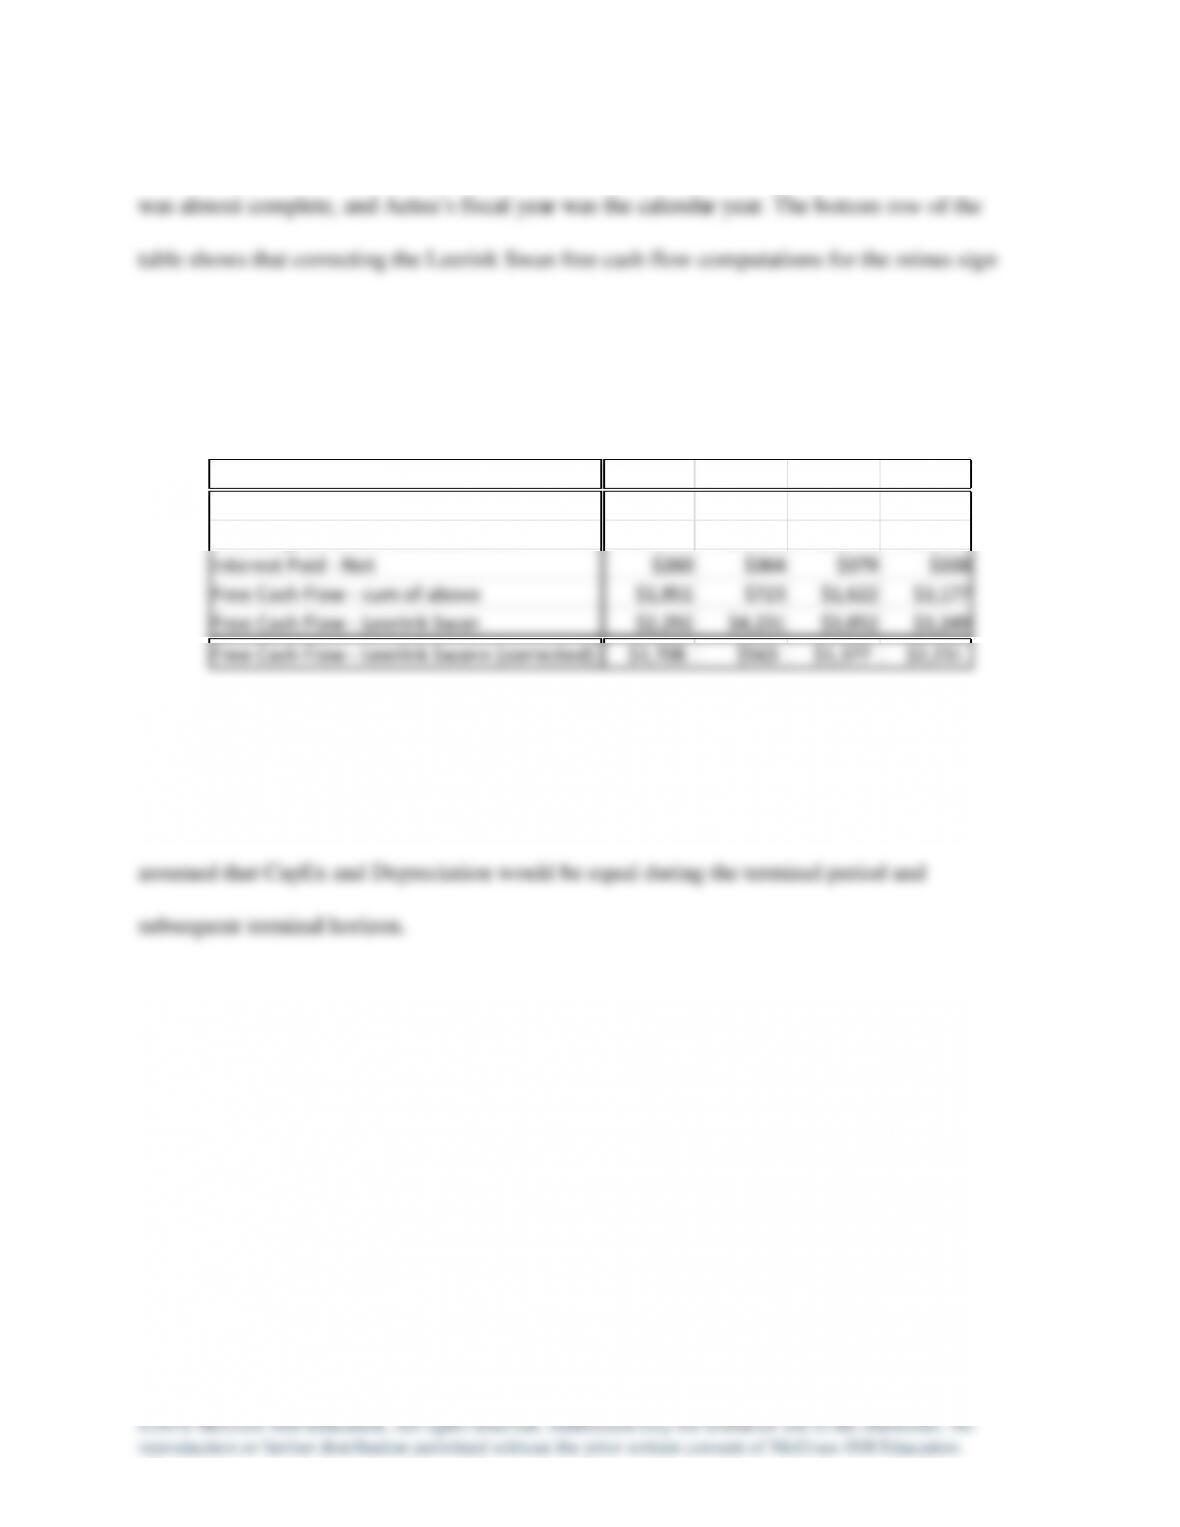
Notably, with the sign correction to oNWC, Aetna’s intrinsic valuation falls to $54
from $107. Therefore, Leerink Swann, had they correctly calculated free cash flow, would
likely have concluded that Aetna’s stock is overvalued on an intrinsic basis. It is interesting
The report features a price target of $72, based on P/E ratios, and the free cash flow
analysis indicates that the intrinsic value of Aetna’s stock was $107.44 per share. This
difference is large. Does the absence of a discussion about what might account for such a
difference suggest confirmation bias?
Relative to the Morgan Stanley team’s 2003 DCF analysis of eBay, the Leerink Swan
team also used the textbook definition of free cash flow. That is, both analyst teams use the
textbook definition of free cash flow based on EBITDA and CapEx rather than cash flows
PV of Forecast Period FCFs $12,482
PV of Terminal Value $14,719
Enterprise Value $27,201
Equity Value per Share Calculation
Enterprise Value $27,201
(–) Debt ($8,350)
(+) Cash $990
Equity Value $19,841
Diluted Shares 368
Value Per Share $53.92
Chapter 03 – Valuation
18
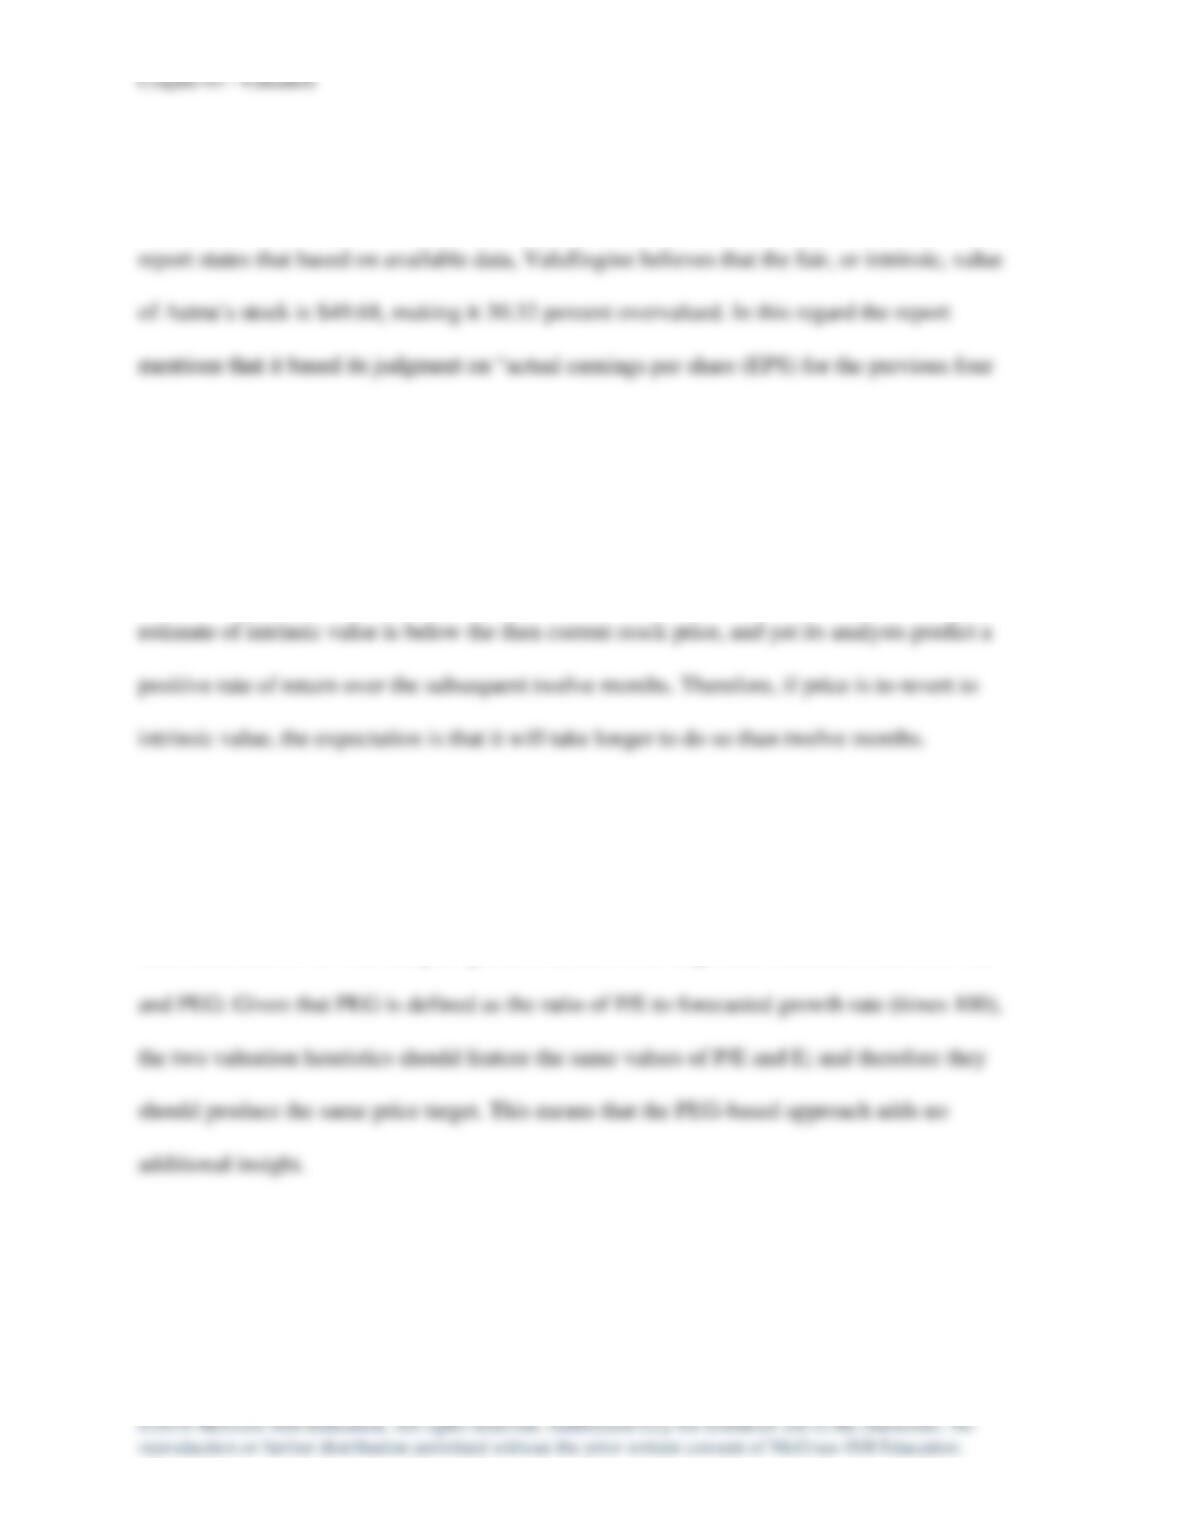
amounts are for actuals, and the other years compare estimates to actuals. In this regard, 2013
in respect to change in net working capital brings the forecasts and actual values closer
together until 2015.
A final point of comparison is that the Morgan Stanley team assumed that CapEx
would level out, even though revenues would grow rapidly, whereas the Leerink Swan team
2012 2013 2014 2015
Operating Activities – Net Cash Flow $1,822 $2,279 $3,373 $3,866
Investing Activites – Net Cash Flow –$231 –$1,920 –$2,130 –$1,028
Interest Paid – Net $260 $364 $379 $338
Free Cash Flow – sum of above $1,851 $723 $1,622 $3,177
Free Cash Flow – Leerink Swan $2,292 $4,231 $3,852 $3,249
Free Cash Flow – Leerink Swann (corrected) $1,708 $563 $1,377 $2,231
19
4. ValuEngine established a one-year price target of $67.28 for Aetna, when Aetna’s stock
was trading at $64.75, implying an expected return of 3.9 percent. At the same time, the
quarters of $5.60, forecasted EPS for the next four quarters of $6.16, and correlations to the
30- year Treasury bond yield of 3.50%.”
As in the Morgan Stanley 2003 report on eBay, ValuEngine arrives at a different
price target for Aetna’s stock than its estimate of intrinsic value. However, ValuEngine’s
The report states that its models feature “the most advanced statistical/econometric
techniques.” That said, the report goes on to indicate that it relies on three ratio techniques:
PEG, P/E, and price-to-sales P/S, where PEG is regarded as the most informative and P/S the
least informative. As with Chapter question 7, there is an important connection between P/E
There are additional issues related to the PEG analysis. The report notes that the point
of the PEG analysis is to provide a valuation standard, intended to indicate where a stock’s
valuation stands at the time of the report. The ValuEngine report provides two PEG
Chapter 03 – Valuation
20
valuations, based on different values for PEG. The first of these features the average
Notice that although five stocks are listed in the associated valuation table, only two
have values, and therefore the comparables group features just two stocks, not five stocks.
The report does not indicate how to reconcile the very high PEG valuations with
ValuEngine’s price target and fair value which are much lower. Presumably, the report is
suggesting that neither PEG value is appropriate, that Aetna merits a much lower PEG than
5. Every report in the minicase mentions the P/E heuristic, and therefore the differences in
price targets are not entirely due to different heuristics being employed by different analysts.
Part of the issue is that valuation is complex, and people’s attention is drawn to different

Chapter 03 – Valuation
21
that when the environment changes, some members of a species might have a sustainable
strategy that enables the species to adapt. Microorganisms employ this model, which is why
For 2014, Aetna’s EPS was $5.74. The stock closed at $83.81 on November 14, 2014
and $89.84 on December 26, 2014, a gain of roughly 41 percent from a year earlier. In
contrast, the S&P increased from 1798 to 2088 over the same period, a gain of roughly 16