1
2
3
4
5
6
7
13
14
15
16
17
18
19
20
21
22
23
24
25
26
27
28
29
30
31
32
33
34
35
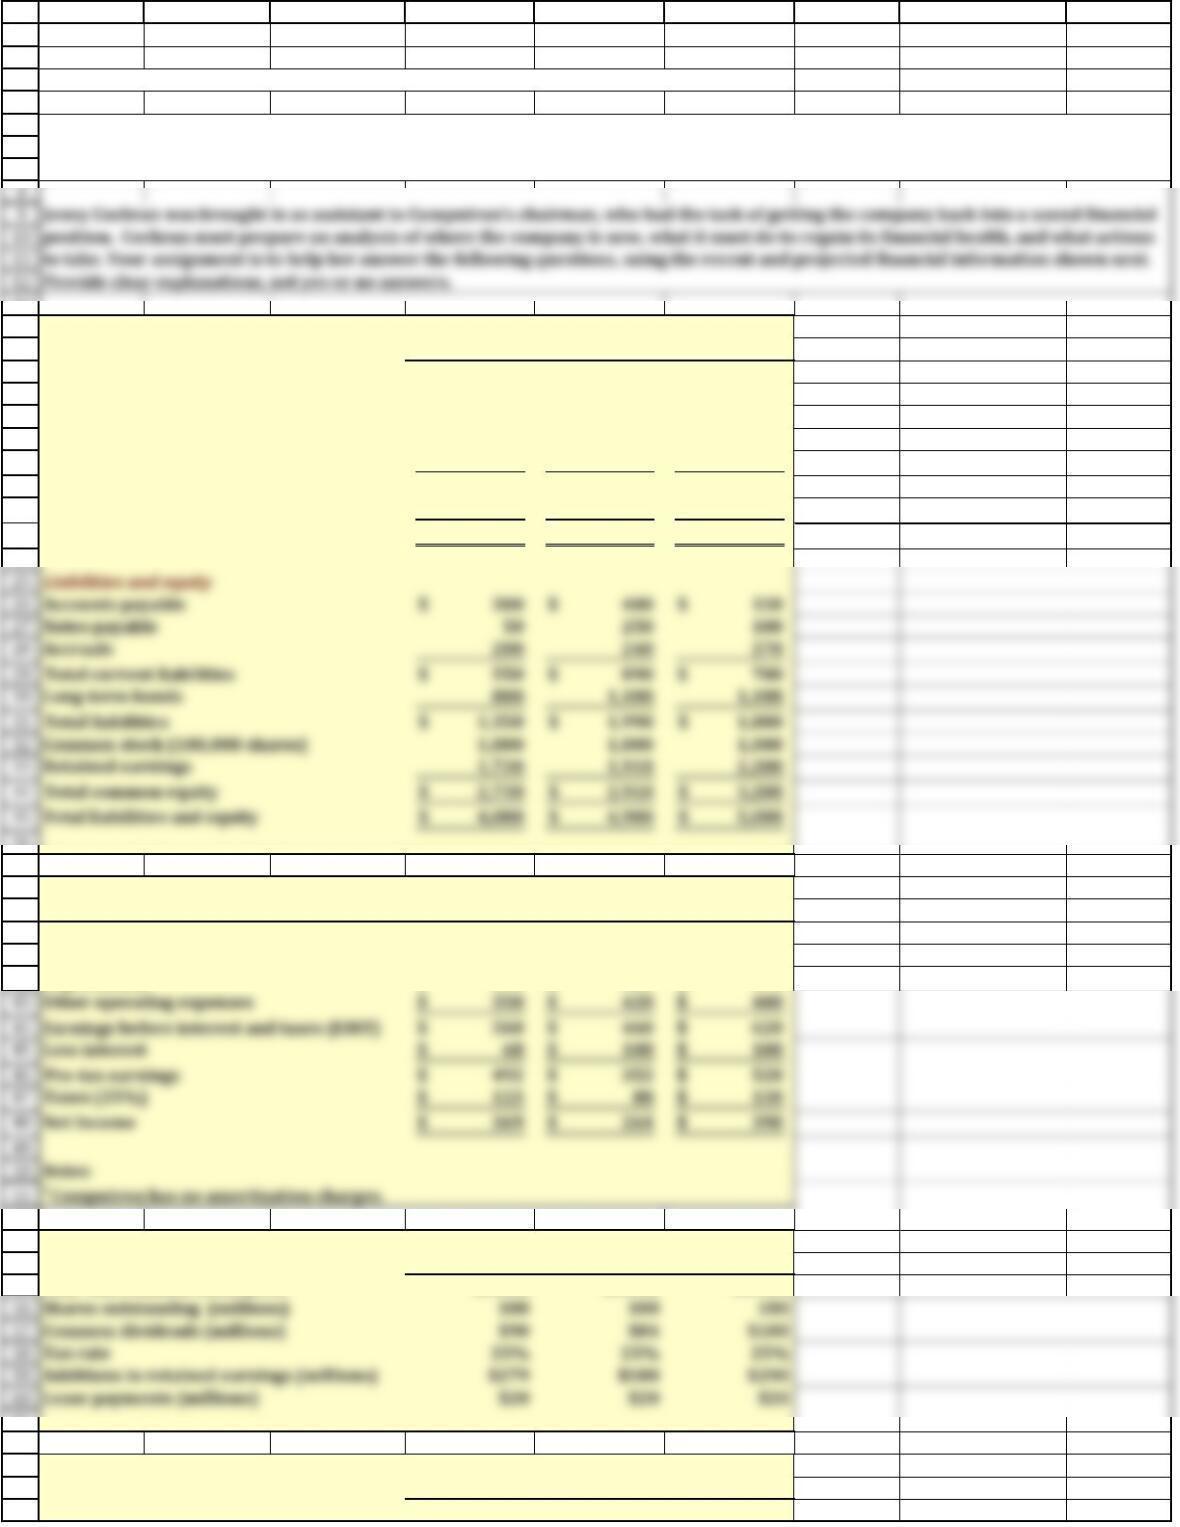
Accounts payable 300$ 400$ 330$
Notes payable 50 250 100
Total current liabilities 550$ 890$ 700$
Long-term bonds 800 1,100 1,100
Total liabilities 1,350$ 1,990$ 1,800$
Common stock (100,000 shares) 1,000 1,000 1,000
Retained earnings 1,730 1,910 2,200
Total liabilities and equity 4,080$ 4,900$ 5,000$
36
37
38
39
40
41
42
43
44
45
46
47
49
50
Other operating expenses 350$ 420$ 400$
Earnings before interest and taxes (EBIT) 560$ 460$ 620$
Less interest 68$ 108$ 100$
Pre-tax earnings 492$ 352$ 520$
Taxes (25%) 123$ 88$ 130$
52
53
54
55
56
57
58
59
60
Shares outstanding (millions) 100 100 100
Common dividends (millions) $90 $84 $100
Tax rate 25% 25% 25%
Additions to retained earnings (millions) $279 $180 $290
Lease payments (millions) $20 $20 $20
61
62
63
64
65
A B C D E F G H I
5/25/2019
Computron’s Balance Sheets (Millions of Dollars) Projection
2018 2019 2020E
Assets
Cash and equivalents 60$ 50$ 60$
Short-term investments 100 10 50
Accounts receivable 400 520 530
Inventories 620 820 660
Total current assets 1,180$ 1,400$ 1,300$
Net Fixed Assets 2,900 3,500 3,700
Total Assets 4,080$ 4,900$ 5,000$
Income Statements (Millions of Dollars) Projection
2018 2019 2020E
Net sales 5,500$ 6,000$ 6,600$
Cost of goods sold (Excluding depr.) 4,300$ 4,800$ 5,210$
Depreciationa290$ 320$ 370$
Additional Information Projection
2018 2019 2020E
Year-end common stock price $50.00 $30.00 $49.00
Per Share Information Projection
2018 2019 2020E
EPS $3.69 $2.64 $3.90
Chapter 3 Mini Case
The first part of the case, presented in the previous chapter, discussed the situation of Computron Industries after an expansion program.
A large loss occurred rather than the expected profit. As a result, its managers, directors, and investors are concerned about the firm’s
survival.
8
9
10
11
12
66
67
68
69
70
71
72
73
74
75
76
77
78
94
95
96
97
98
99
100
101
102
103
104
105
106
107
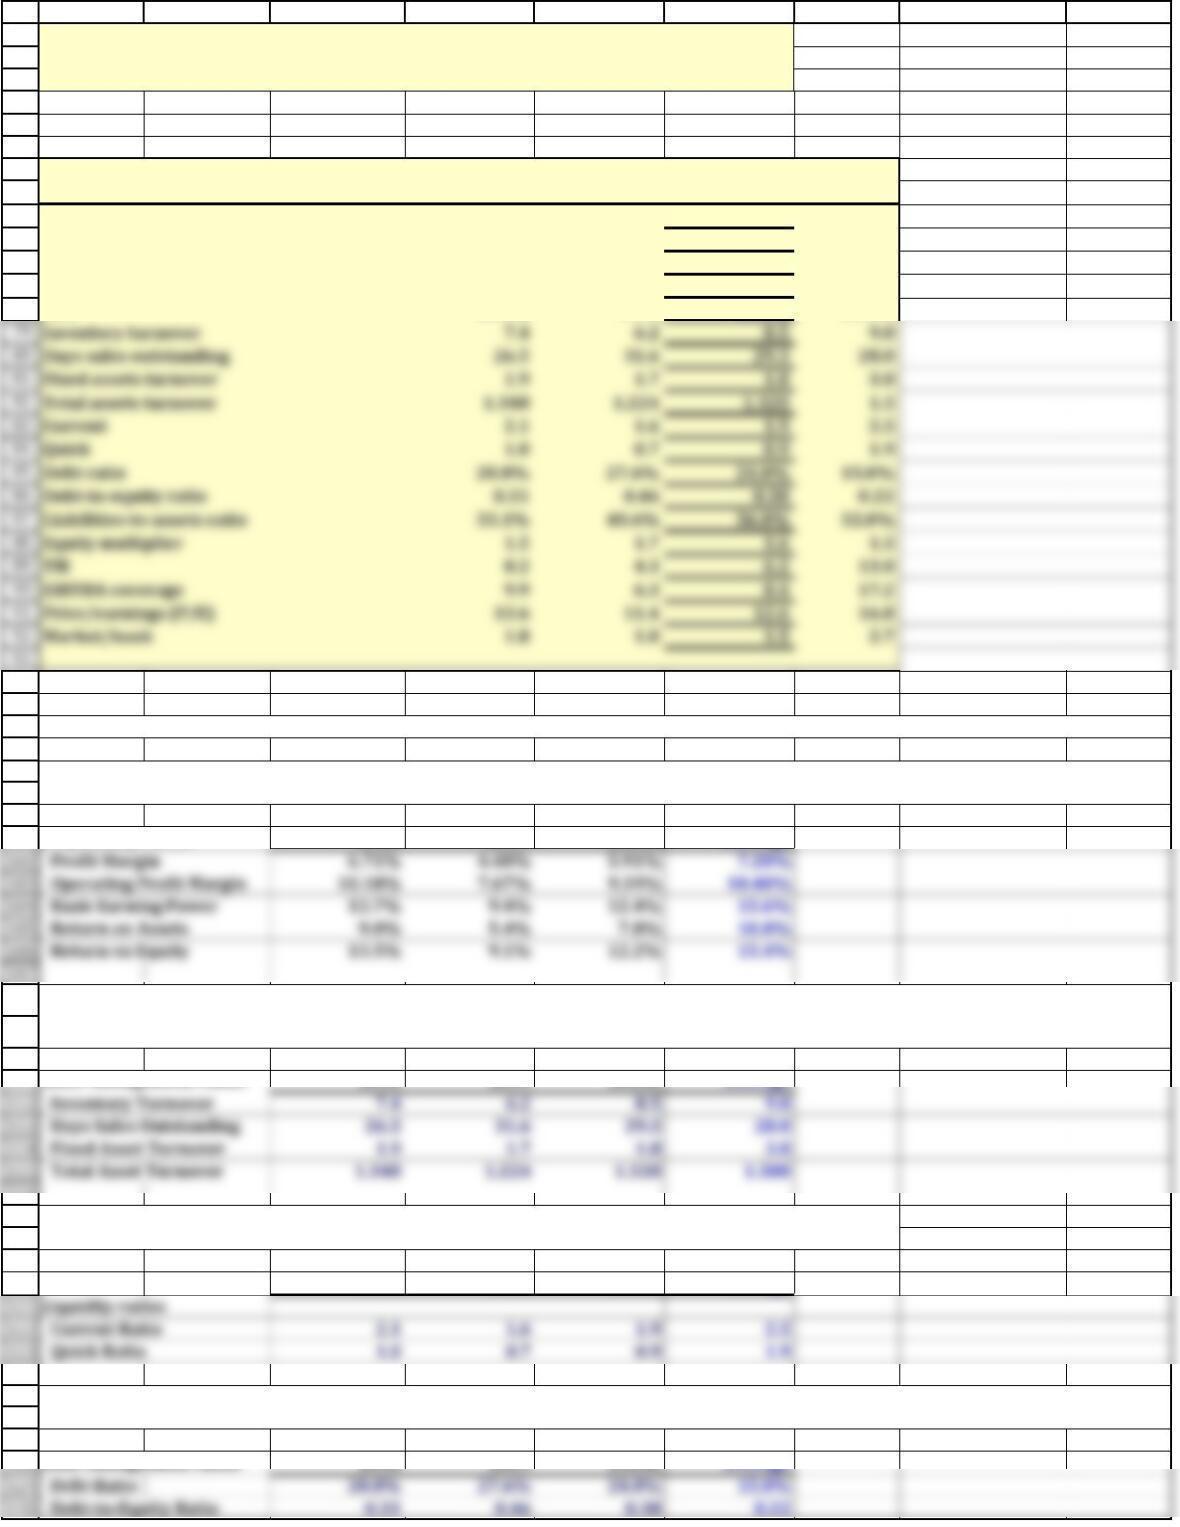
Profit Margin 6.71% 4.40% 5.91% 7.20%
Operating Profit Margin 10.18% 7.67% 9.39% 10.40%
Basic Earning Power 13.7% 9.4% 12.4% 15.6%
Return on Assets 9.0% 5.4% 7.8% 10.8%
Return on Equity 13.5% 9.1% 12.2% 15.4%
108
109
110
111
112
113
114
115
Inventory Turnover 7.4 6.2 8.5 9.0
Days Sales Outstanding 26.5 31.6 29.3 28.0
Fixed Asset Turnover 1.9 1.7 1.8 3.0
Total Asset Turnover 1.348 1.224 1.320 1.500
116
117
118
119
120
121
122
123
Current Ratio 2.1 1.6 1.9 2.5
Quick Ratio 1.0 0.7 0.9 1.9
124
125
126
127
128
129
130
Debt Ratio 20.8% 27.6% 24.0% 15.0%
Debt-to-Equity Ratio 0.31 0.46 0.38 0.22
A B C D E F G H I
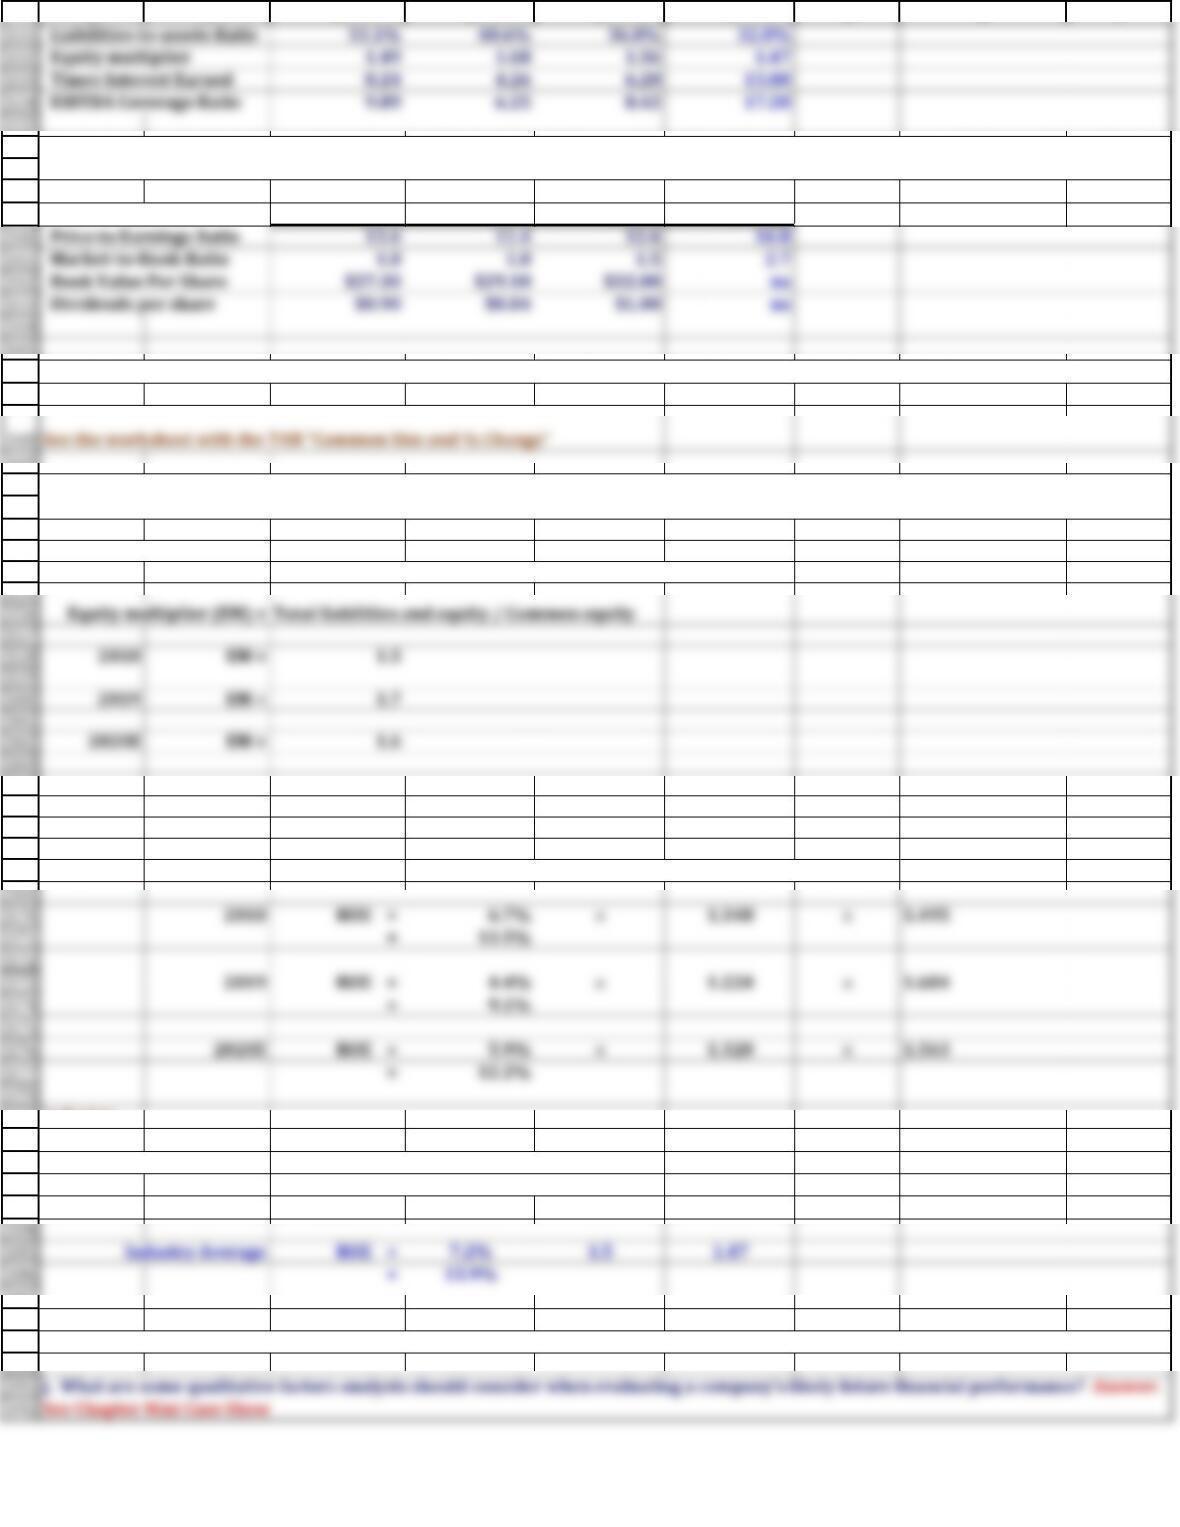
DPS $0.90 $0.84 $1.00
Book Value Per Share $27.30 $29.10 $32.00
Ratio Analysis
Profit margin 6.7% 4.4% 5.9% 7.2%
Operating profit margin 10.2% 7.7% 9.4% 10.4%
Basic earning power 13.7% 9.4% 12.4% 15.6%
ROA 9.0% 5.4% 7.8% 10.8%
ROE 13.5% 9.1% 12.2% 15.4%
Industry
Profitability ratios 2018 2019 2020E Average
Industry
Asset Management ratios 2018 2019 2020E Average
Industry
2018 2019 2020E Average
Industry
Debt Management ratios 2018 2019 2020E Average
e. Calculate the debt ratio, liabilities-to-assets ratio, times-interest-earned, and EBITDA coverage ratios. How does Computron compare
with the industry with respect to financial leverage? What can you conclude from these ratios?
b. Calculate the profit margin, operating profit margin, basic earning power (BEP), return on assets (ROA), and return on equity (ROE).
What can you say about these ratios?
a. Why are ratios useful? What three groups use ratio analysis and for what reasons? Answer: See Chapter Mini Case Show
c. Calculate the inventory turnover, days sales outstanding (DSO), fixed assets turnover, operating capital requirement, and total assets
turnover. How does Computron’s utilization of assets stack up against other firms in its industry?
2018
d. Calculate the current and quick ratios based on the projected balance sheet and income statement
data. What can you say about the company’s liquidity position and its trend?
2019
Industry
Average
2020E
79
80
81
82
83
84
85
86
87
88
89
90
91
92
93
Inventory turnover 7.4 6.2 8.5 9.0
Days sales outstanding 26.5 31.6 29.3 28.0
Fixed assets turnover 1.9 1.7 1.8 3.0
Total assets turnover 1.348 1.224 1.320 1.5
Debt ratio 20.8% 27.6% 24.0% 15.0%
Debt-to-equity ratio 0.31 0.46 0.38 0.22
Liabilities-to-assets ratio 33.1% 40.6% 36.0% 32.0%
Equity multiplier 1.5 1.7 1.6 1.5
EBITDA coverage 9.9 6.3 8.4 17.2
Price/earnings (P/E) 13.6 11.4 12.6 16.8
136
137
138
139
140
141
142
143
144
145
146
147
149
150
151
152
153
154
155
156
157
158
159
160
161
162
163
164
165
166
167
168
169
170
171
172
173
174
175
176
177
178
179
180
181
182
183
184
185
186
187
188
189
190
191
192
A B C D E F G H I
Industry
Market Value ratios 2018 2019 2020E Average
DuPont Analysis
ROE = (Profit margin)(Total asset turnover)(Equity multiplier)
Computron: ROE = Profit margin x Total asset turnover x Equity multiplier
Industry:
Equity multiplier = Total liabilities and equity / Common equity
=1 / (1 − liabilities-to-assets ratio)
= 1.47
f. Calculate the price/earnings ratio and market/book ratio. Do these ratios indicate that investors are expected to have a high or low
opinion of the company?
h. Use the extended DuPont equation to provide a summary and overview of Computron’s projected financial condition. What are the
firm’s major strengths and weaknesses?
g. Perform a common size analysis and percent change analysis. What do these analyses tell you about Computron?
i. What are some potential problems and limitations of financial ratio analysis? Answer: See Chapter Mini Case Show
131
132
133
134
135