Answers and Solutions: 3 – 1
Chapter 3
Analysis of Financial Statements
ANSWERS TO END-OF-CHAPTER QUESTIONS
3-1 a. A liquidity ratio is a ratio that shows the relationship of a firm’s cash and other current
assets to its current liabilities. The current ratio is found by dividing current assets by
current liabilities. It indicates the extent to which current liabilities are covered by those
assets expected to be converted to cash in the near future. The quick, or acid test, ratio
is found by taking current assets less inventories and then dividing by current liabilities.
c. Financial leverage ratios measure the use of debt financing. The debt ratio is the ratio
of total debt, which usually is the sum of notes payable and long-term bonds, to total
assets, it measures the percentage of assets financed by debtholders. The debt-to-equity
ratio is the total debt divided by the total common equity. The times-interest-earned
ratio is determined by dividing earnings before interest and taxes by the interest
charges. This ratio measures the extent to which operating income can decline before
the firm is unable to meet its annual interest costs. The EBITDA coverage ratio is
similar to the times-interest-earned ratio, but it recognizes that many firms lease assets
and also must make sinking fund payments. It is found by adding EBITDA and lease
payments then dividing this total by interest charges, lease payments, and sinking fund
payments over one minus the tax rate.
Answers and Solutions: 3 – 2
f. Trend analysis is an analysis of a firm’s financial ratios over time. It is used to estimate
the likelihood of improvement or deterioration in its financial situation. Comparative
ratio analysis is when a firm compares its ratios to other leading companies in the same
industry. This technique is also known as benchmarking.
3-2 The emphasis of the various types of analysts is by no means uniform nor should it be.
Management is interested in all types of ratios for two reasons. First, the ratios point out
weaknesses that should be strengthened; second, management recognizes that the other
parties are interested in all the ratios and that financial appearances must be kept up if the
firm is to be regarded highly by creditors and equity investors. Equity investors are
interested primarily in profitability, but they examine the other ratios to get information on
the riskiness of equity commitments. Long-term creditors are more interested in the debt
ratio, TIE, and fixed-charge coverage ratios, as well as the profitability ratios. Short-term
creditors emphasize liquidity and look most carefully at the liquidity ratios.
Answers and Solutions: 3 – 3
3-5 a. Cash, receivables, and inventories, as well as current liabilities, vary over the year for
firms with seasonal sales patterns. Therefore, those ratios that examine balance sheet
figures will vary unless averages (monthly ones are best) are used.
b. Common equity is determined at a point in time, say December 31 of a particular year.
Profits are earned over time, say during that particular year. If a firm is growing rapidly,
year-end equity will be much larger than beginning-of-year equity, so the calculated
rate of return on equity will be different depending on whether end-of-year, beginning-
of-year, or average common equity is used as the denominator. Average common
equity is conceptually the best figure to use. In public utility rate cases, people are
reported to have deliberately used end–of-year or beginning-of-year equity to make
returns on equity appear excessive or inadequate. Similar problems can arise when a
firm is being evaluated.
Answers and Solutions: 3 – 4
SOLUTIONS TO END-OF-CHAPTER PROBLEMS
3-2 TA = $200 million, notes payable =$5 million, and LT debt = $25 million.
Debt ratio = Debt-to-assets ratio =
assetsTotal
debtTotal
=
$200
$25$5+
= 15%.
3-4 Earnings per share = $1.50; FCF per share = $3.00; P/FCF = 8.0; P/E = ?
P/FCF = 8.0
P/$3.00 = 8.0
P = $24.00.
P/E = $24.00/$1.50 = 16.0.
Answers and Solutions: 3 – 5
3-7 CA = $3,000,000;
CL
CA
= 1.5;
CL
I – CA
= 1.0;
CL = ?; I = ?
.$2,000,000 = CL
$3,000,000 = CL1.5
1.5 =
CL
$3,000,000
1.5 =
CL
CA
1.0 =
CL
nvI –CA
1.0 =
$2,000,000
nvI – $3,000,000
$3,000,000 – Inv = $2,000,000
Inv = $1,000,000
Answers and Solutions: 3 – 6
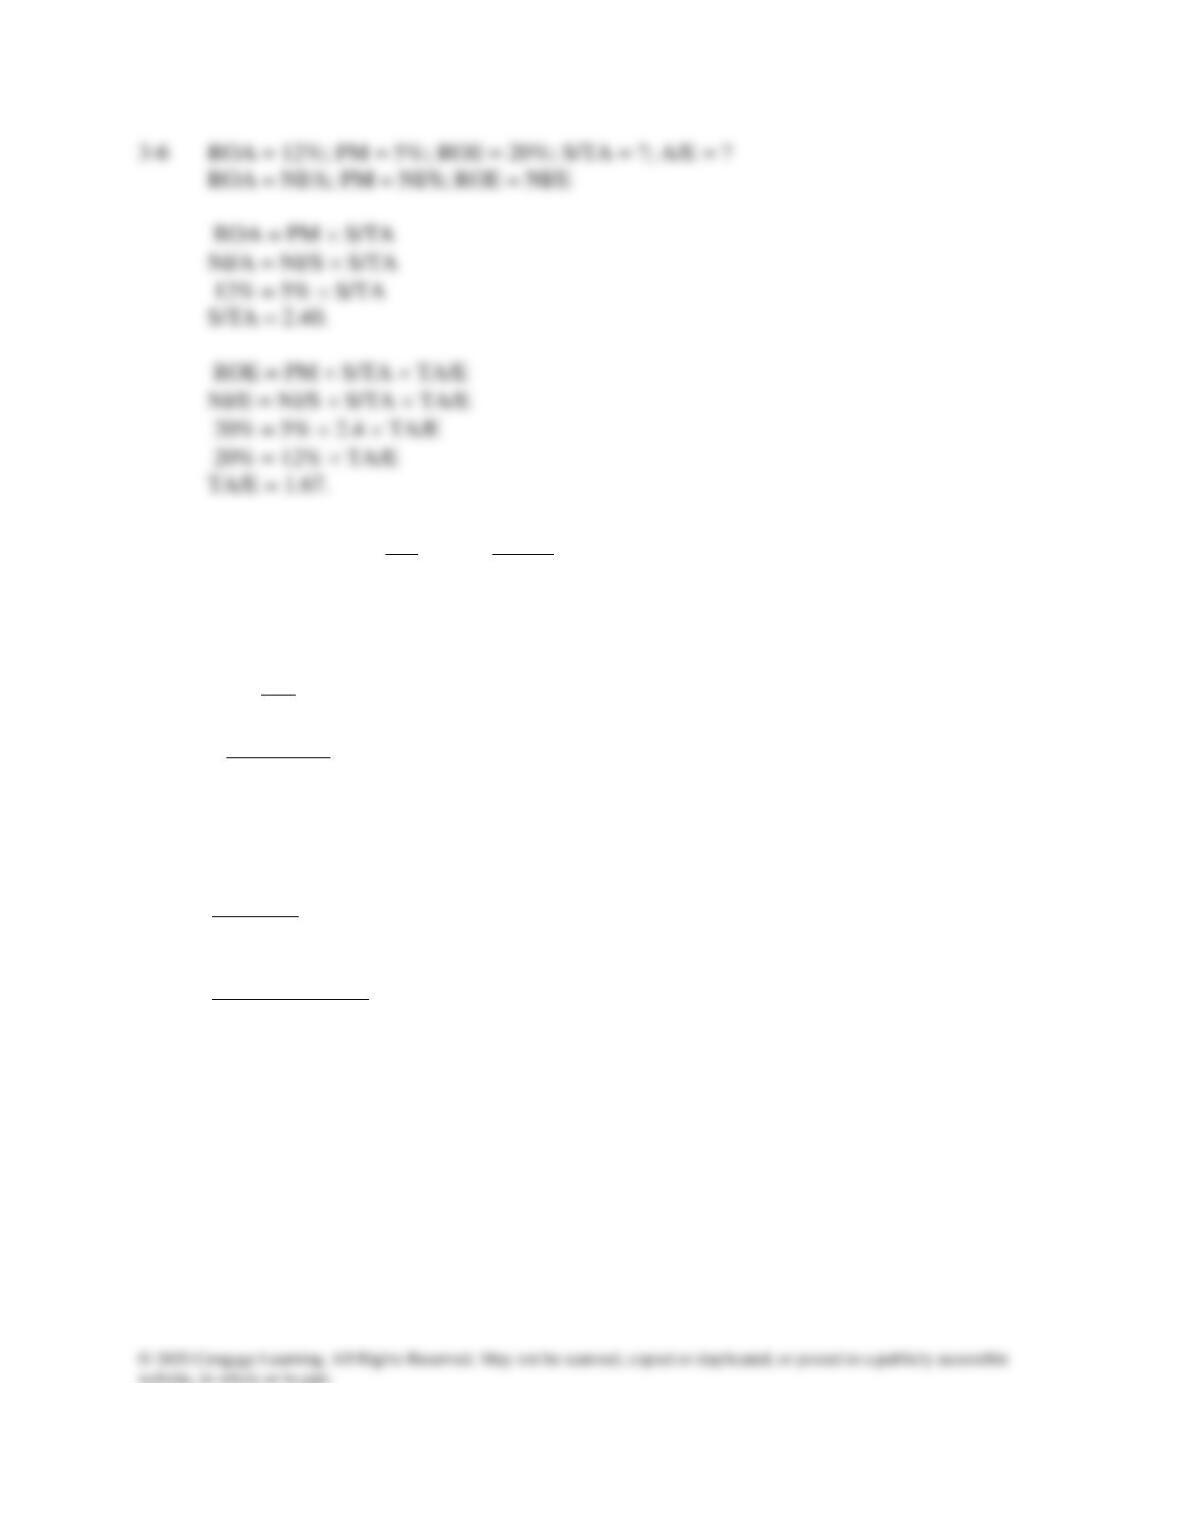
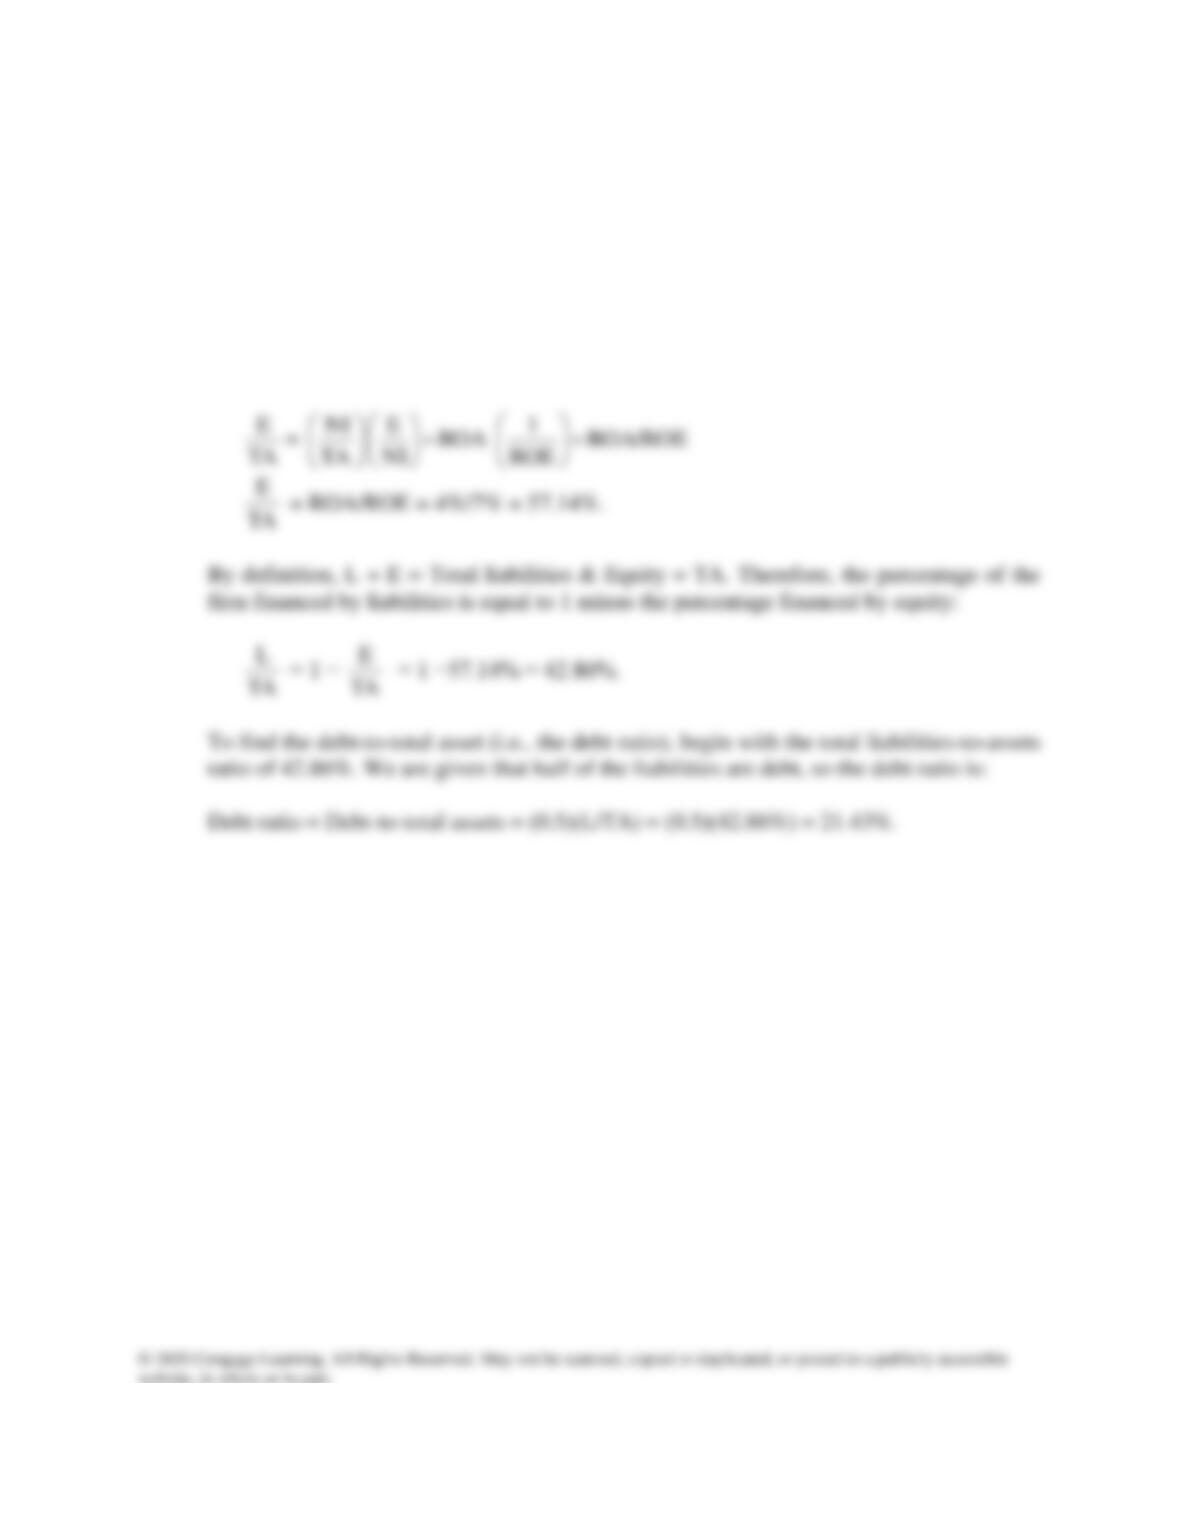
3-8 We are given ROA = 4%, ROE = 7%, and TAT = Sales/Total assets = 1.2.
From DuPont equation: ROA = Profit margin Total assets turnover
4% = Profit margin (1.2)
Profit margin = 4%/1.2 = 3.33%.
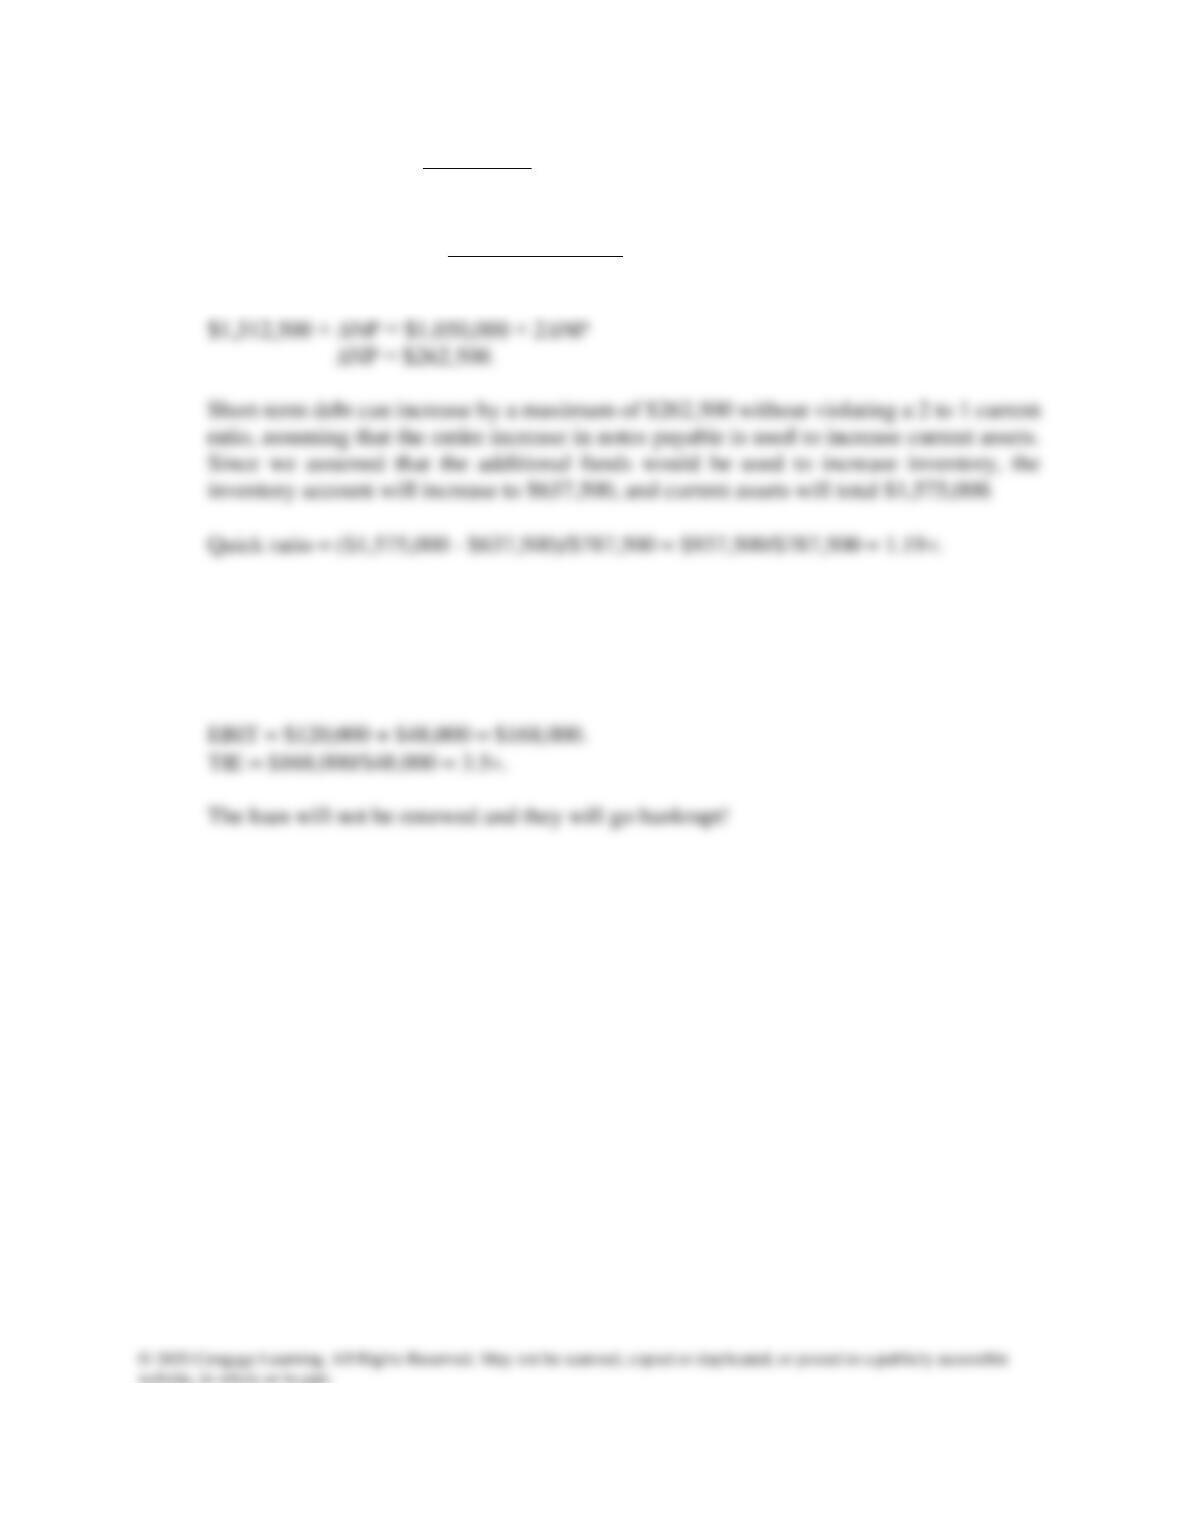
We can also calculate the company’s liabilities-to-assets (L/TA) ratio in a similar manner,
given the facts of the problem. We are given ROA = NI/TA and ROE= NI/E. We begin by
finding the percentage of assets financed by equity, E/TA:
Answers and Solutions: 3 – 7
3-9 Present current ratio =
$525,000
$1,312,500
= 2.5.
Minimum current ratio =
NP + $525,000
NP + $1,312,500
= 2.0.
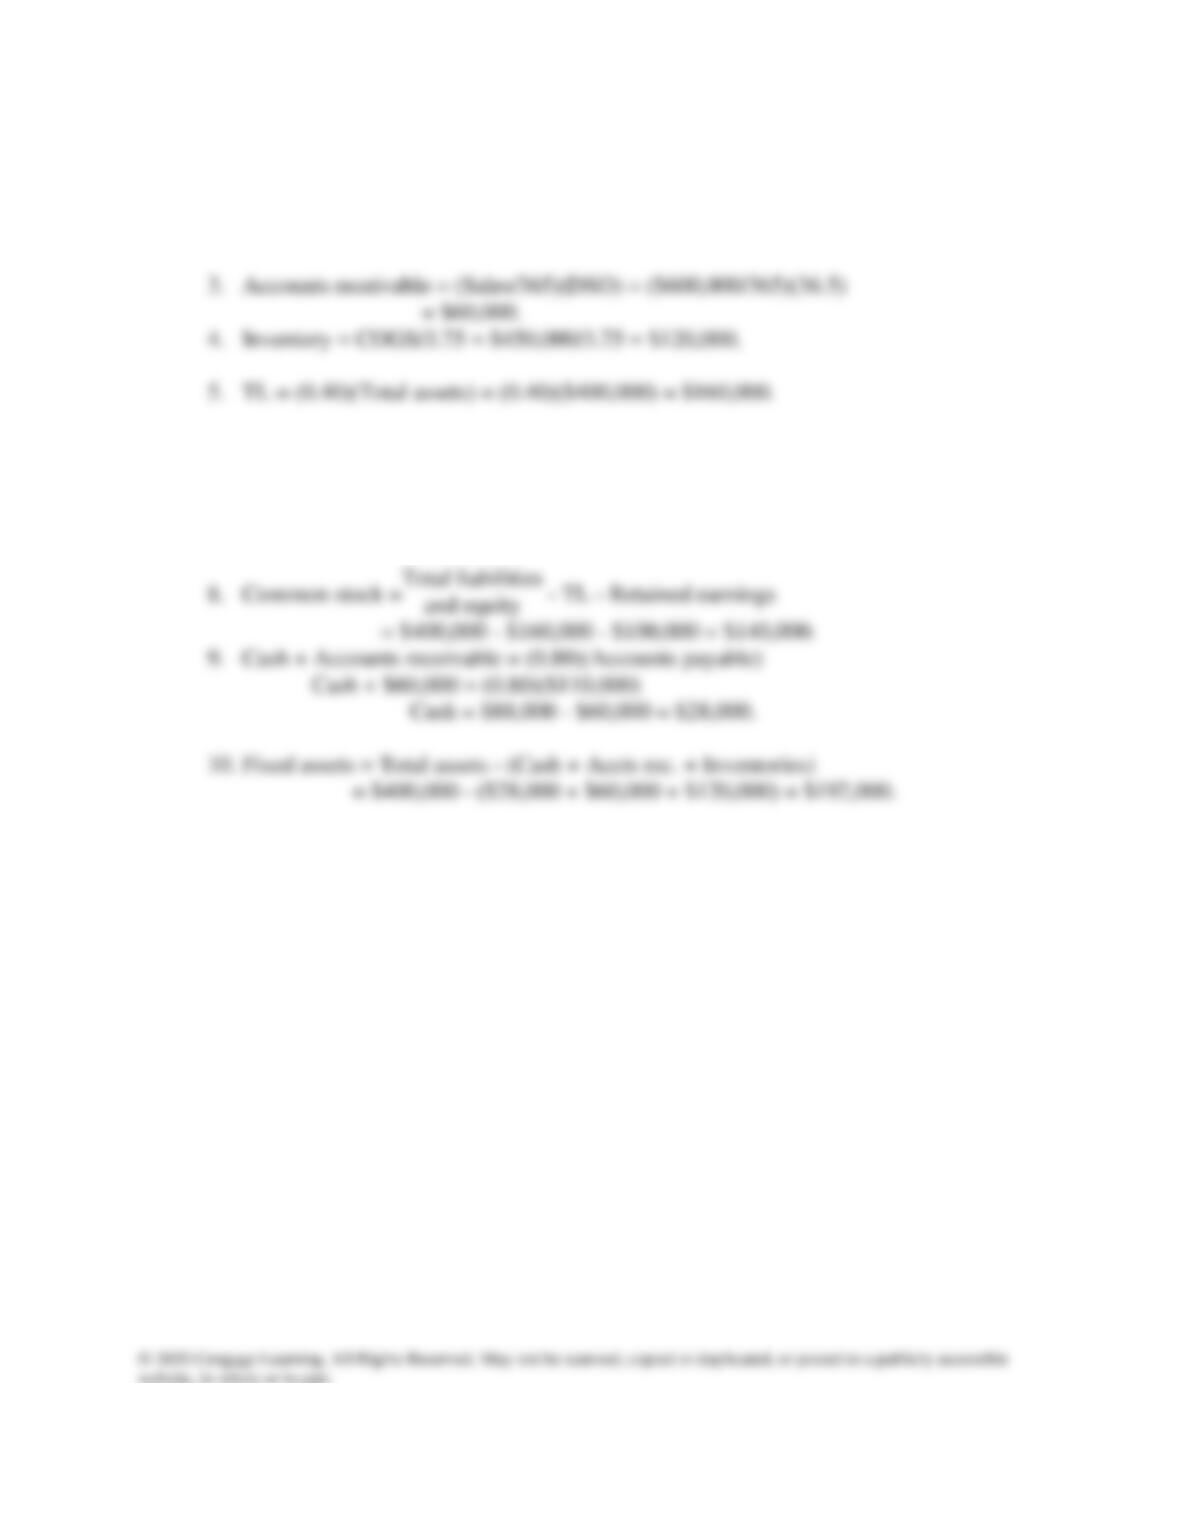
3-10 TIE = EBIT/Interest expense, so find EBIT and Interest expense.
Interest = $600,000 0.08 = $48,000.
Net income = $3,000,000 0.03 = $90,000.
Pre-tax income = $90,000/(1 – T) = $90,000/0.75 = $120,000.
Answers and Solutions: 3 – 8
3-11 1. Sales = (1.5)(Total assets) = (1.5)($400,000) = $600,000.
2. Cost of goods sold = (Sales)(1 – 0.25) = ($600,000)(0.75)
= $450,000.
6. Total liabilities and equity = Total assets
= $400,000. (TA given in problem statement.)
7. Accounts payable = TL – Long-term debt = $160,000 – $50,000
= $110,000
Answers and Solutions: 3 – 9
3-12 1. Current assets
Current liabilities = 3.0
sliabilitieCurrent
$810,000
= 3.0
Current liabilities = $810,000/3 = $270,000.
2. Current assets − Inventories
Current liabilities = 1.4
$270,000
sInventorie – $810,000
= 1.4
Inventories = $810,000 – (1.4)($270,000) = $432,000.
Answers and Solutions: 3 – 10
3-13 a. (Dollar amounts in thousands.)
Industry
Firm Average
Current assets
Current liabilities =
$2,925,000
$1,225,000
= 2.39 2.0
536Sales/
receivable Accounts
=
$1,575,000
$7,500,000/365
= 76.65 days 35 days
Sales
incomeNet
=
$114,000
$7,500,000
= 1.52% 1.2%
assets Total
incomeNet
=
$114,000
$4, 275,000
= 2.67% 3.6%
Answers and Solutions: 3 – 11
b. For the firm,
Equity multiplier (EM) =
$4, 275,000
$2,650,000
= 1.61%.
ROE = PM T.A. turnover EM = 1.52% 1.754 1.61 = 4.3%.
For the industry, ROE = 1.2% 3 2.5 = 9%.
Note: To find the industry ratio of assets to common equity, recognize that 1 minus the
Liabilities-to-assets ratio = common equity/total assets. So, common equity/total assets
= 1 – 60% = 40%, and 1/0.40 = 2.5 = total assets/common equity.
Answers and Solutions: 3 – 12
3-14 Here are the firm’s base case ratios and other data as compared to the industry:
Firm Industry Comment
Quick $511,000/$602,000 = 0.85 1.0 Weak
Current $1,405,000/$602,000 = 2.33 2.7 Weak
Inventory turnover $3,580,000/$894,000 = 4.00 7.0 Poor
Days sales outstanding $439,000/$11,753 = 37.35 days 32 days Poor
Fixed assets turnover $4,290,000/$431,000 = 9.95 13.0 Poor
Total assets turnover $4,290,000/$1,836,000 = 2.34 2.6 Poor
Return on assets $108,408/$1,836,000 = 5.90% 9.1% Bad

Answers and Solutions: 3 – 13
SOLUTION TO SPREADSHEET PROBLEM
3-15 The detailed solution for the problem is available is in the file Ch03 P15 Build a Model
Solution.xlsx and is available at the textbook’s web site.
Mini Case: 3 – 14
MINI CASE
The first part of the case, presented in Chapter 2, discussed the situation of Computron
Industries after an expansion program. A large loss occurred in 2019, rather than the
expected profit. As a result, its managers, directors, and investors are concerned about the
firm’s survival.
Jenny Cochran was brought in as assistant to Computron’s chairman, who had the task
of getting the company back into a sound financial position. Cochran must prepare an
analysis of where the company is now, what it must do to regain its financial health, and what
actions to take. Your assignment is to help her answer the following questions. Provide clear
explanations, not yes or no answers. Use the recent and projected financial information
shown next.
Balance Sheets
2018
2019
2020E
Assets
Cash and equivalents
$ 60
$ 50
$ 60
Short-term investments
100
10
50
Accounts receivable
400
520
530
Inventories
620
820
Total current assets
$1,400
$1,300
Net Fixed Assets
2,900
3,500
Total Assets
$4,900
$5,000
Liabilities and equity
2019
2020
2021E
Accounts payable
$ 300
$ 400
$ 330
Notes payable
50
250
100
Accruals
200
240
270
Total current liabilities
$ 550
$ 890
$ 700
Long-term bonds
800
1,100
1,100
Total liabilities
$1,990
$1,800
shares)
1,000
1,000
Retained earnings
1,730
1,910
2,200
Total common equity
$2,910
$3,200
Total liabilities and equity
$4,900
$5,000
Note: “E” denotes the “estimated forecast.”