Mini Case: 3 – 15
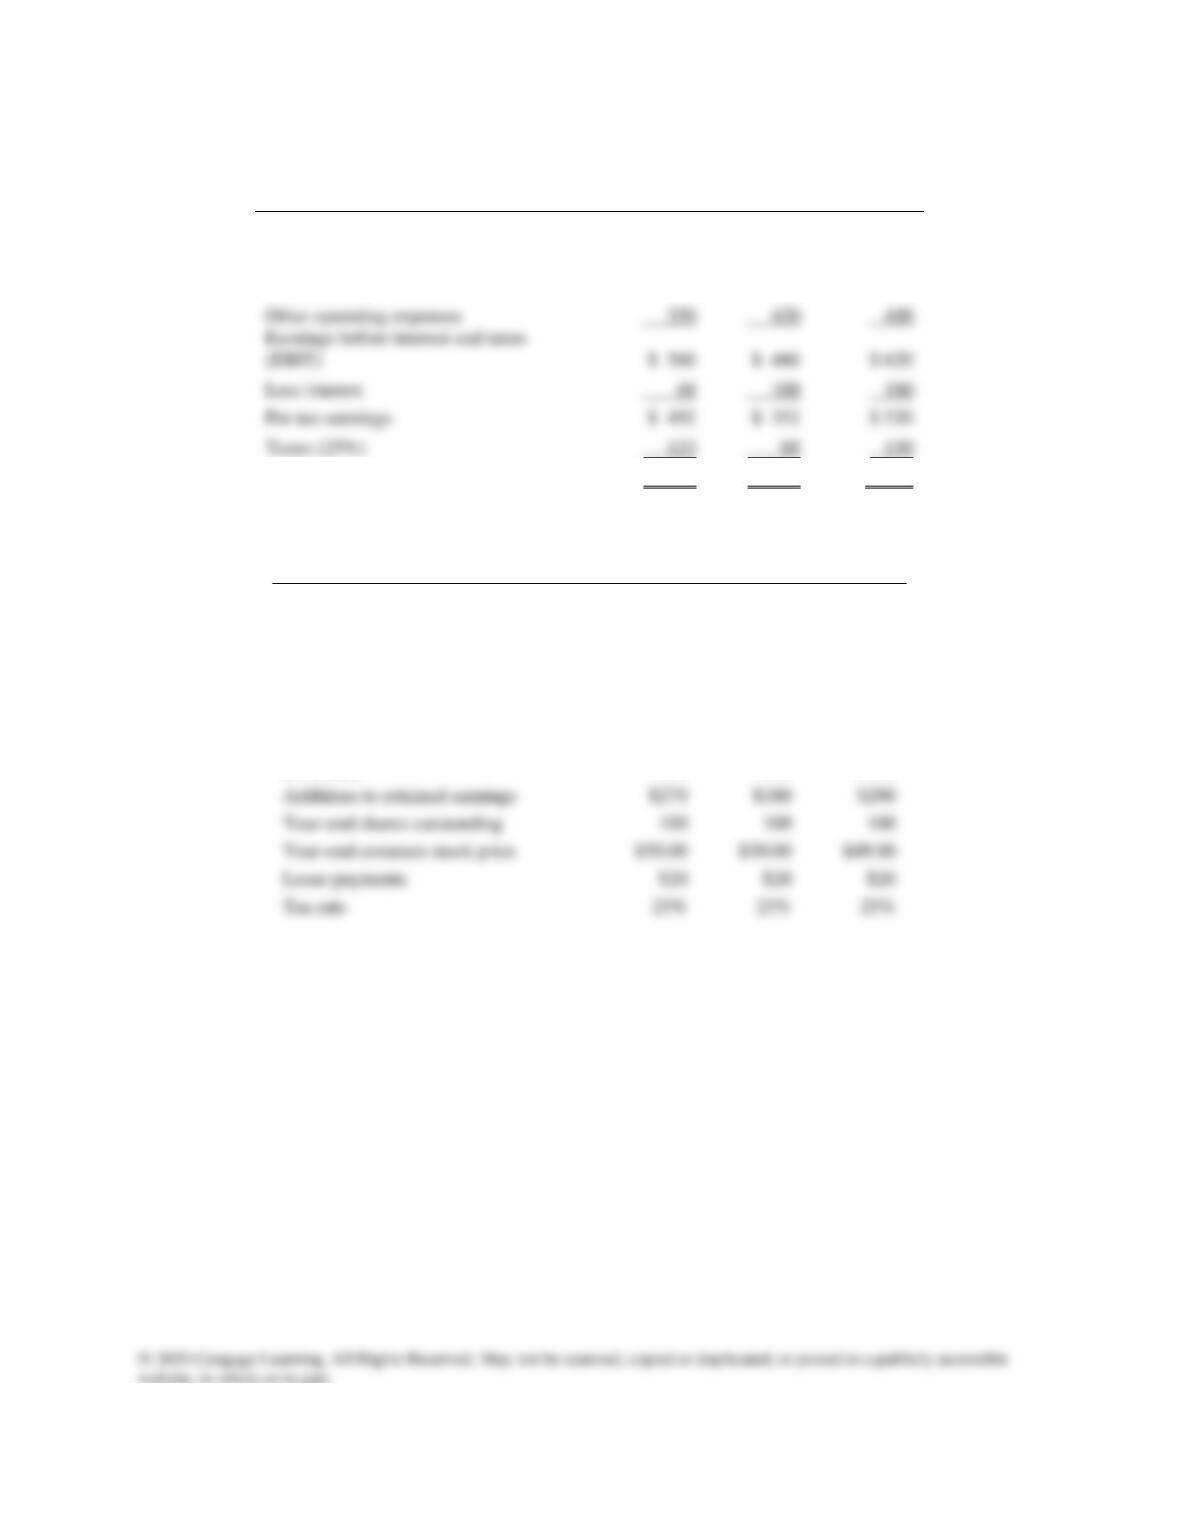
Income Statements
2018
2019
2020E
Net sales
$5,500
$6,000
$6,600
Cost of goods sold (Excluding depr.)
4,300
4,800
5,210
Depreciation
290
320
370
Other operating expenses
350
420
400
(EBIT)
$ 560
$ 460
$ 620
Less interest
68
108
100
Pre-tax earnings
$ 492
$ 352
$ 520
Taxes (25%)
123
88
130
Net Income
$ 369
$ 264
$ 390
Note: “E” denotes the “estimated forecast.” Also, Computron has no amortization.
Other Data
2018
2019
2020E
Per Share Information
EPS
$3.69
$2.64
$3.90
DPS
$0.90
$0.84
$1.00
Book Value Per Share
$27.30
$29.10
$32.00
Additional Information
Dividends
$90
$84
$100
Additions to retained earnings
$180
$290
100
100
100
$50.00
$30.00
Lease payments
$20
$20
$20
Tax rate
Note: “E” denotes the “estimated forecast.”
Mini Case: 3 – 16
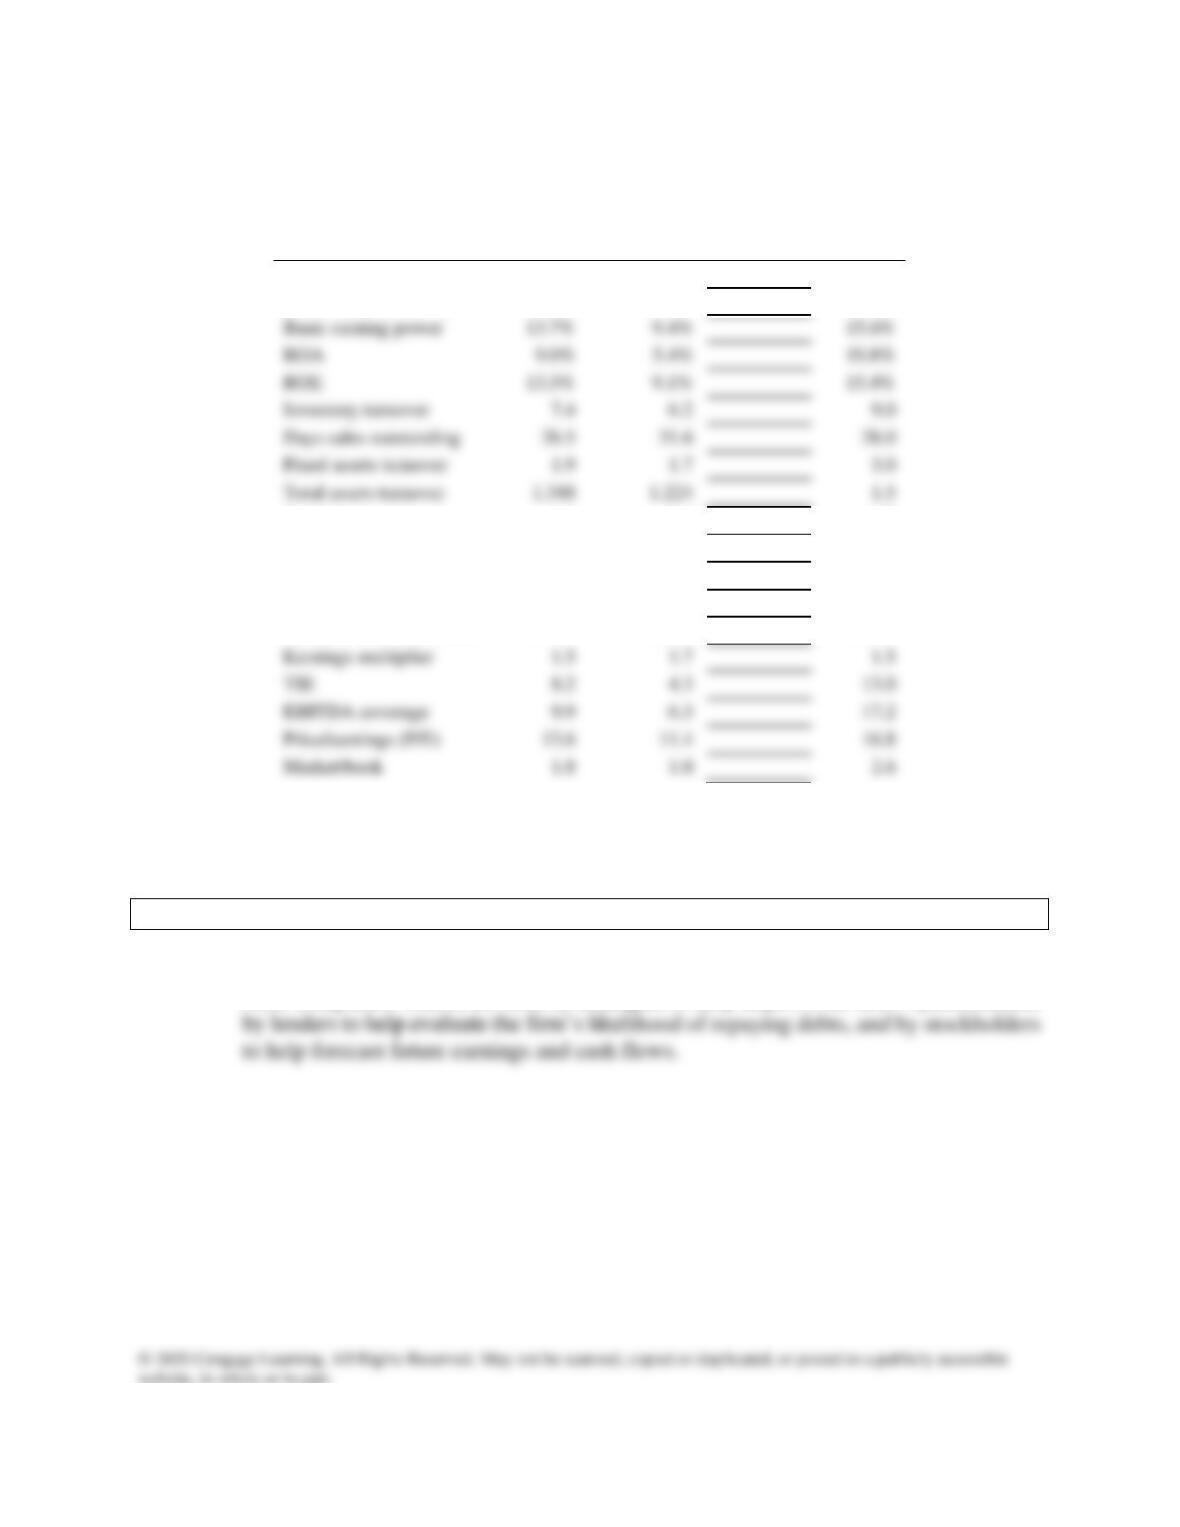
Ratio Analysis
2018
2019
2020E
Industry
Average
Profit margin
6.7%
4.4%
7.2%
Operating profit margin
10.2%
7.7%
10.4%
Basic earning power
13.7%
9.4%
15.6%
ROA
5.4%
10.8%
ROE
13.5%
9.1%
15.4%
Inventory turnover
7.4
6.2
9.0
Days sales outstanding
26.5
31.6
28.0
Fixed assets turnover
1.9
1.7
3.0
Total assets turnover
1.5
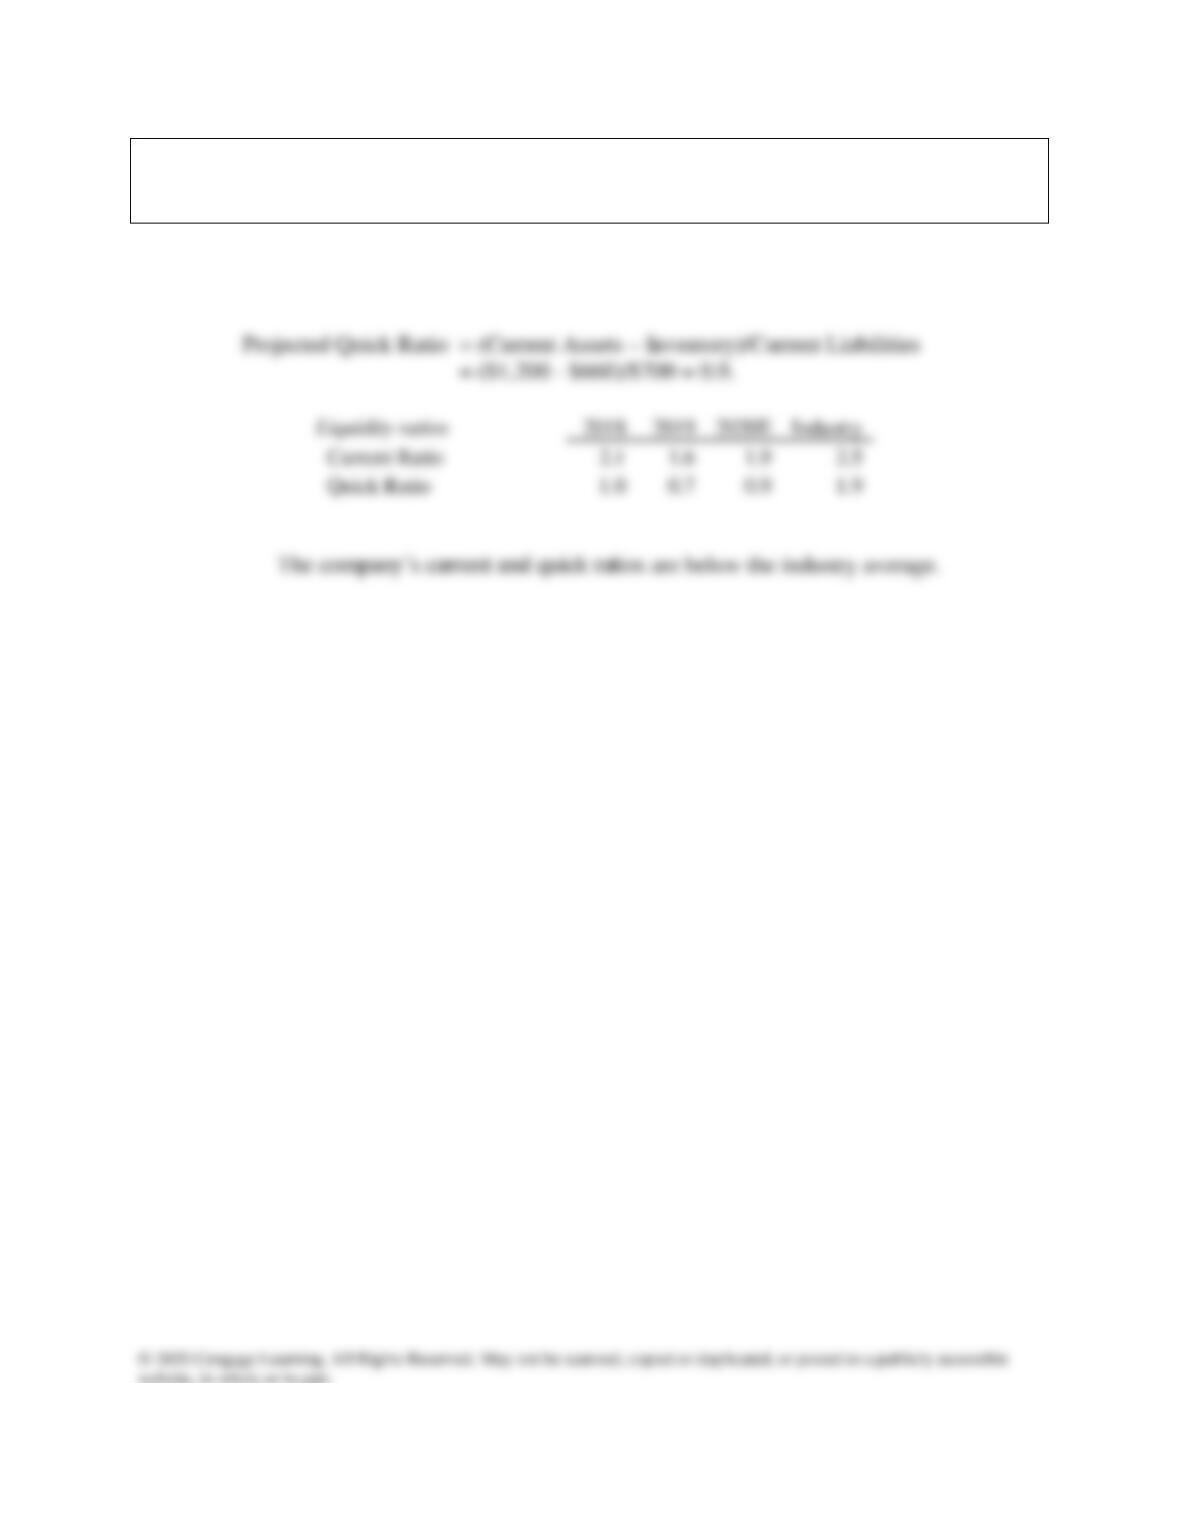
Current
2.1
1.6
2.5
Quick
1.0
0.7
1.4
Debt ratio
20.8%
27.6%
15.0%
Debt-to-equity ratio
0.31
0.46
0.22
Liabilities-to-assets ratio
33.1%
40.6%
30.0%
Earnings multiplier
1.5
1.7
1.5
8.2
EBITDA coverage
9.9
6.3
17.2
Price/earnings (P/E)
13.6
11.4
16.8
Market/book
1.8
1.0
2.6
Note: “E” denotes the “estimated forecast.”
a. Why are ratios useful? What three groups use ratio analysis and for what reasons?
Answer: Ratios facilitate comparison of (1) one company over time and (2) one company versus
other companies. Ratios are used by managers to help improve the firm’s performance,
Mini Case: 3 – 17
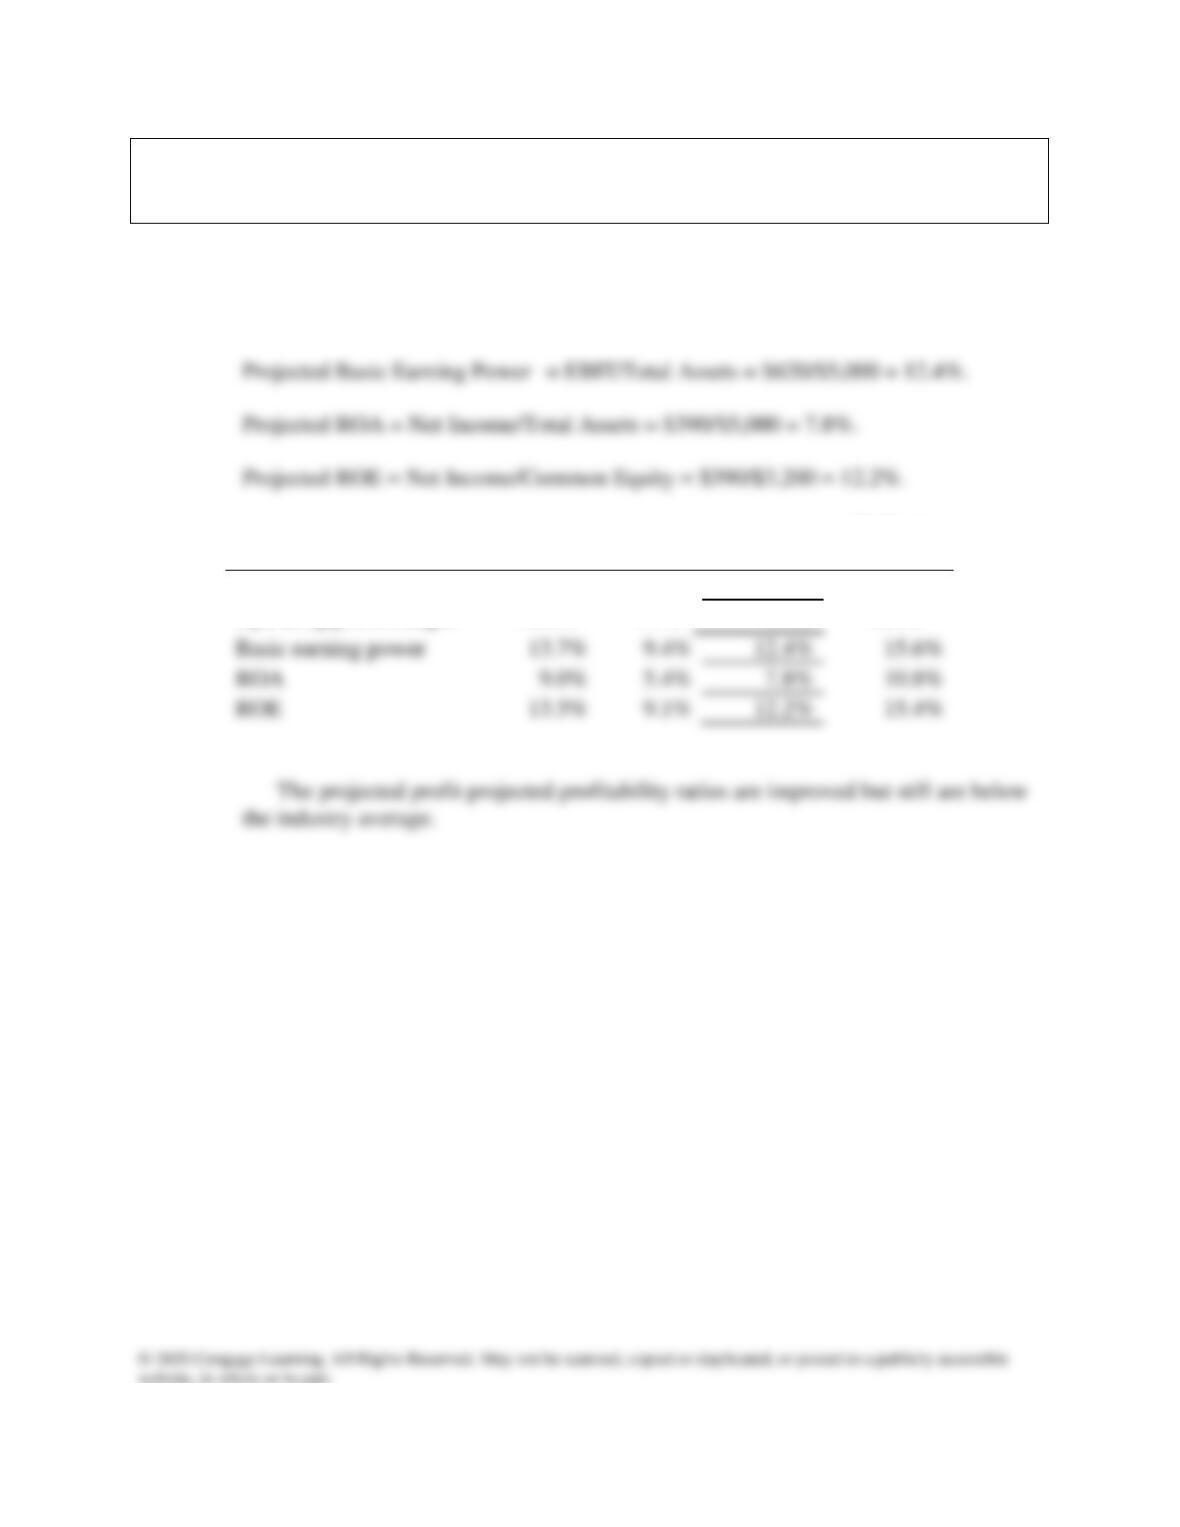
b. Calculate the projected profit margin, operating profit margin, basic earning
power (BEP), return on assets (ROA), and return on equity (ROE). What can you
say about these ratios?
Answer: Projected Profit Margin = Net Income/Sales = $390/$6,600 = 5.9%.
Projected Operating Profit Margin = EBIT/Sales = $620/$6,600 = 9.4%.
Profitability Ratios
2018
2019
2020E
Industry
Average
Profit margin
6.7%
4.4%
5.9%
7.2%
Operating profit margin
10.2%
7.7%
9.4%
10.4%
Mini Case: 3 – 18
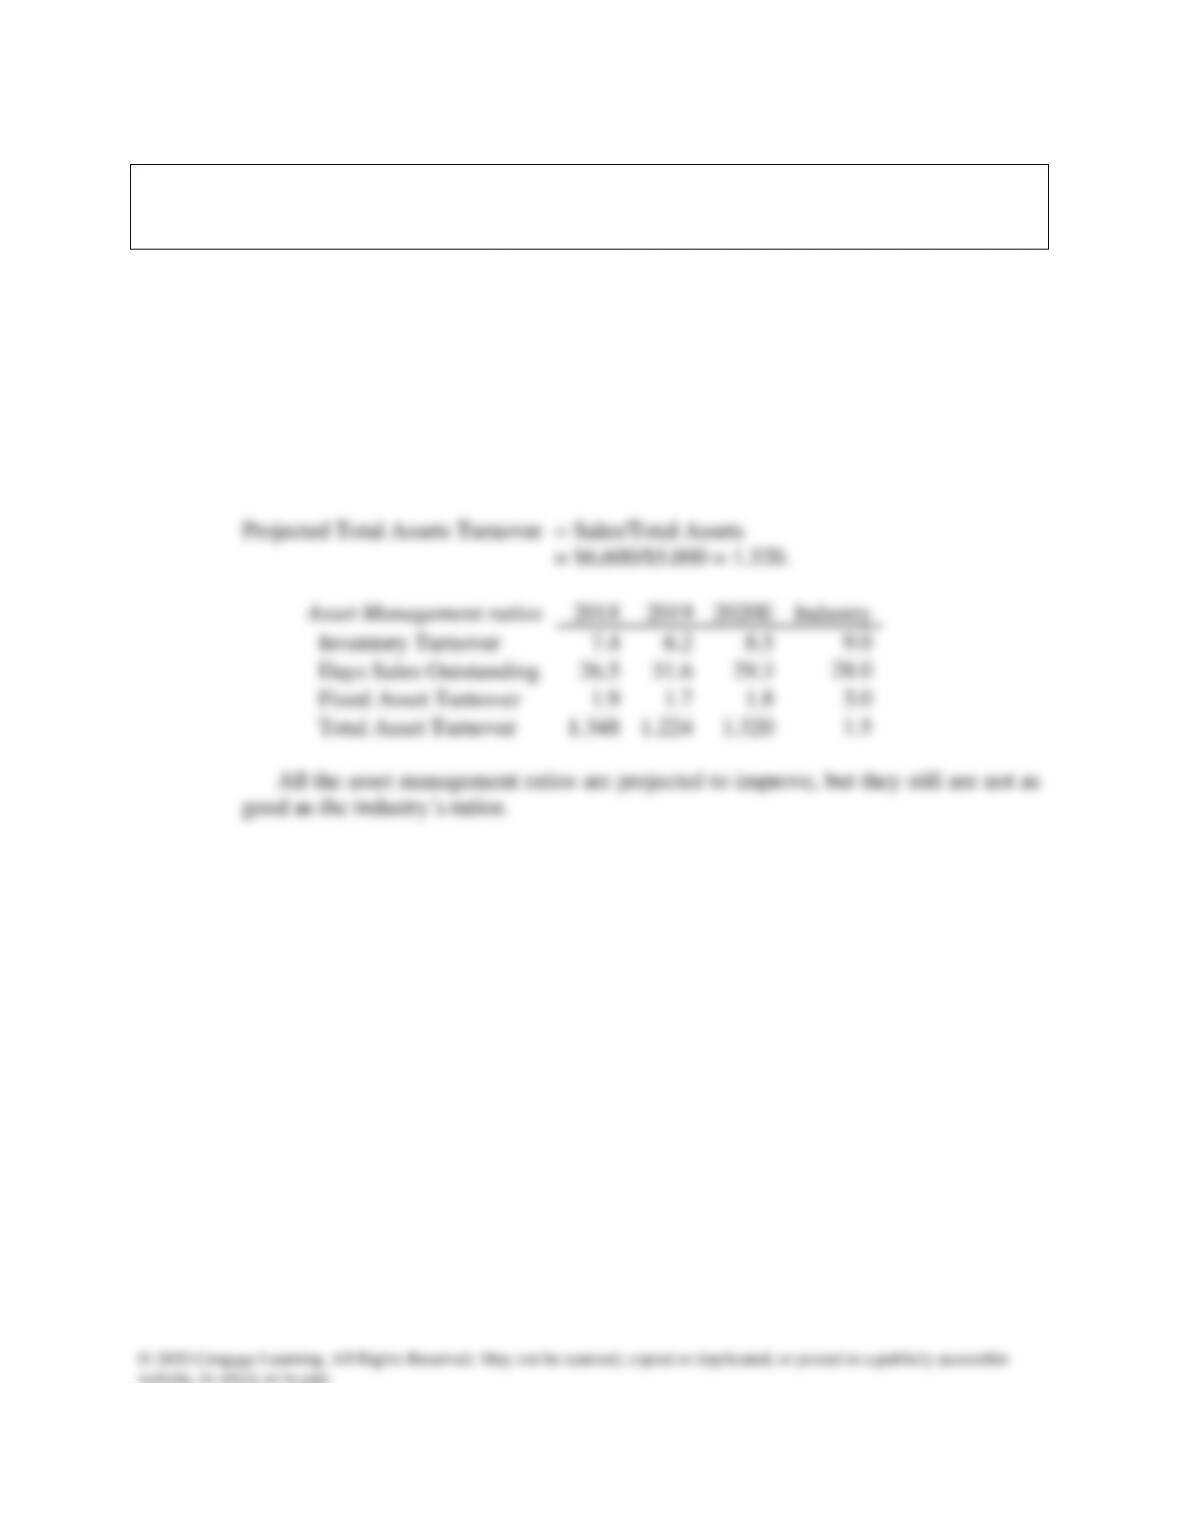
c. Calculate the projected inventory turnover, days sales outstanding (DSO), fixed
assets turnover, and total assets turnover. How does Computron’s utilization of
assets stack up against other firms in its industry?
Answer: Projected Inventory Turnover = COGS/Inventory
= ($5,210 + $370)/$700= 8.5.
Projected DSO = Receivables/(Sales/365)
= $530/($6,600/365) = 29.3 Days.
Projected Fixed Assets Turnover = Sales/Net Fixed Assets
= $6,600/$3,700 = 1.8.
Mini Case: 3 – 19
d. Calculate the projected current and quick ratios based on the projected balance
sheet and income statement data. What can you say about the company’s liquidity
position and its trend?
Answer: Projected Current Ratio = Current Assets/Current Liabilities
= $1,200/$700 = 1.9.
Mini Case: 3 – 20
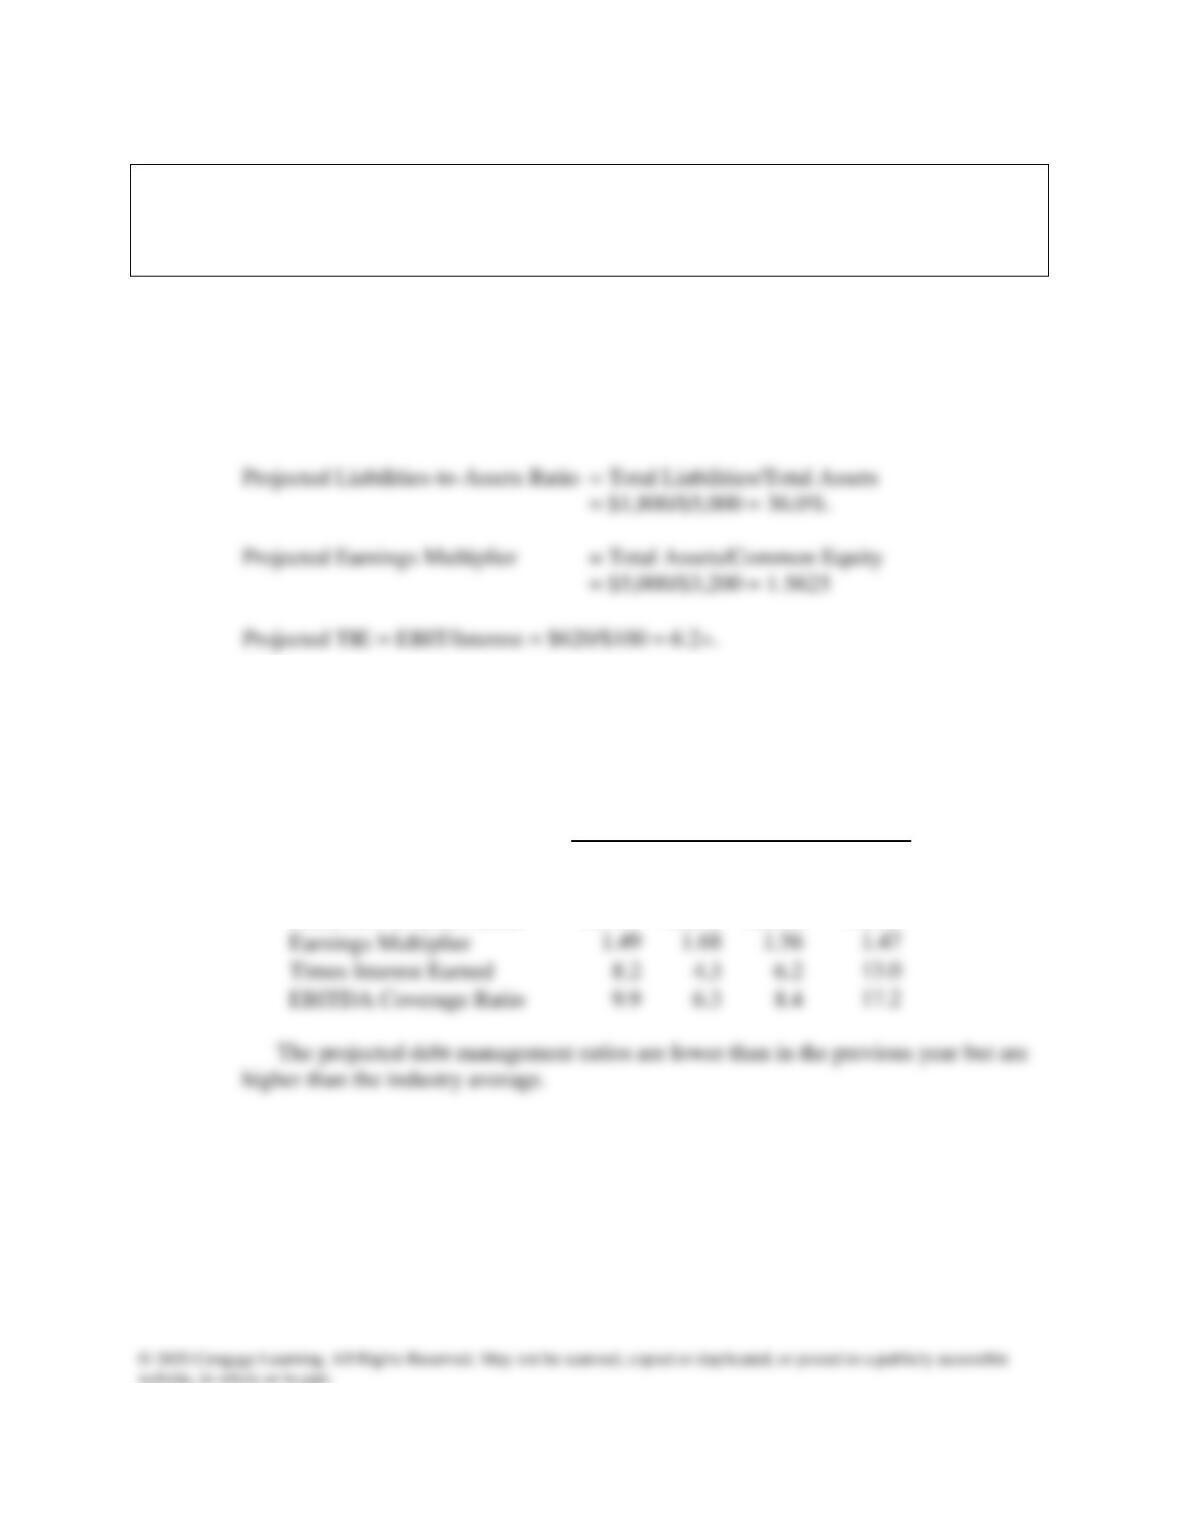
e. Calculate the projected debt ratio, the debt-to-equity ratio, liabilities-to-assets
ratio, earnings multiplier, times-interest-earned, and EBITDA coverage ratios.
How does Computron compare with the industry with respect to financial
leverage? What can you conclude from these ratios?
Answer: Projected Debt Ratio = Total Debt/Total Assets
= ($100+ $1,100)/$5,000 = 24.0%.
Projected Debt-to-Equity Ratio = Total Debt/Common Equity
= ($100 + $1,100)/$3,200 = 0.38.
Proj. EBITDA Cov. =
+Payments
Lease
EBITDA
/
++ Payments
Lease
Repayments
Loan
Interest
= ($620 + $370 + $20)/($100 + $20) = 8.4.
Debt Management ratios
2018
2019
2020E
Industry
Debt Ratio
20.8%
27.6%
24.0%
15.0%
Debt-to-Equity Ratio
0.31
0.46
0.38
0.22
Liabilities-to-assets Ratio
33.1%
40.6%
36.0%
32.0%
Earnings Multiplier
Times Interest Earned
EBITDA Coverage Ratio
Mini Case: 3 – 21
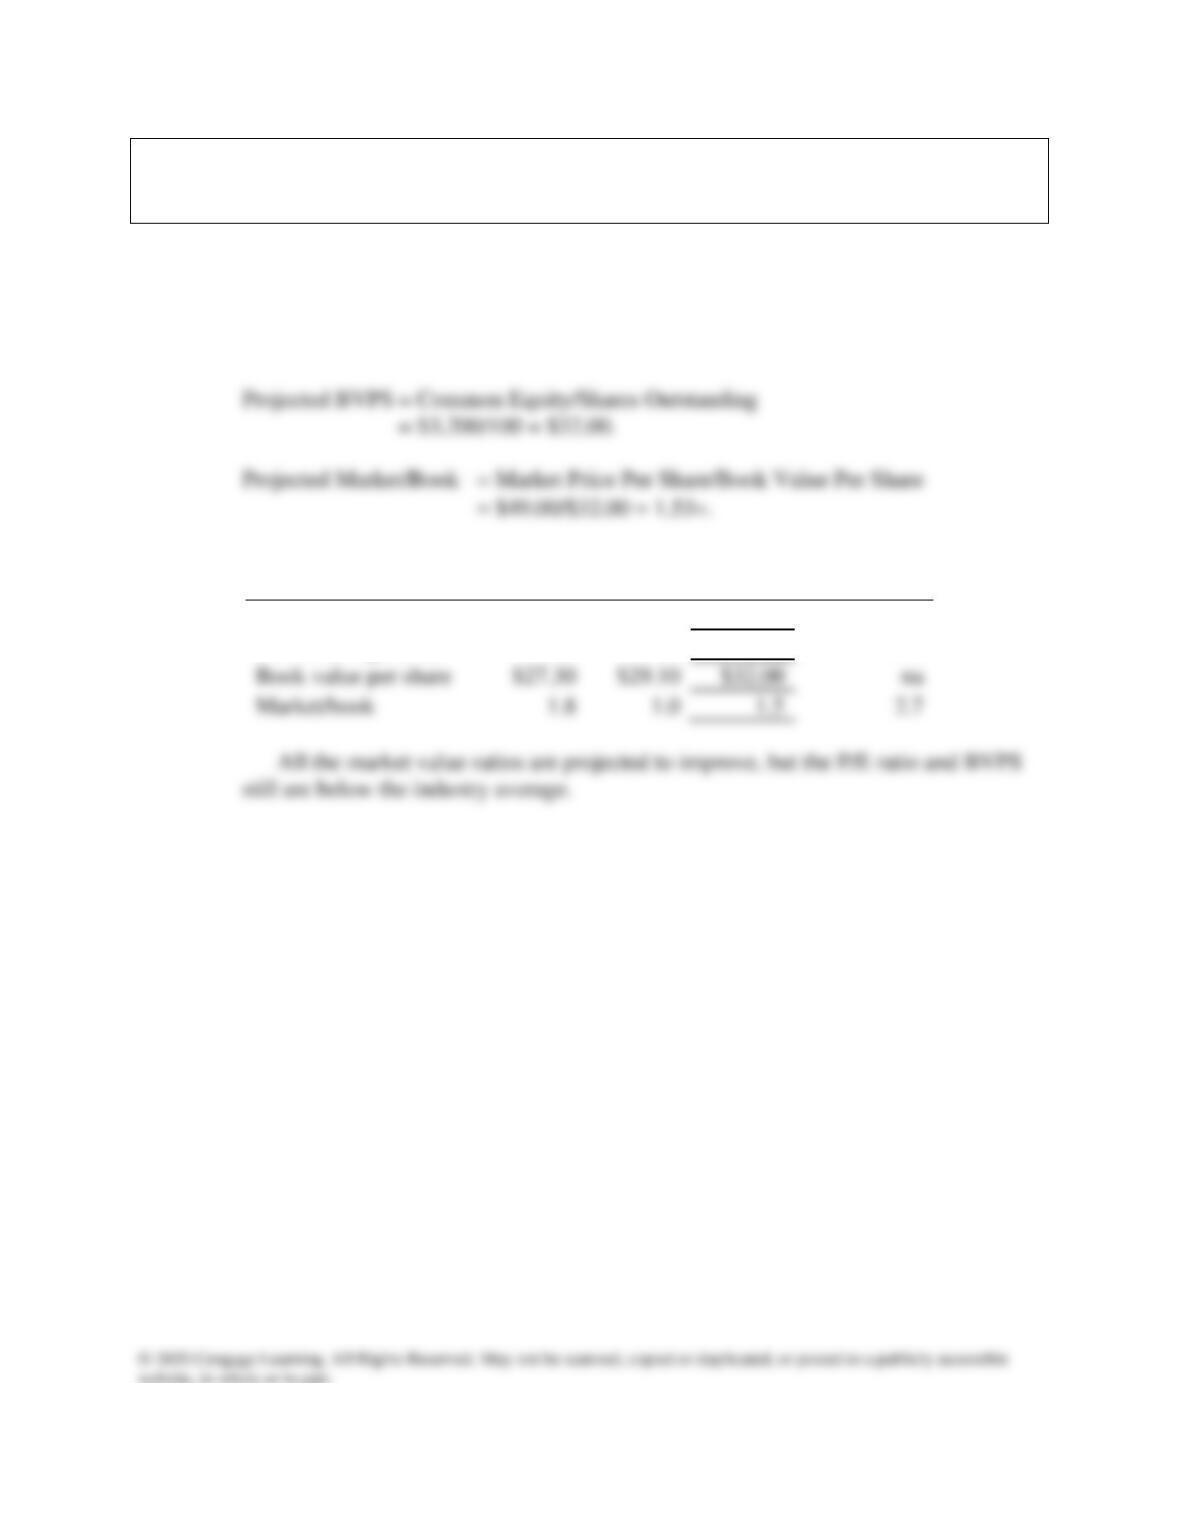
f. Calculate the projected price/earnings ratio and market/book ratio. Do these
ratios indicate that investors are expected to have a high or low opinion of the
company?
Answer: EPS = Net Income/Shares Outstanding = $390/100 = $3.90.
Projected Price/Earnings = Price Per Share/Earnings Per Share
= $49.00/$3.90 = 12.6.
Market Value Ratios
2018
2019
2020E
Industry
Average
Earnings per share
$3.69
$2.64
$3.90
na
Price/earnings (P/E)
13.6
11.4
12.6
16.8
Book value per share
na
Market/book
Mini Case: 3 – 22
g. Perform a common size analysis and percent change analysis. What do these
analyses tell you about Computron?
Answer: For the common size balance sheets, divide all items in a year by the total assets for
that year. For the common size income statements, divide all items in a year by the
sales in that year.
Common Size Balance Sheets
Assets
2018
2019
2020E
Industry
Cash and equivalents
1.5%
1.0%
1.2%
1.5%
Short-term investments
2.5%
0.2%
1.0%
24.9%
Accounts receivable
9.8%
11.5%
Inventories
12.1%
Total Current Assets
50.0%
Net Fixed Assets
50.0%
Total Assets
100.0%
100.0%
Common Size Balance Sheets
Liabilities and equity
2018
2019
2020E
Industry
Accounts payable
7.4%
8.2%
6.6%
6.8%
Notes payable
1.2%
5.1%
2.0%
3.0%
Accruals
4.9%
4.9%
5.4%
10.2%
Total current liabilities
20.0%
Long-term bonds
Total liabilities
32.0%
Common
27.2%
Retained earnings
Total common equity
68.0%
Total liabilities and equity
Mini Case: 3 – 23
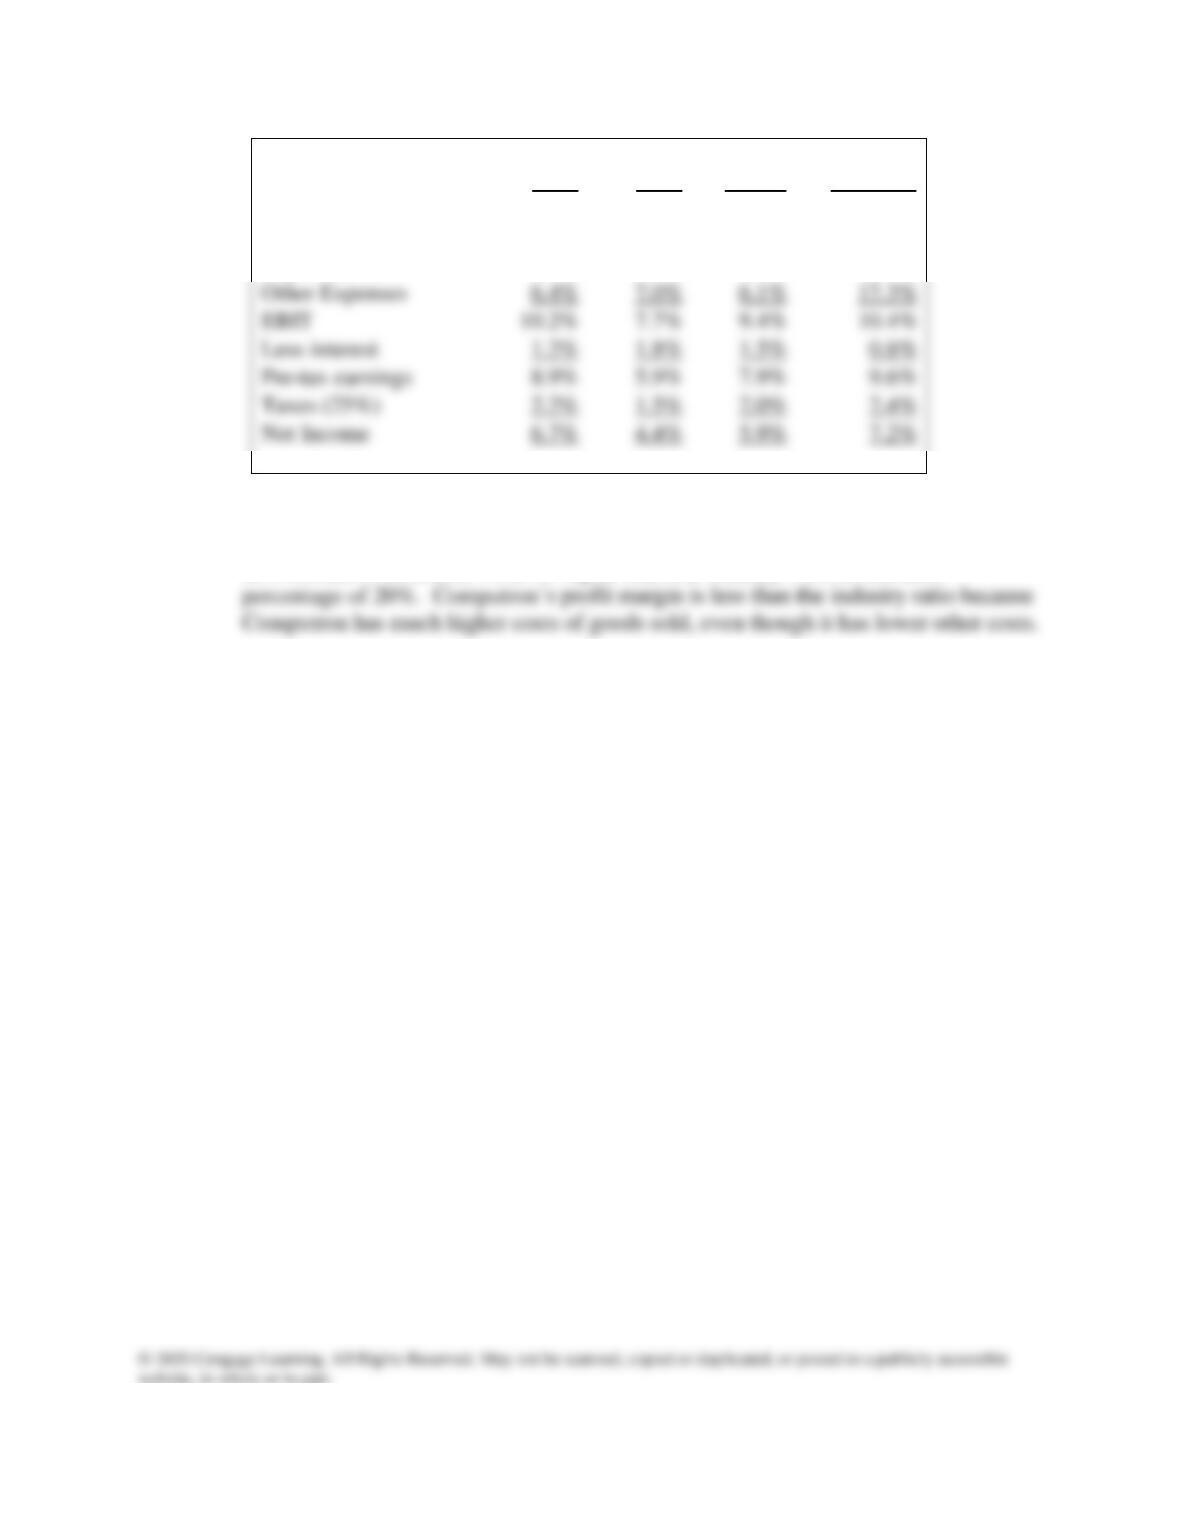
Common Size
Income Statements
2018
2019
2020E
Industry
Net sales
100.0%
100.0%
100.0%
100.0%
COGS except depr.
78.2%
80.0%
78.9%
69.0%
Depreciation
5.3%
5.3%
5.6%
3.3%
Other Expenses
6.4%
7.0%
6.1%
17.3%
EBIT
10.2%
7.7%
9.4%
10.4%
Less interest
1.2%
1.8%
1.5%
0.8%
Pre-tax earnings
8.9%
5.9%
7.9%
9.6%
Taxes (25%)
2.2%
1.5%
2.0%
2.4%
Net Income
6.7%
4.4%
5.9%
7.2%
Computron has higher proportion of net fixed assets than the industry.
Computron’s total debt is 24% (the combined percentages of notes payable and long-
term bonds) of its assets, which is higher than the industry’s combined debt
For the percent change analysis, divide all items in a row by the value in the first
year of the analysis.
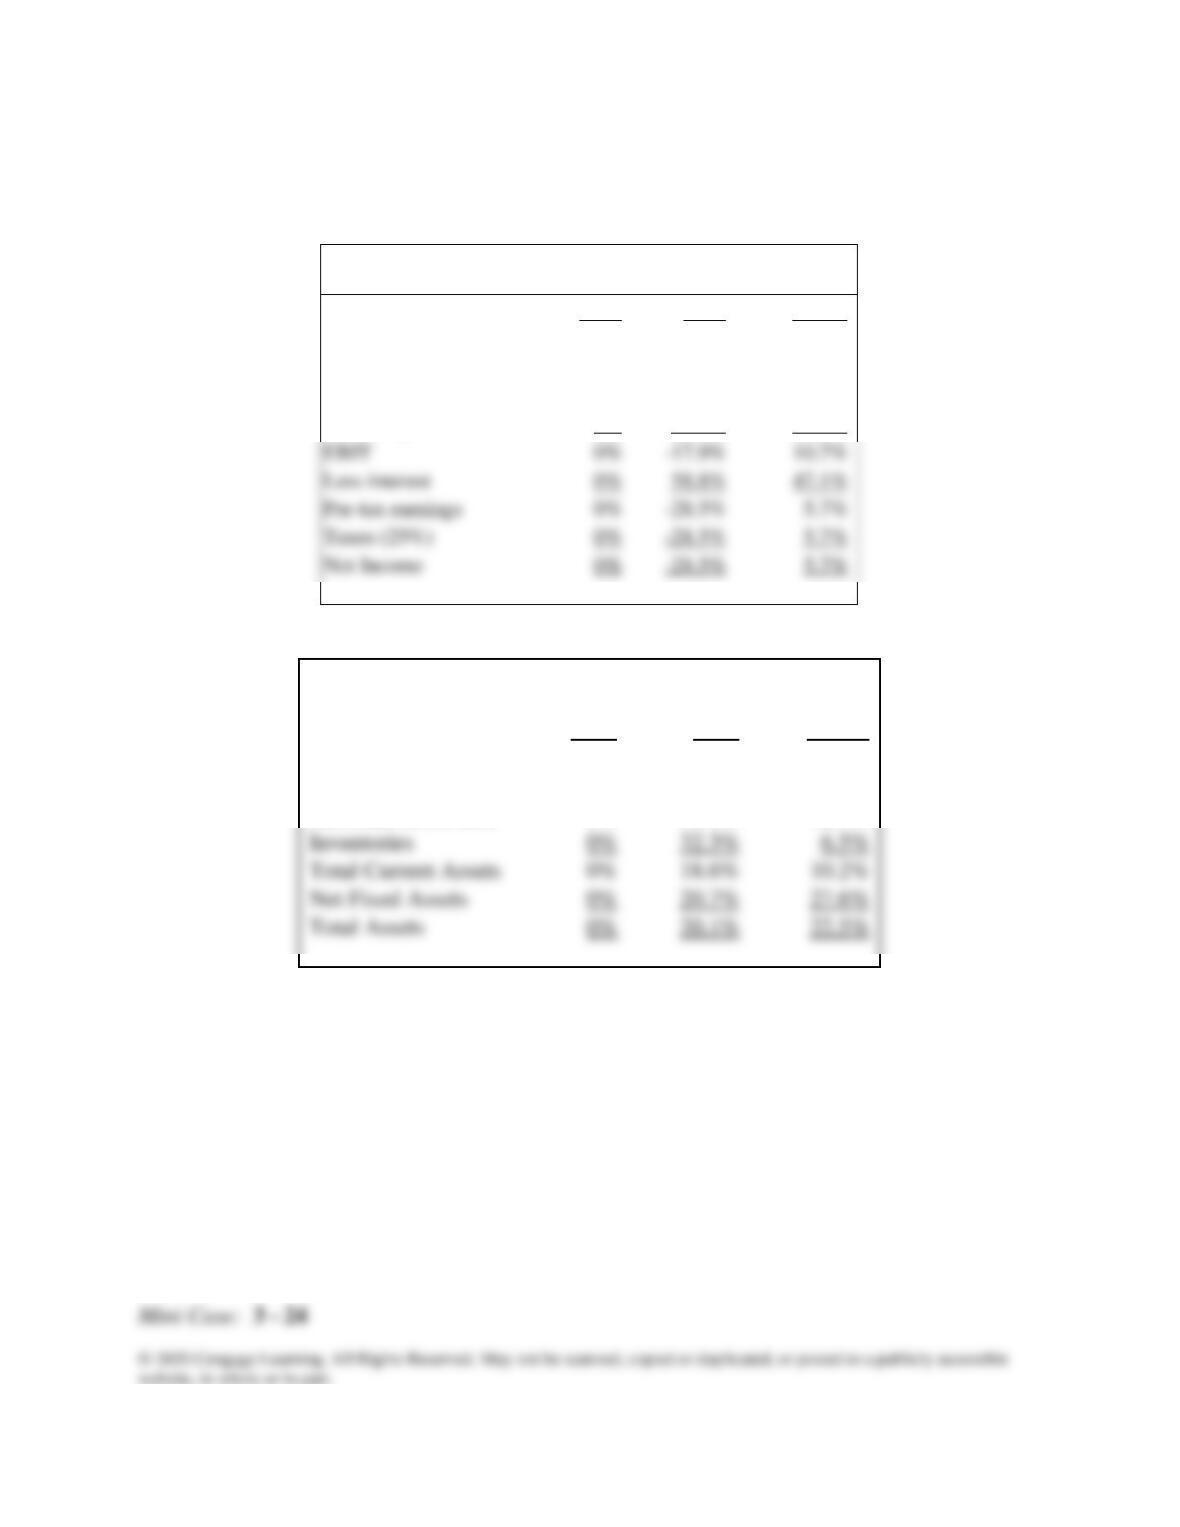
Percentage Change
Income Statements
2018
2019
2020E
Net sales
0%
9.1%
20.0%
Costs of Goods Sold
0%
11.6%
21.2%
Depreciation
0%
10.3%
27.6%
Other Expenses
0%
20.0%
14.3%
EBIT
0%
10.7%
Less interest
0%
58.8%
47.1%
Pre-tax earnings
0%
Taxes (25%)
0%
Net Income
0%
Percent Change
Balance Sheets
Assets
2018
2019
2020E
Cash and equivalents
0%
-16.7%
0.0%
Short-term investments
0%
-90.0%
-50.0%
Accounts receivable
0%
30.0%
32.5%
Inventories
0%
32.3%
6.5%
Total Current Assets
0%
18.6%
10.2%
Net Fixed Assets
0%
20.7%
27.6%
Total Assets
0%
20.1%
22.5%
Mini Case: 3 – 25
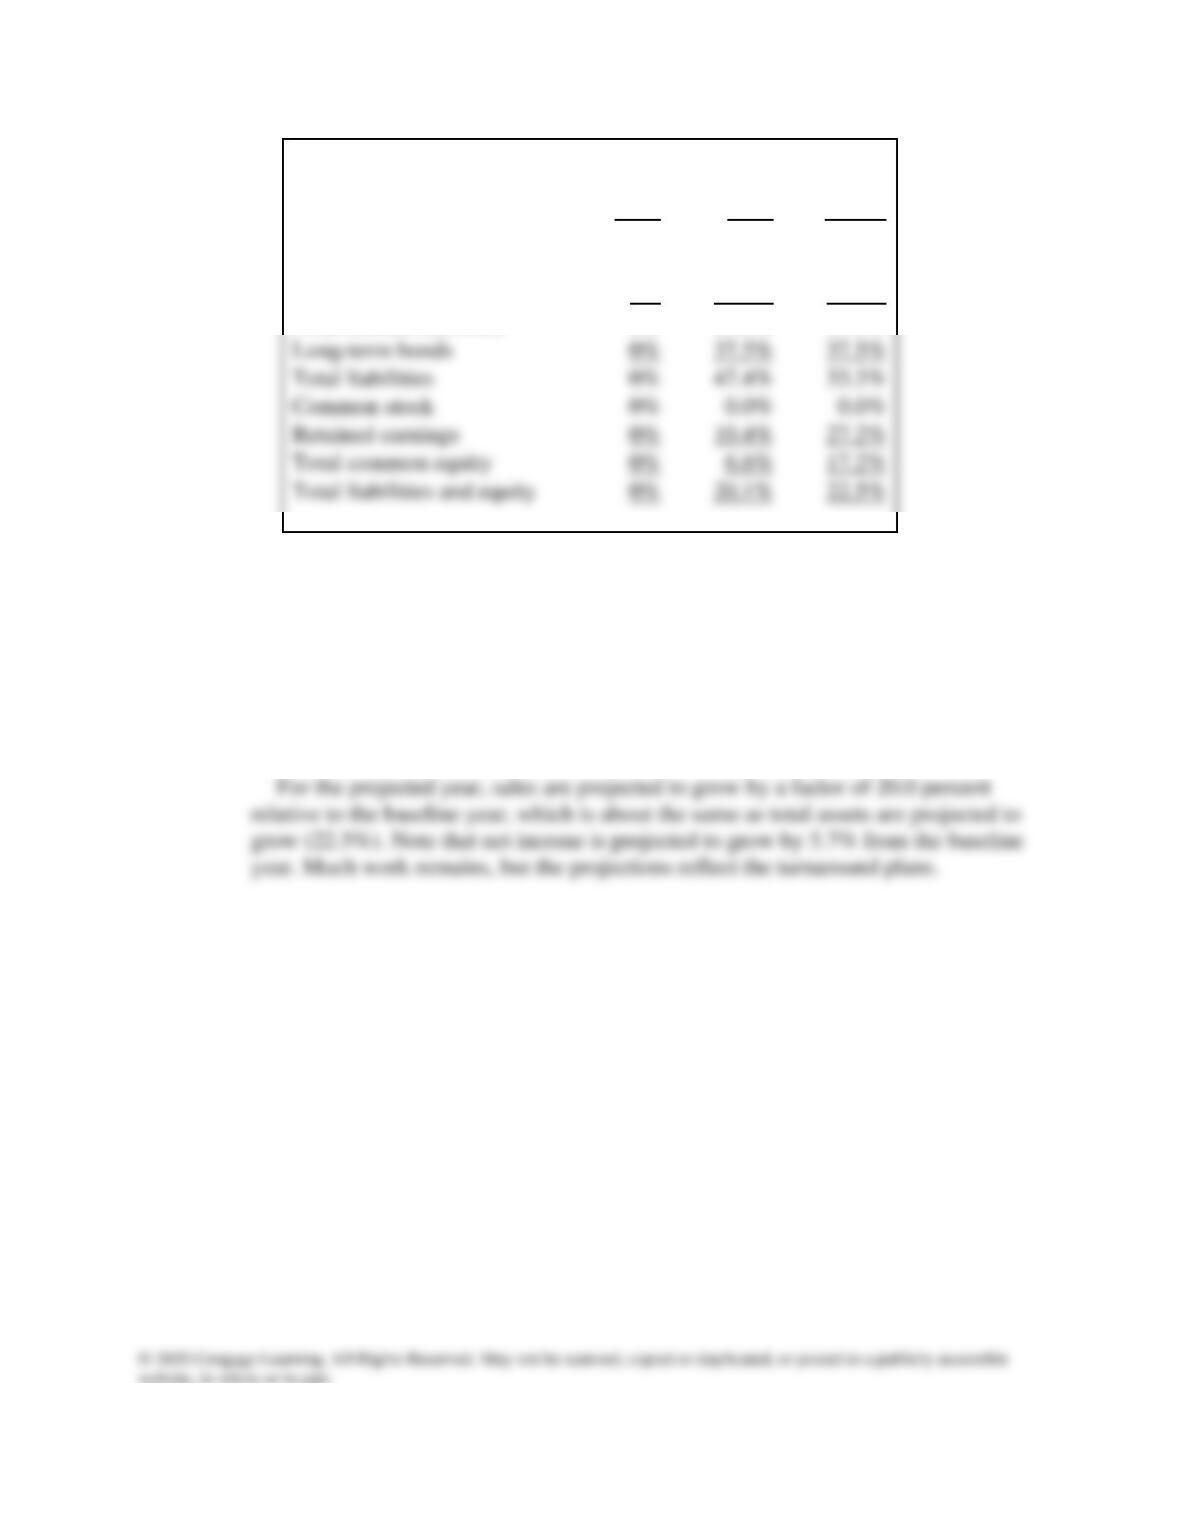
Percent Change Balance
Sheets
Liabilities and equity
2018
2019
2020E
Accounts payable
0%
33.3%
10.0%
Notes payable
0%
400.0%
100.0%
Accruals
0%
20.0%
35.0%
Total current liabilities
0%
61.8%
27.3%
Long-term bonds
0%
37.5%
37.5%
Total liabilities
0%
47.4%
33.3%
Common stock
0%
Retained earnings
0%
10.4%
27.2%
Total common equity
0%
17.2%
Total liabilities and equity
0%
20.1%
22.5%
We see that in the most recent year, total assets grew by 20.1% relative to the
baseline (with inventory growing by 32.3%). However, actual sales only grew by
9.1%, which indicates trouble, with unsold inventory causing much of the problem.
Other expenses also grew rapidly, causing a steep decline in net income (-28.5%).
Part of this decline is due to the 58.8% increase in interest expense.
Mini Case: 3 – 26
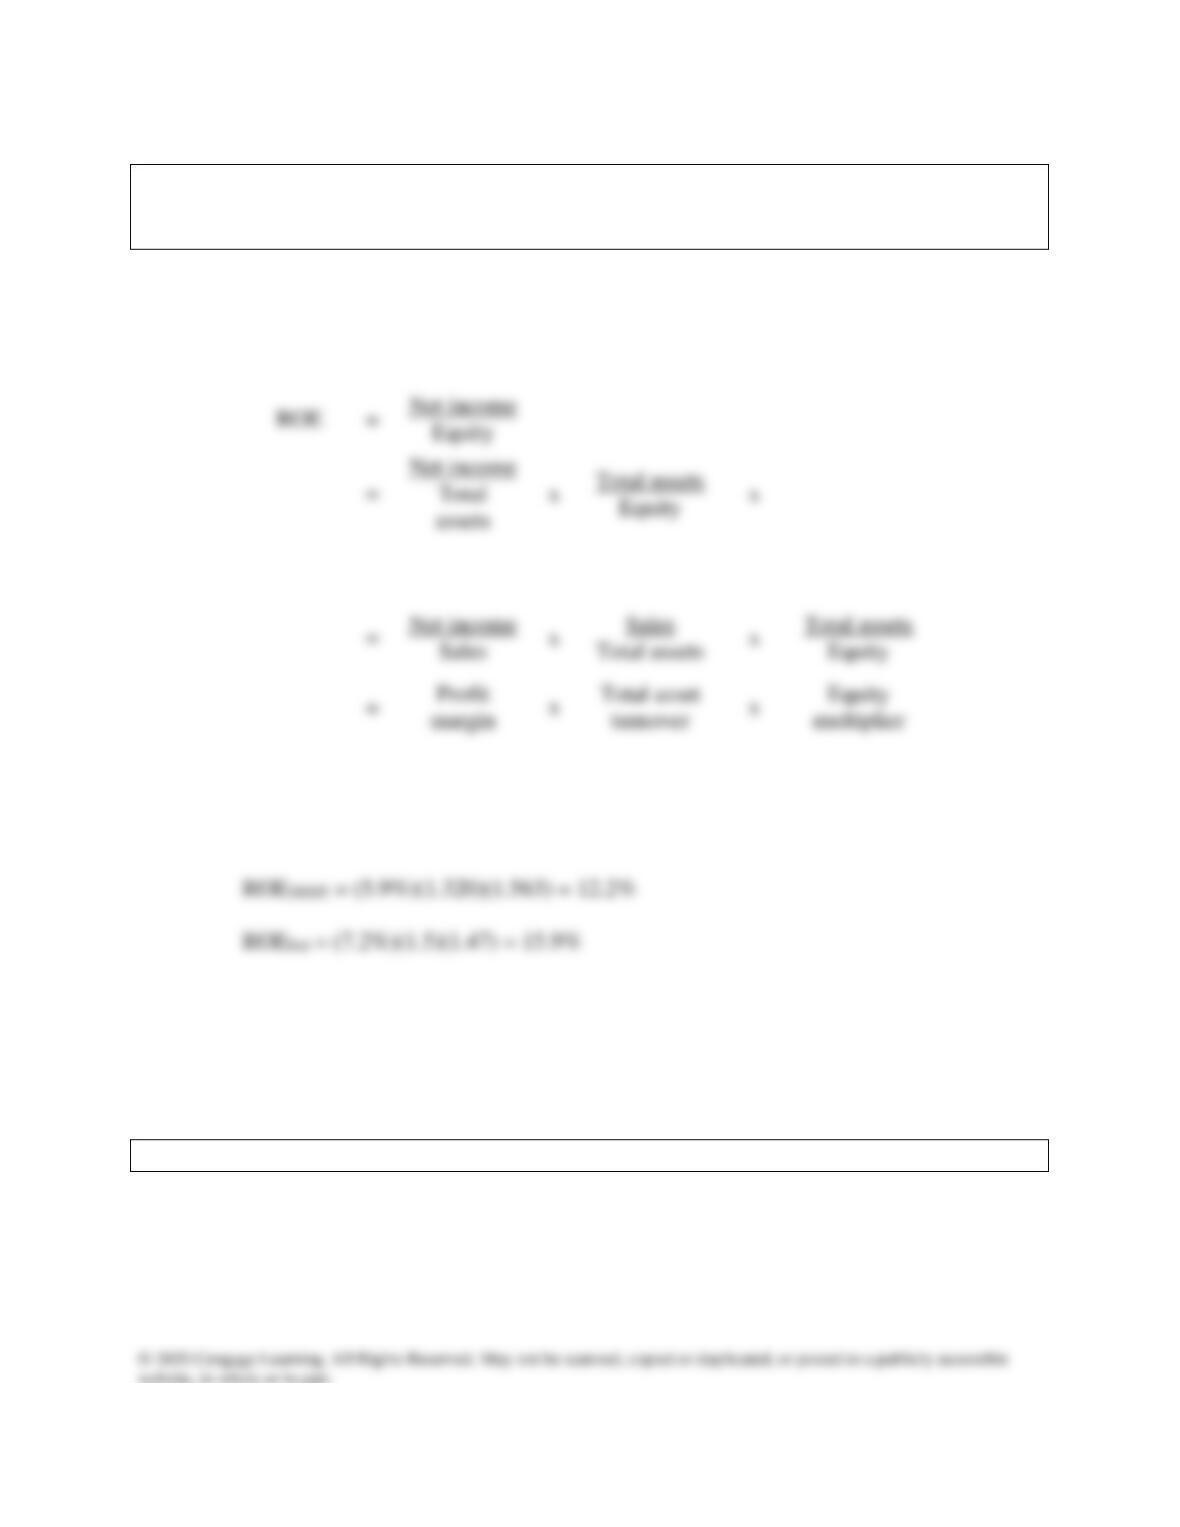
h. Use the extended DuPont equation to provide a breakdown of Computron’s
projected return on equity. How does the projection compare with the previous
years and with the industry’s DuPont equation?
Answer: DuPont Equation:
ROE =
Profit
Margin
Total Assets
Turnover
Equity
Multiplier
ROE2018 = (6.7%)(1.348)(1.495) = 13.5%
ROE2019 = (4.4%)(1.224)(1.684) = 9.1%
Computron’s profit margin and total assets turnover ratio were below the industry
average. It had a higher equity multiplier because it had more debt, which boosted its
ROE. Otherwise, its ROE would have been even lower than the industry ROE.
i. What are some potential problems and limitations of financial ratio analysis?
Answer: Some potential problems are listed below:
Mini Case: 3 – 27
1. Comparison with industry averages is difficult if the firm operates many different
divisions.
2. Different operating and accounting practices distort comparisons.
3. Sometimes hard to tell if a ratio is “good” or “bad.”
j. What are some qualitative factors analysts should consider when evaluating a
company’s likely future financial performance?
Answer: Top analysts recognize that certain qualitative factors must be considered when
evaluating a company. These factors, as summarized by the American Association Of
Individual Investors (AAII), are as follows:
1. Are the company’s revenues tied to one key customer?
2. To what extent are the company’s revenues tied to one key product?
3. To what extent does the company rely on a single supplier?