CHAPTER 3
RATIOS AND FINANCIAL PLANNING AT
EAST COAST YACHTS
1. The calculations for the ratios listed are:
Current ratio = $17,406,200/$22,754,600
Current ratio = .76 times
Quick ratio = ($17,406,200 – 7,290,100)/$22,754,600
Quick ratio = .44 times
Total asset turnover = $231,900,000/$129,035,500
Total asset turnover = 1.80 times
Inventory turnover = $170,157,000/$7,290,100
Inventory turnover = 23.34 times
Receivables turnover = $231,900,000/$6,501,900
Receivables turnover = 35.67 times
2. Regarding the liquidity ratios, East Coast Yachts’ current ratio is below the median industry ratio.
This implies the company has less liquidity than the industry in general. However, the current ratio
is above the lower quartile, so there are companies in the industry with lower liquidity than East Coast
Yachts. The company may have more predictable cash flows, or more access to short-term borrowing.
The turnover ratios are all higher than the industry median; in fact, all three turnover ratios are above
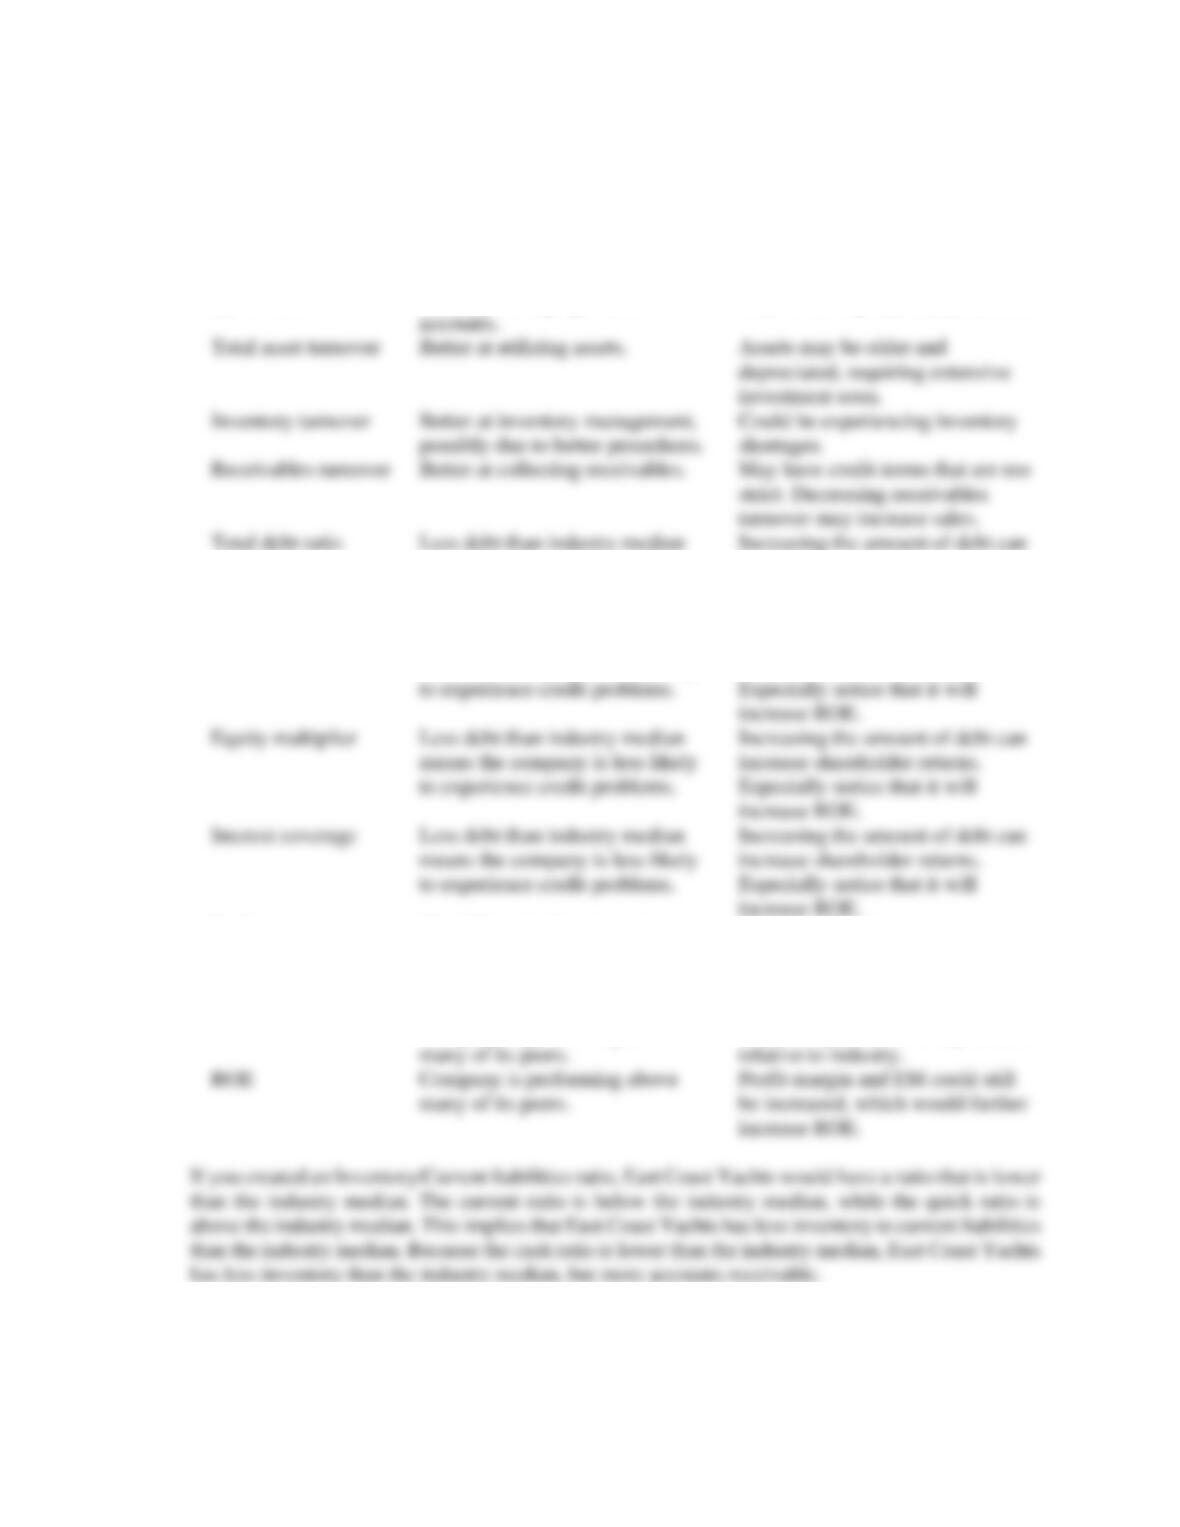
Below is a list of possible reasons it may be good or bad that each ratio is higher or lower than the
industry. Note that the list is not exhaustive, but merely one possible explanation for each ratio.
Ratio
Good
Bad
Current ratio
Better at managing current
accounts.
May be having liquidity problems.
Quick ratio
Better at managing current
May be having liquidity problems.
means the company is less likely
to experience credit problems.
increase shareholder returns.
Especially notice that it will
increase ROE.
Debt-equity ratio
to experience credit problems.
Especially notice that it will
increase ROE.
increase ROE.
means the company is less likely
to experience credit problems.
increase shareholder returns.
Especially notice that it will
increase ROE.
Less debt than industry median
means the company is less likely
Increasing the amount of debt can
increase shareholder returns.
Profit margin
The PM is slightly above the
industry median, so it is
performing better than many
peers.
May be able to better control
costs.
ROA
many of its peers.
relative to industry.
increase ROE.
Company is performing above
Assets may be old and depreciated
accounts.
depreciated, requiring extensive
investment soon.
Inventory turnover
Better at inventory management,
possibly due to better procedures.
Could be experiencing inventory
shortages.
strict. Decreasing receivables
turnover may increase sales.
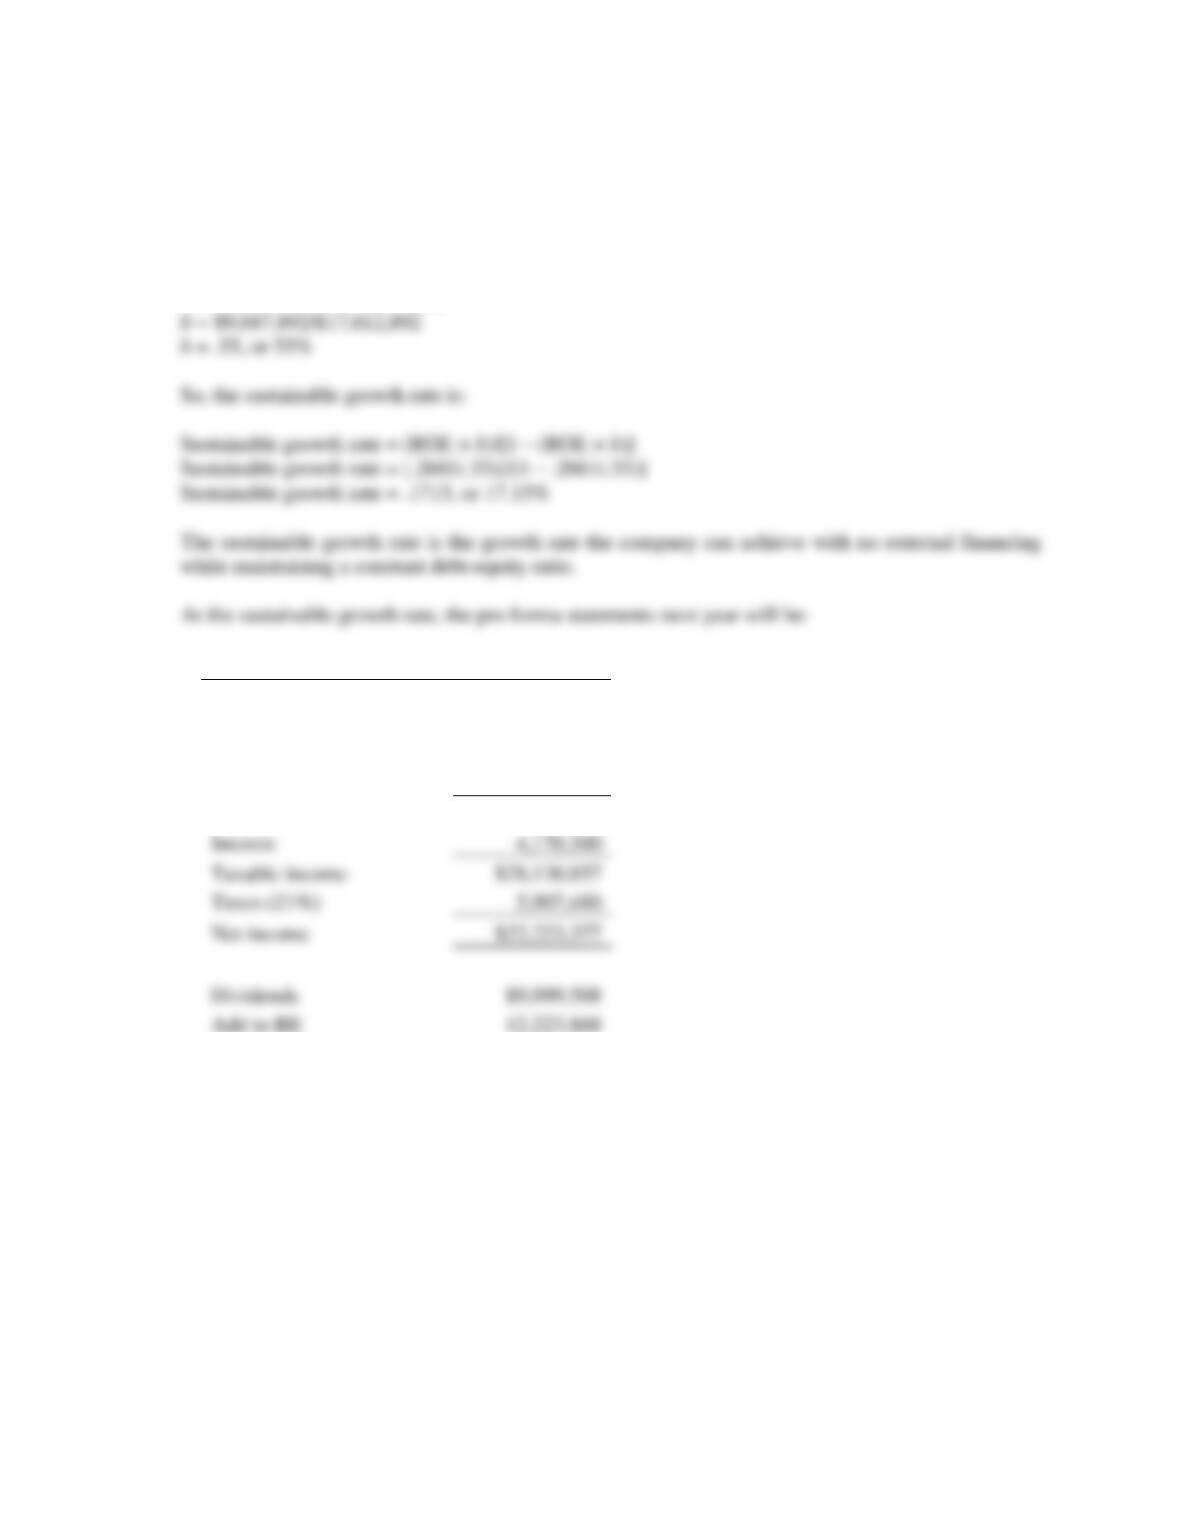
3. To calculate the sustainable growth rate, we first need to find the ROE and the retention ratio, so:
ROE = Net income/Total equity
ROE = $17,612,892/$66,180,900
ROE = .2661, or 26.61%
b = Addition to RE/Net income
Income statement
Sales
$271,668,145
COGS
199,336,941
Other expenses
32,463,348
Depreciation
7,566,900
EBIT
$32,300,957
Interest
4,170,100
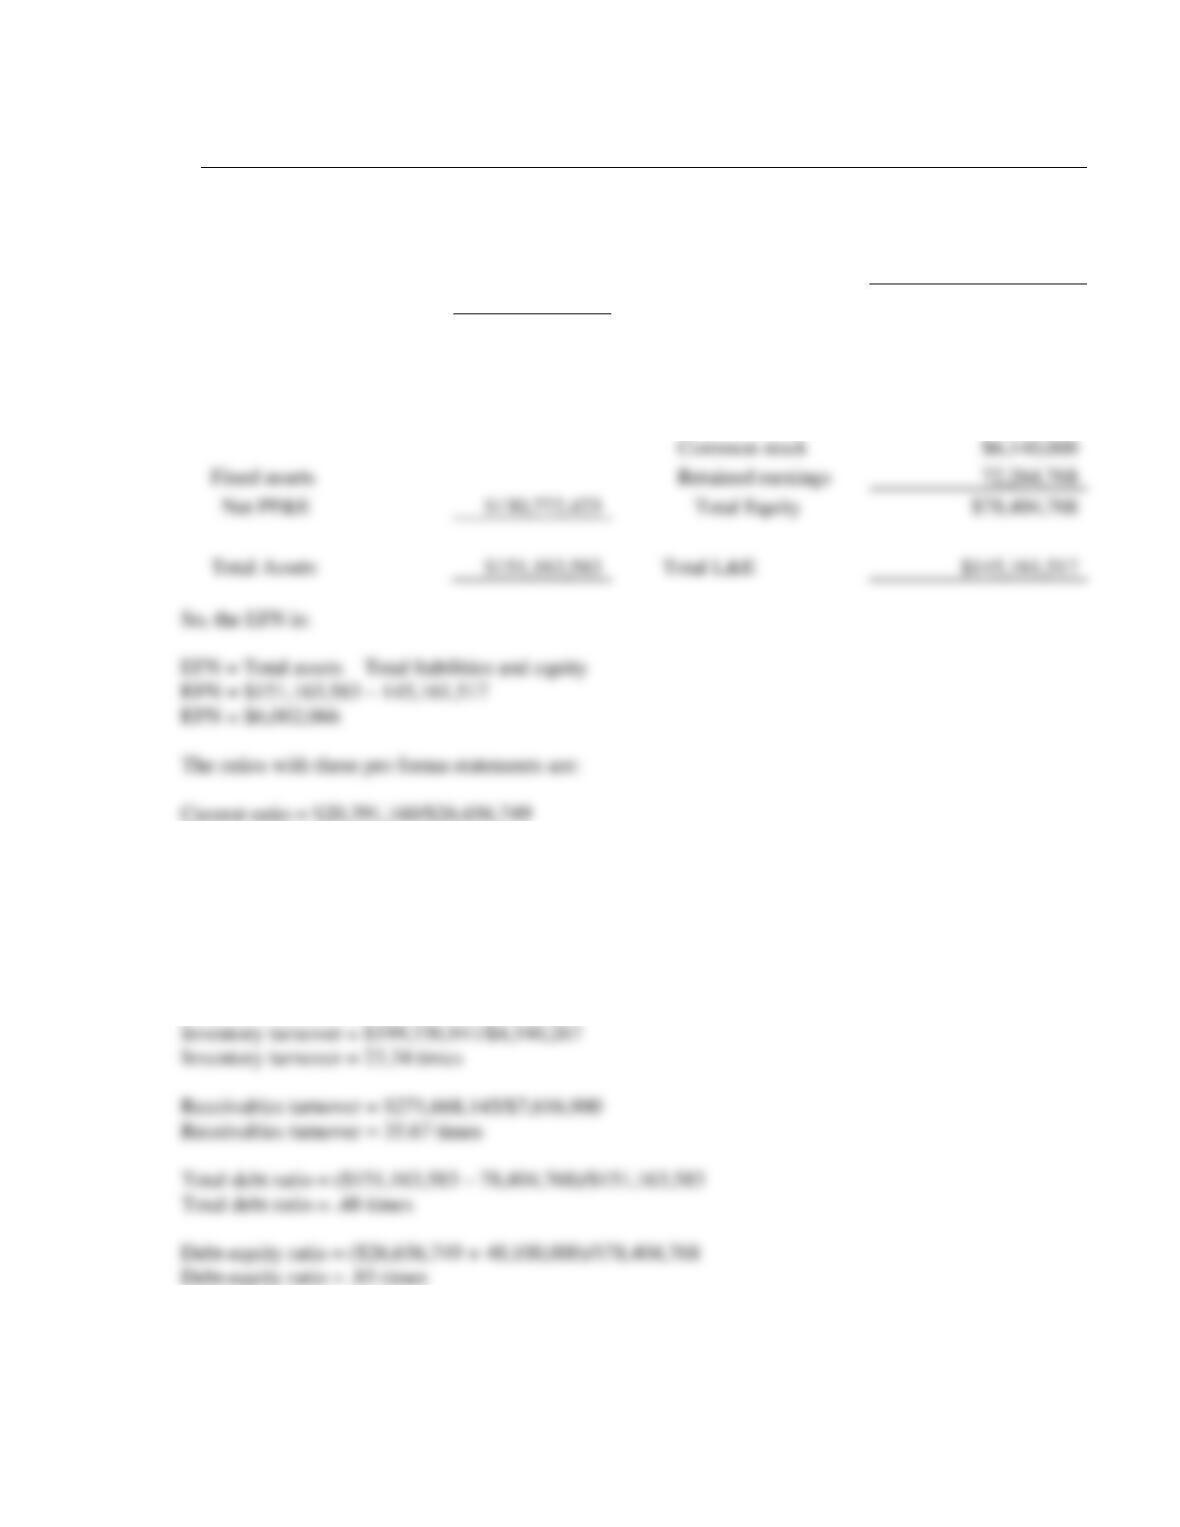
Balance sheet
Assets
Liabilities & Equity
Current Assets
Current Liabilities
Cash
$4,233,993
Accounts Payable
$8,174,294
Accounts rec.
7,616,900
Notes Payable
18,482,454
Inventory
8,540,267
Total CL
$26,656,749
Total CA
$20,391,160
Long-term debt
$40,100,000
Shareholder Equity
Current ratio = .76 times
Quick ratio = ($20,391,160 – 8,540,267)/$26,656,749
Quick ratio = .44 times
Total asset turnover = $271,668,145/$151,163,583
Total asset turnover = 1.80 times
Common stock
Net PP&E
Total Equity
$78,404,768
Total Assets
Total L&E
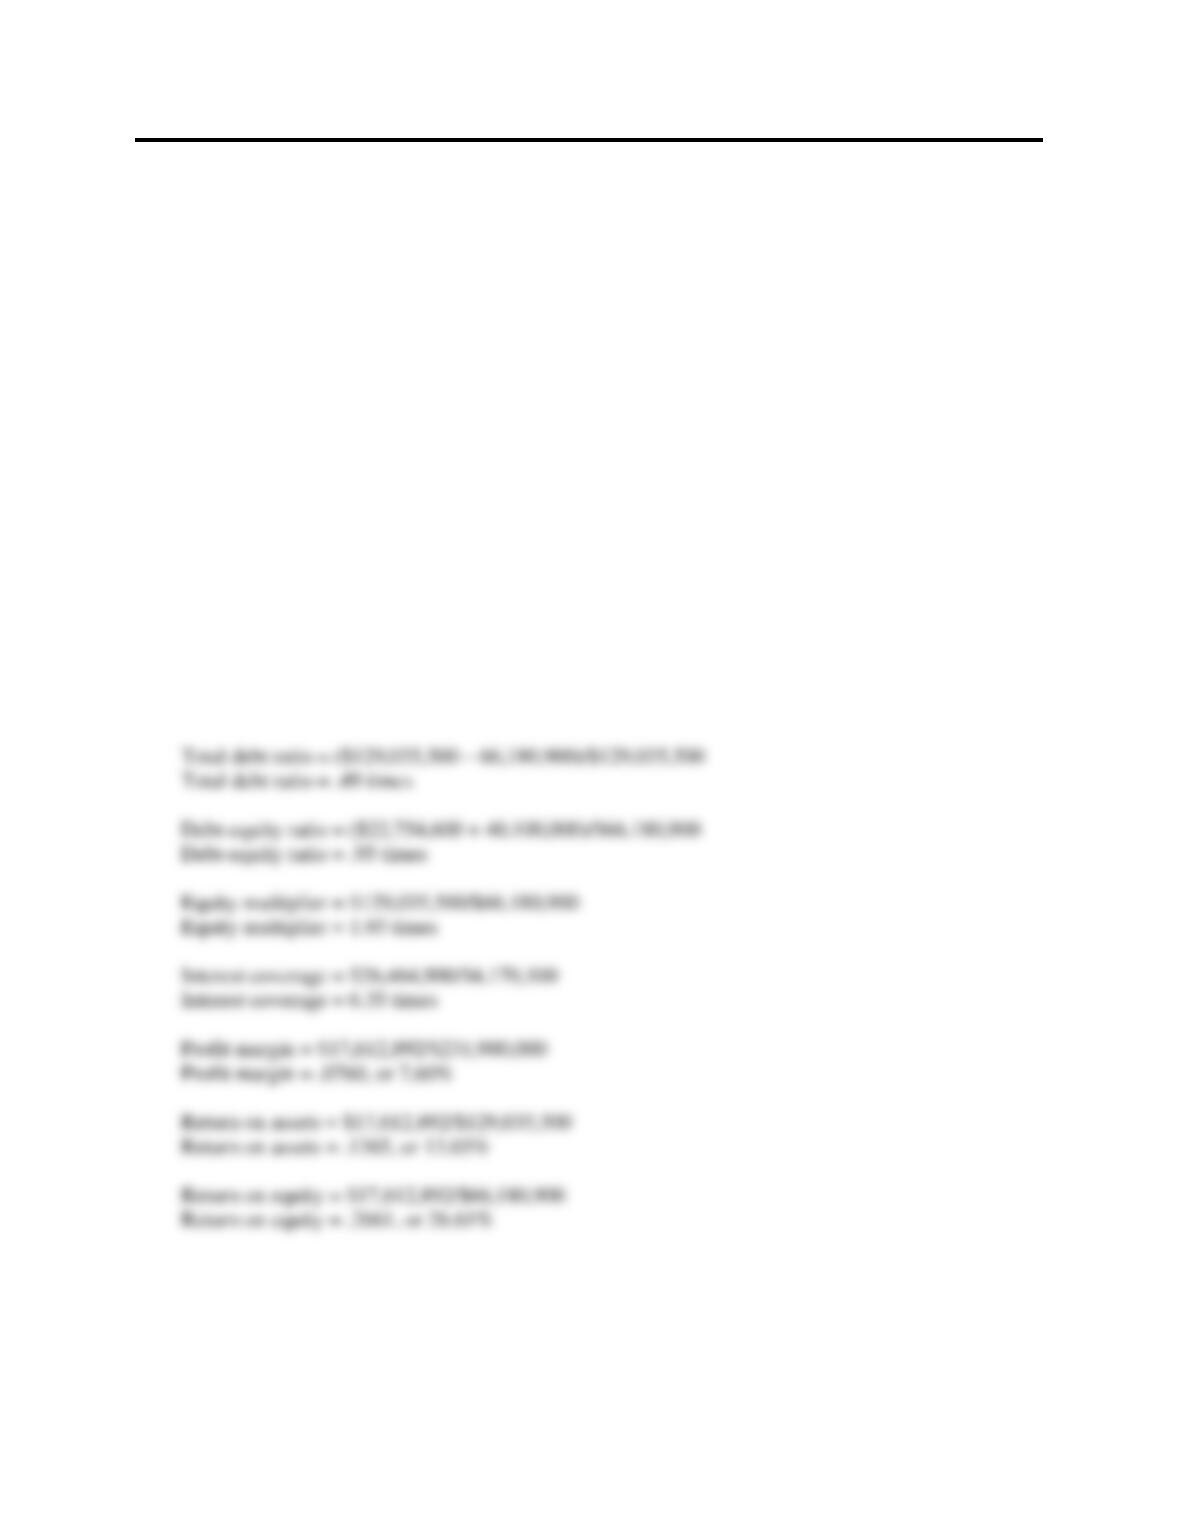
Interest coverage = $32,300,957/$4,170,100
Interest coverage = 7.75 times
Profit margin = $22,223,377/$271,668,145
Profit margin = .0818, or 8.18%
Return on assets = $22,223,377/$151,163,583
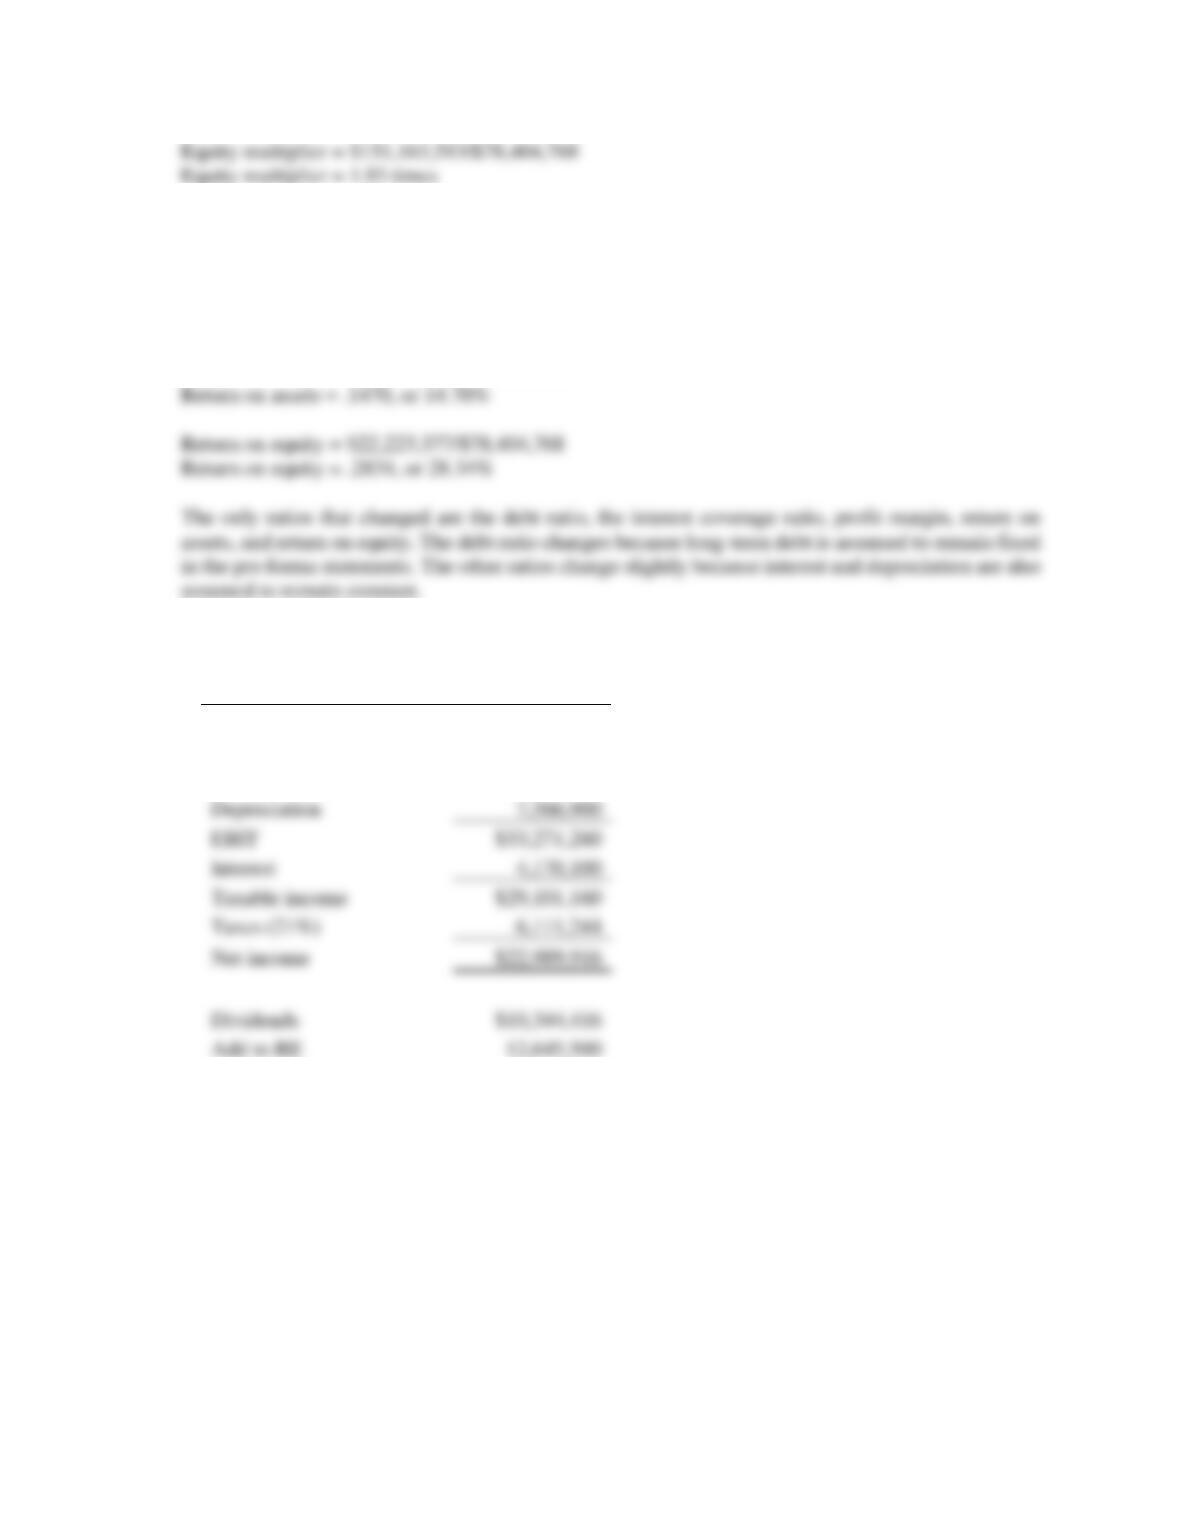
4. Pro forma financial statements for next year at a 20 percent growth rate are:
Income statement
Sales
$278,280,000
COGS
204,188,400
Other expenses
33,253,440
Depreciation
EBIT
$33,271,260
Interest
Taxable income
$29,101,160
Taxes (21%)
Balance sheet
Assets
Liabilities & Equity
Current Assets
Current Liabilities
Cash
$4,337,040
Accounts Payable
$8,373,240
Accounts rec.
7,802,280
Notes Payable
18,932,280
Inventory
8,748,120
Total CL
$27,305,520
Total CA
$20,887,440
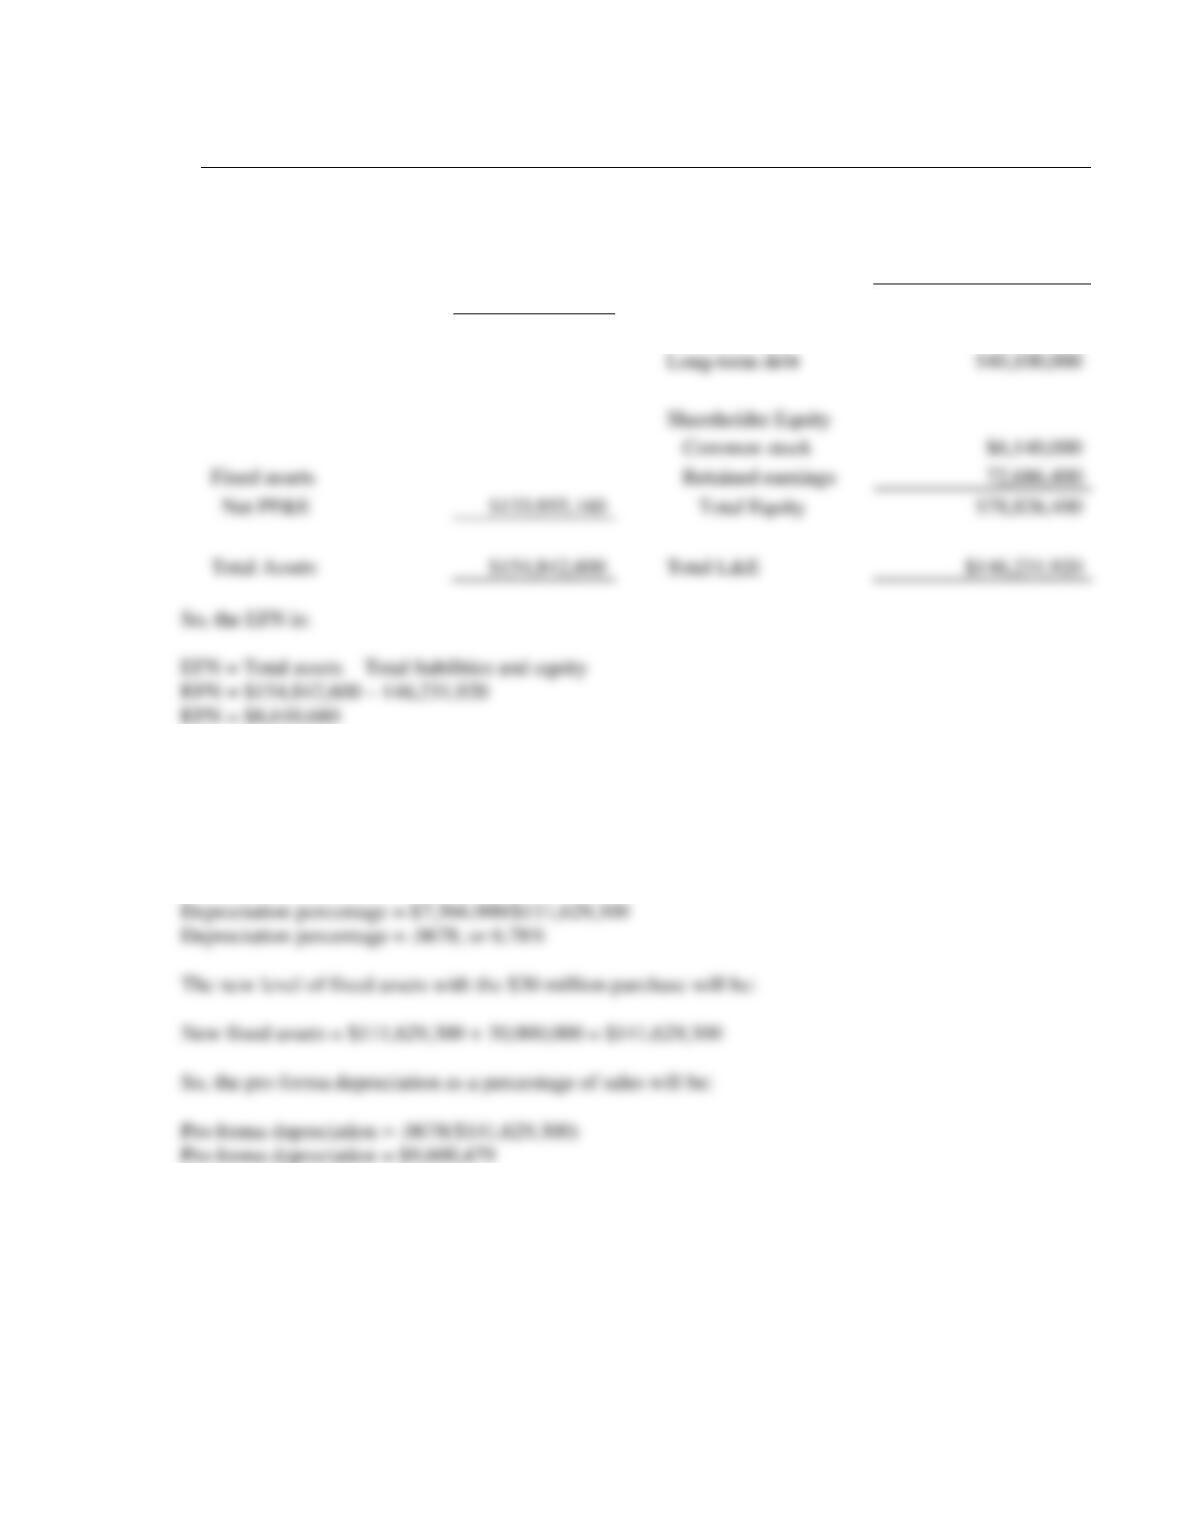
5. Now we are assuming the company can only build in amounts of $30 million. We will assume that the
company will go ahead with the fixed asset acquisition. In this case, the pro forma financial statement
calculation will change slightly. To estimate the new depreciation charge, we will find the current
depreciation as a percentage of fixed assets, then apply this percentage to the new fixed assets. The
depreciation as a percentage of assets this year was:
Long-term debt
Shareholder Equity
Common stock
Net PP&E
Total Equity
Total Assets
Total L&E
We will use this amount in the pro forma income statement. So, the pro forma income statement will
be:
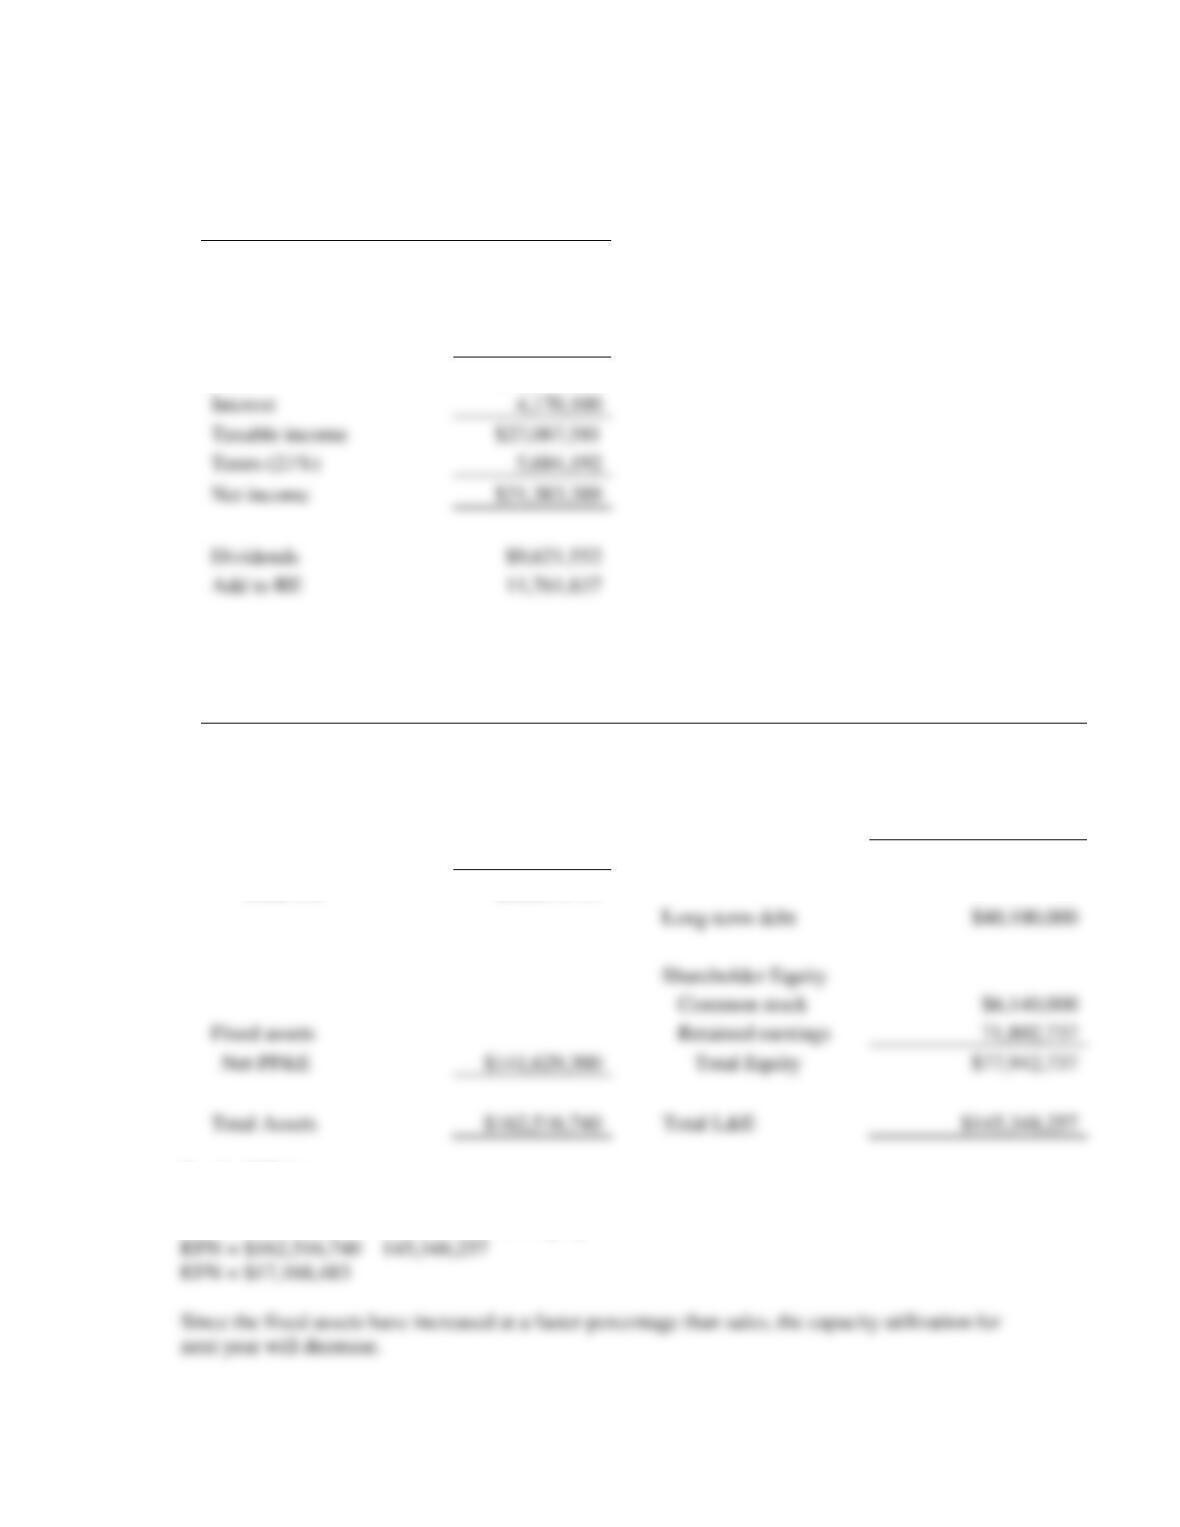
Income statement
Sales
$278,280,000
COGS
204,188,400
Other expenses
33,253,440
Depreciation
9,600,479
EBIT
$31,237,681
The pro forma balance sheet will remain the same except for the fixed asset and equity accounts. The
fixed asset account will increase by $30 million, rather than the growth rate of sales.
Balance sheet
Assets
Liabilities & Equity
Current Assets
Current Liabilities
Cash
$4,337,040
Accounts Payable
$8,373,240
Accounts rec.
7,802,280
Notes Payable
18,932,280
Inventory
8,748,120
Total CL
$27,305,520
Total CA
$20,887,440
Long-term debt
Shareholder Equity
Common stock
Fixed assets
Retained earnings
Net PP&E
Total Equity
Total Assets
Total L&E
EFN = Total assets – Total liabilities and equity
Interest
Taxable income
$27,067,581
Taxes (21%)
Net income
$21,383,389
Dividends
Add to RE