Build a Model Solution 11/26/2018
Chapter: 3
Problem: 15
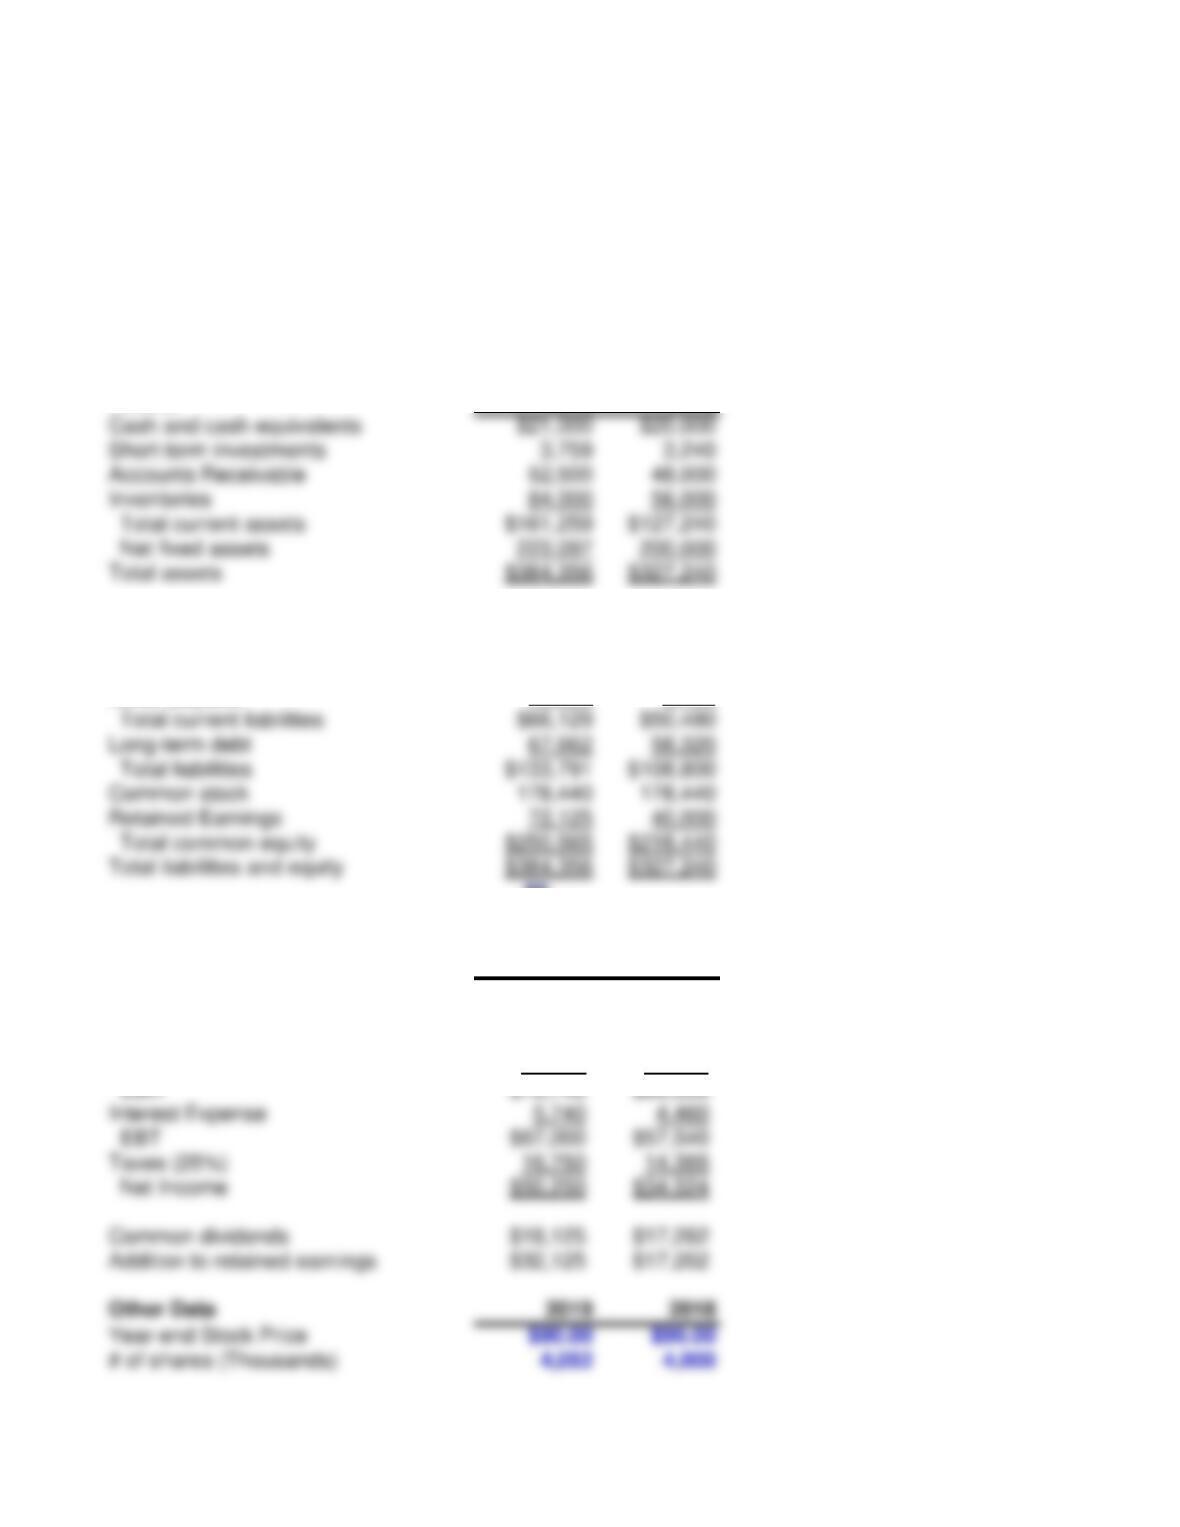
Joshua & White Technologies: December 31 Balance Sheets
(Thousands of Dollars)
Assets 2019 2018
Liabilities and equity
Accounts payable $33,600 $32,000
Accruals 12,600 12,000
Notes payable 19,929 6,480
Total current liabilities $66,129 $50,480
Long-term debt 67,662 58,320
Total liabilities $133,791 $108,800
Common stock 178,440 178,440
Retained Earnings 72,125 40,000
Total common equity $250,565 $218,440
Total liabilities and equity $384,356 $327,240
$0
Joshua & White Technologies December 31 Income Statements
(Thousands of Dollars)
2019 2018
Sales $420,000 $400,000
COGS except excluding depr. and amort.
300,000 298,000
Depreciation and Amortization 19,660 18,000
Other operating expenses 27,600 22,000
EBIT $72,740 $62,000
Interest Expense 5,740 4,460
EBT $67,000 $57,540
Taxes (25%) 16,750 14,385
Net Income $50,250 $34,524
Common dividends $18,125 $17,262
Addition to retained earnings $32,125 $17,262
Note to us: copy as values the balance sheets
and income statements when creating or
updating the problem file. An delete this not in
the problem file. Duh.
Cash and cash equivalents $21,000 $20,000
Short-term investments 3,759 3,240
Total current assets $161,259 $127,240
Net fixed assets 223,097 200,000
Total assets $384,356 $327,240
Lease payment (Thousands of Dollars)
$20,000 $20,000
Sinking fund payment (Thousands of Dollars)
$5,000 $5,000
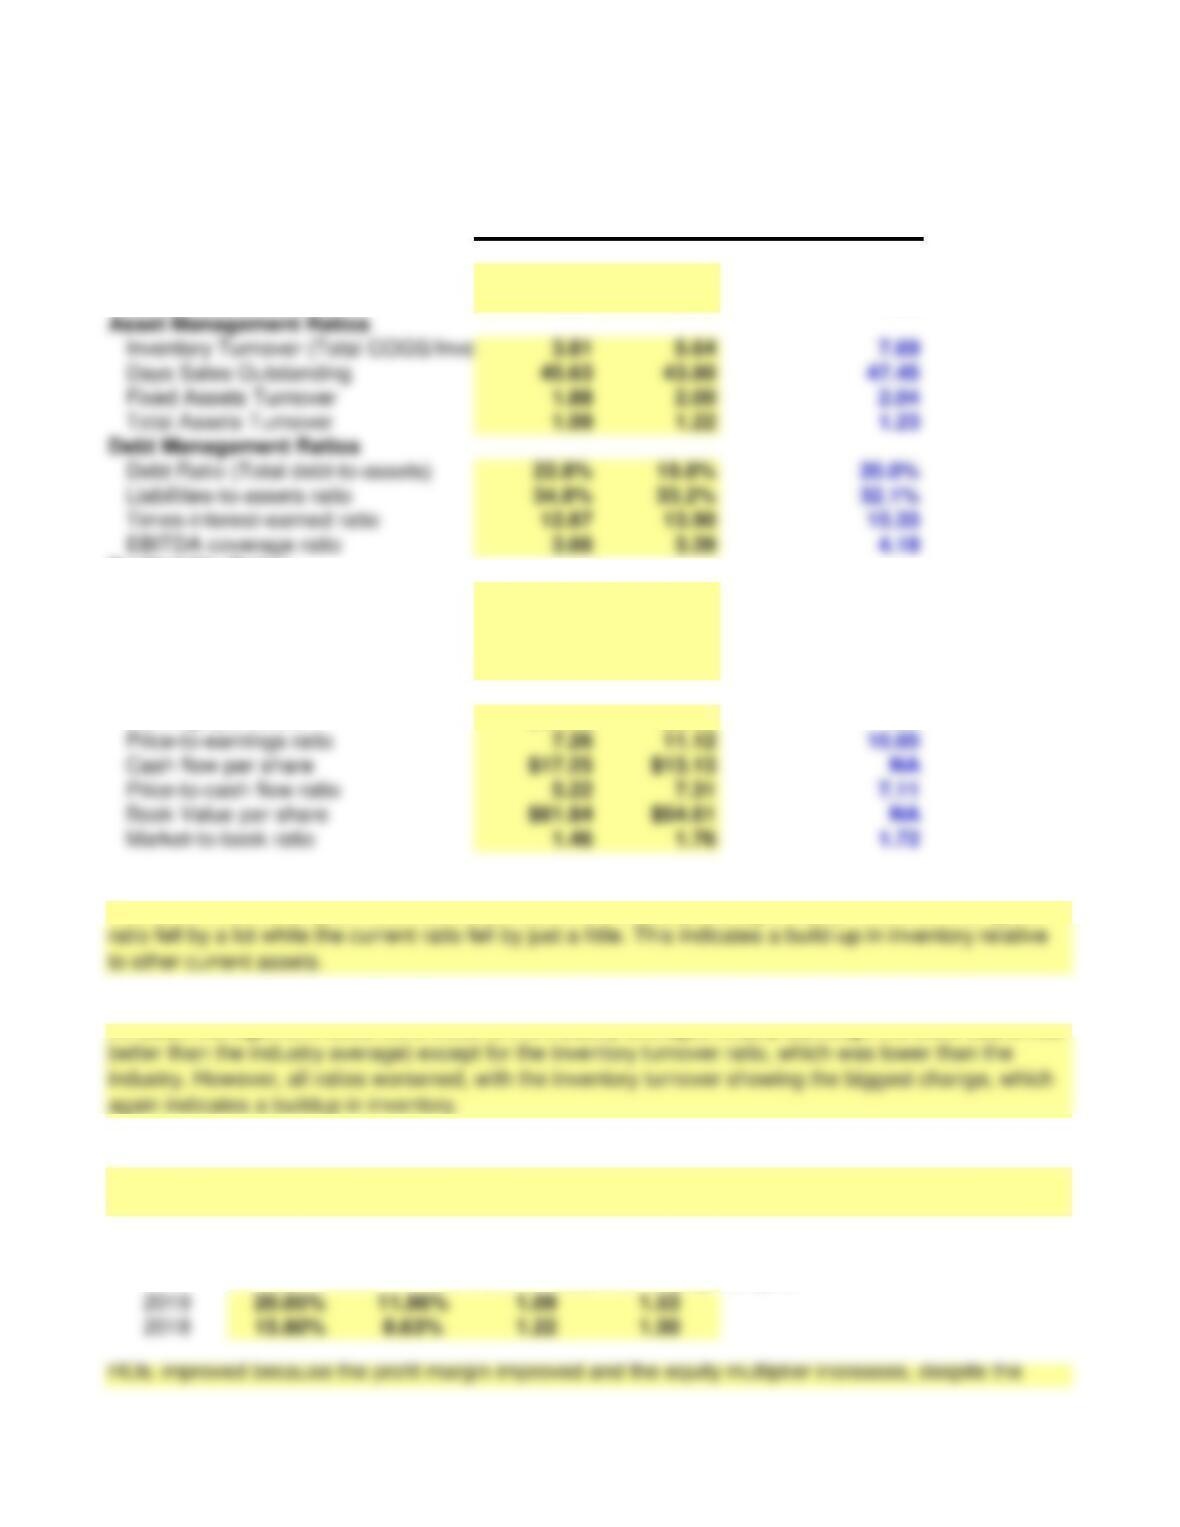
Ratio Analysis 2019 2018 Industry Avg
Liquidity Ratios
Current Ratio 2.44 2.52 2.58
Quick Ratio 1.17 1.41 1.53
Profitability Ratios
Profit Margin 11.96% 8.63% 8.86%
Basic Earning Power 18.93% 18.95% 19.48%
Return on Assets 13.07% 10.55% 10.93%
Return on Equity 20.05% 15.80% 16.10%
Market Value Ratios
Earnings per share $12.40 $8.63 NA
Price-to-earnings ratio 7.26 11.12 10.65
Cash flow per share $17.25 $13.13 NA
Price-to-cash flow ratio 5.22 7.31 7.11
Book Value per share $61.84 $54.61 NA
Market-to-book ratio 1.46 1.76 1.72
a. Has Joshua & White’s liquidity position improved or worsened? Explain.
b. Has Joshua & White’s ability to manage its assets improved or worsened? Explain.
c. How has Joshua & White’s profitability changed during the last year?
d. Perform an extended Du Pont analysis for Joshua & White for each year.
ROE =
PM x
TA Turnover x Equity Multiplier
less efficient.
ratio fell by a lot while the current ratio fell by just a little. This indicates a build-up in inventory relative
The current ratio and quick ratio were a little below the industry average initially. However, the quick
better than the industry average) except for the inventory turnover ratio, which was lower than the
industry. However, all ratios worsened, with the inventory turnover showing the biggest change, which
All asset management ratios were close to the industry averages initially (although the DSO was a little
All profit margins improved except for basic earning power. The other ratios are better than the industry
averages.
Asset Management Ratios
Inventory Turnover (Total COGS/Inventories)
Days Sales Outstanding 45.63 43.80 47.45
Fixed Assets Turnover 1.88 2.00 2.04
Total Assets Turnover 1.09 1.22 1.23
Debt Management Ratios
Debt Ratio (Total debt-to-assets) 22.8% 19.8% 20.0%
Liabilities-to-assets ratio 34.8% 33.2% 32.1%
Times-interest-earned ratio 12.67 13.90 15.33
EBITDA coverage ratio 3.66 3.39 4.18
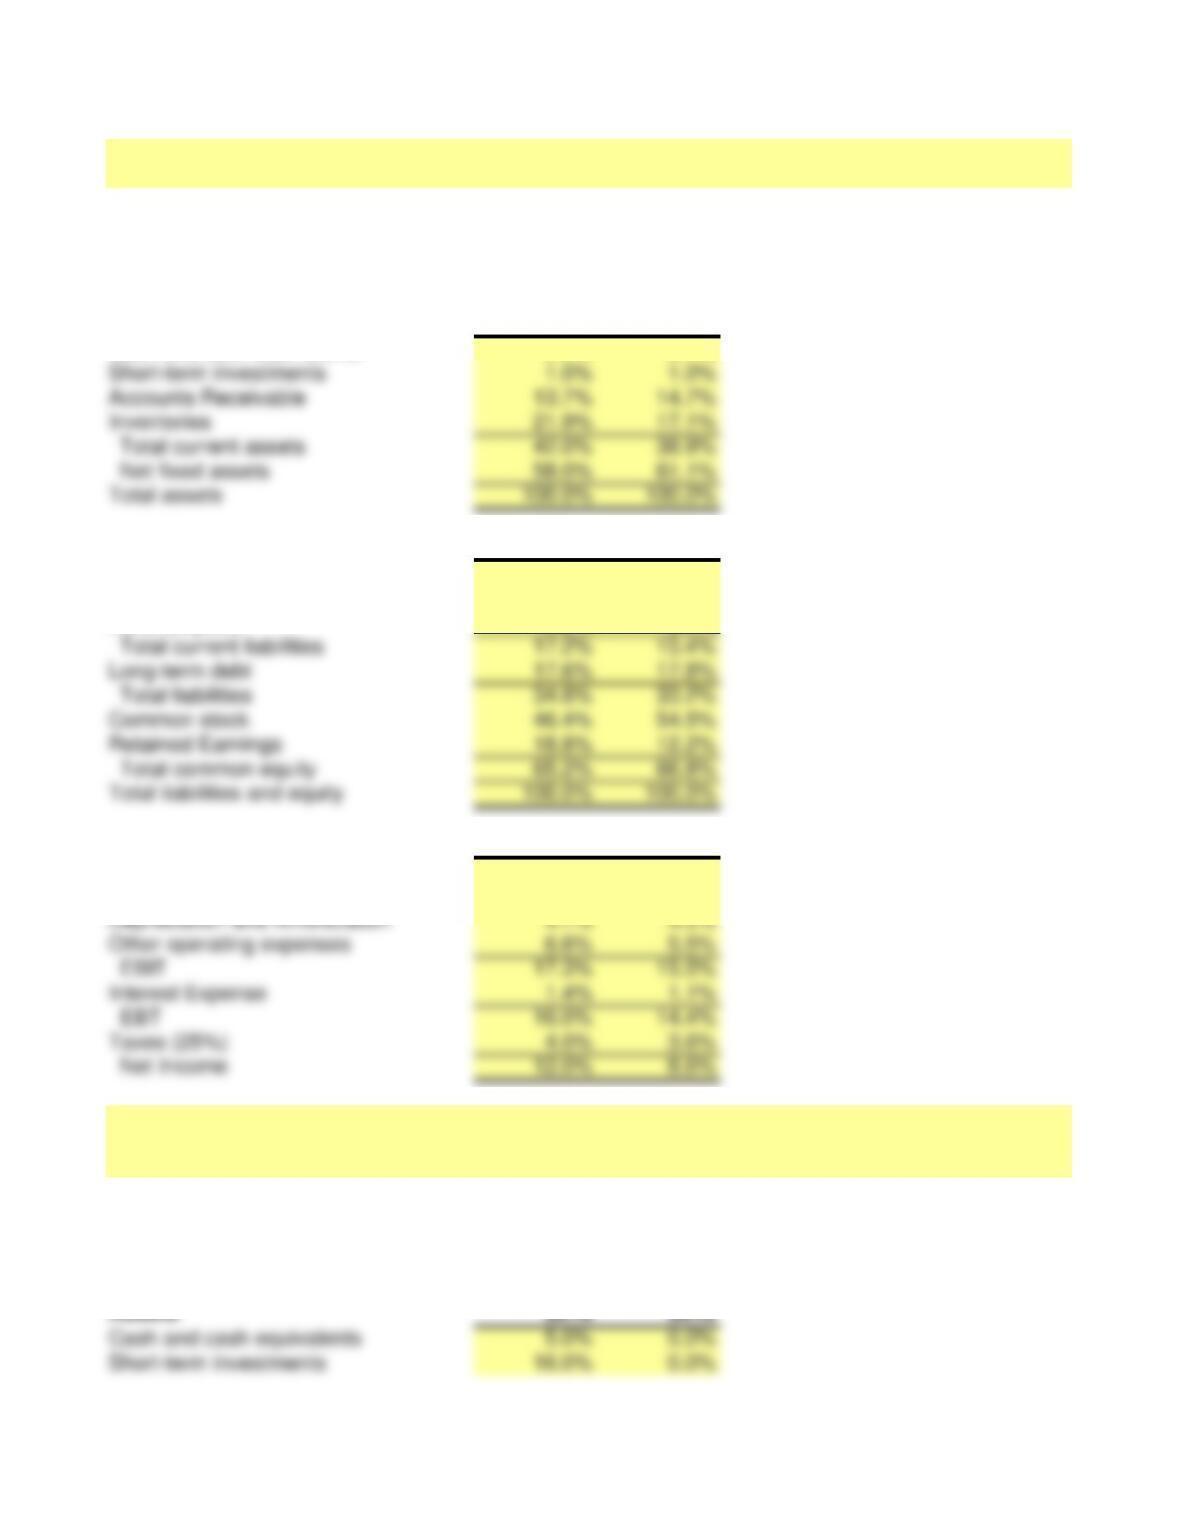
e. Perform a common size analysis. What has happened to the composition
(that is, percentage in each category) of assets and liabilities?
Common Size Balance Sheets
Assets 2019 2018
Cash and cash equivalents 5.5% 6.1%
Liabilities and equity 2019 2018
Accounts payable 8.7% 9.8%
Accruals 3.3% 3.7%
Notes payable 5.2% 2.0%
Total current liabilities 17.2% 15.4%
Total liabilities 34.8% 33.2%
Common stock 46.4% 54.5%
Retained Earnings 18.8% 12.2%
Total common equity 65.2% 66.8%
Common Size Income Statements 2019 2018
Sales 100.0% 100.0%
COGS except excluding depr. and amort.
71.4% 74.5%
Depreciation and Amortization 4.7% 4.5%
Other operating expenses 6.6% 5.5%
EBIT 17.3% 15.5%
Interest Expense 1.4% 1.1%
EBT 16.0% 14.4%
Taxes (25%) 4.0% 3.6%
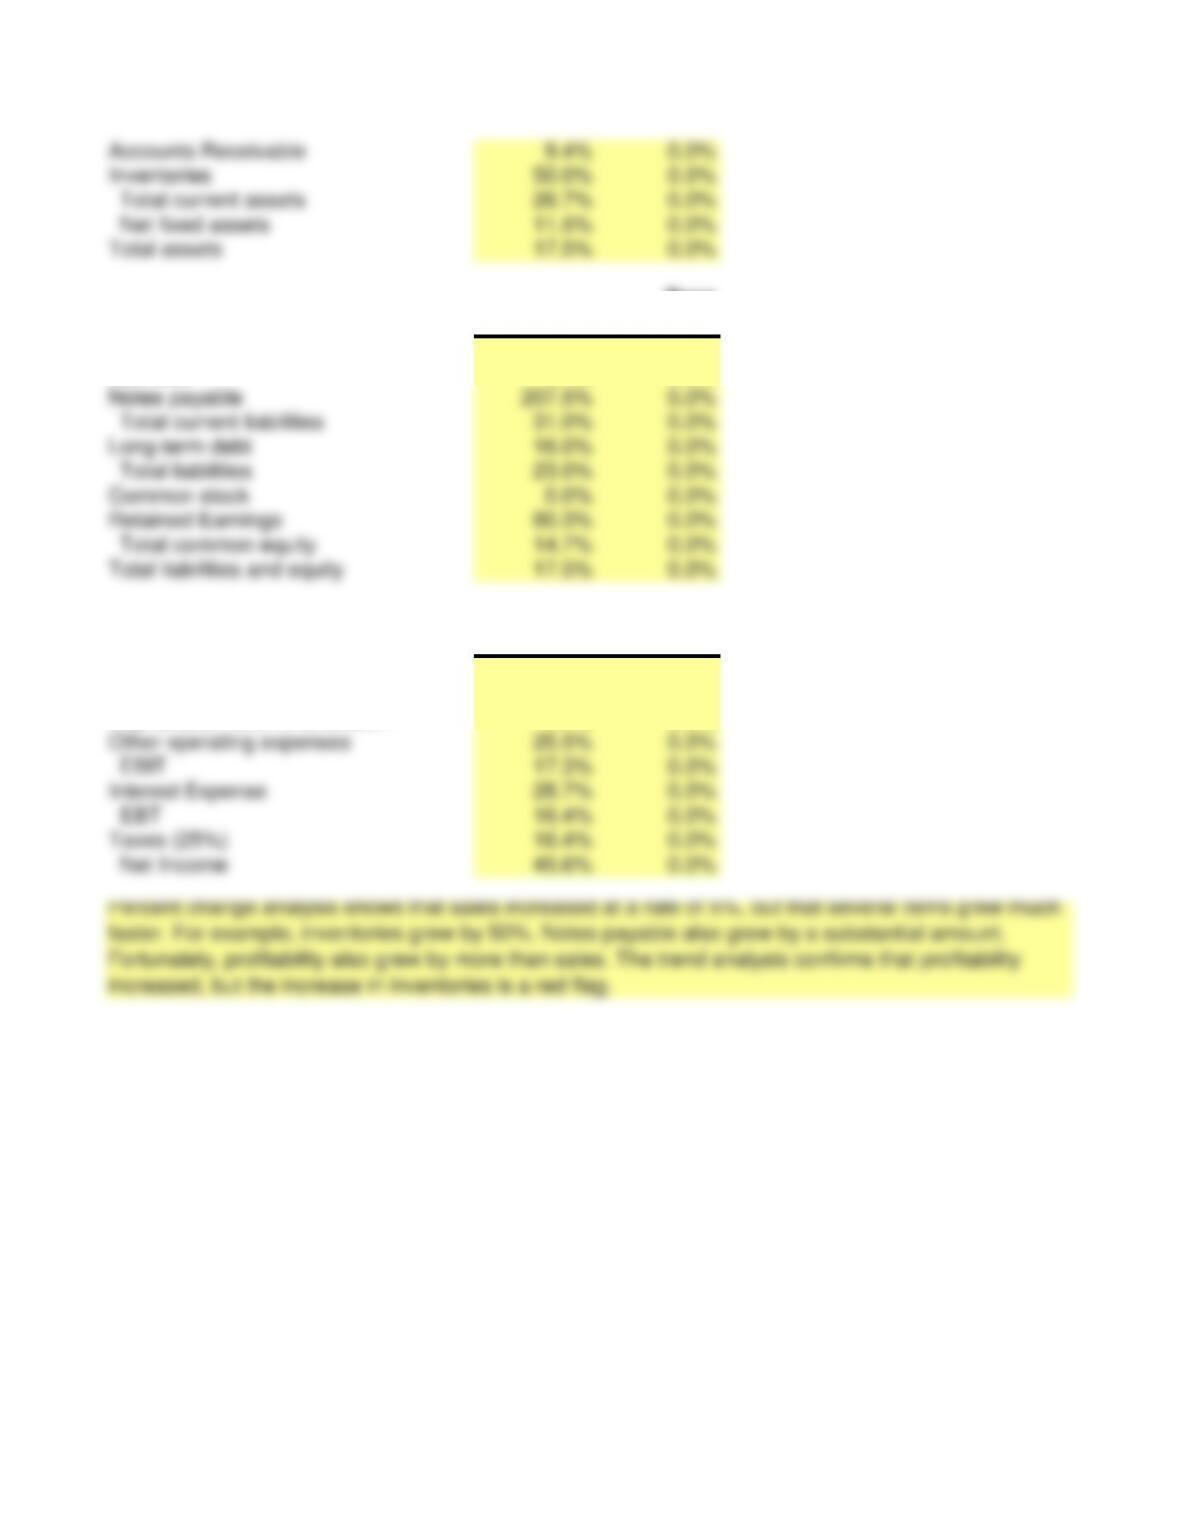
f. Perform a percent change analysis. What does this tell you about the change in profitability
and asset utilization?
Percent Change Balance Sheets Base
Assets 2019 2018
Cash and cash equivalents 5.0% 0.0%
Short-term investments 16.0% 0.0%
ROE improved because the profit margin improved and the equity multiplier increases, despite the
reduction in the total asset turnover ratio. Thus, J&W became more profitable, more leveraged, but
less efficient.
Common size analysis shows that inventories now make up a greater proportion of assets. The
combined long-term debt and notes payable make up a greater proportion of liabilities & equity. Profits
margins have gone up (even though interest expense has also gone up).
Short-term investments 1.0% 1.0%
Accounts Receivable 13.7% 14.7%
Total current assets 42.0% 38.9%
Net fixed assets 58.0% 61.1%
Base
Liabilities and equity 2019 2018
Accounts payable 5.0% 0.0%
Accruals 5.0% 0.0%
Total current liabilities 31.0% 0.0%
Total liabilities 23.0% 0.0%
Common stock 0.0% 0.0%
Retained Earnings 80.3% 0.0%
Total common equity 14.7% 0.0%
Total liabilities and equity 17.5% 0.0%
Base
Percent Change Income Statements 2019 2018
Sales 5.0% 0.0%
COGS except excluding depr. and amort.
0.7% 0.0%
Depreciation and Amortization 9.2% 0.0%
Other operating expenses 25.5% 0.0%
EBIT 17.3% 0.0%
Interest Expense 28.7% 0.0%
EBT 16.4% 0.0%
Taxes (25%) 16.4% 0.0%
Net Income 45.6% 0.0%
Total current assets 26.7% 0.0%
Net fixed assets 11.5% 0.0%
Total assets 17.5% 0.0%