CHAPTER 3
LONG-TERM FINANCIAL PLANNING
AND GROWTH
Answers to Concepts Review and Critical Thinking Questions
1. Time trend analysis gives a picture of changes in the company’s financial situation over time.
Comparing a firm to itself over time allows the financial manager to evaluate whether some aspects
of the firm’s operations, finances, or investment activities have changed. Peer group analysis involves
comparing the financial ratios and operating performance of a particular firm to a set of peer group
2. If a company is growing by opening new stores, then presumably total revenues would be rising.
3. The reason is that, ultimately, sales are the driving force behind a business. A firm’s assets, employees,
4. Two assumptions of the sustainable growth formula are that the company does not want to sell new
equity, and that financial policy is fixed. If the company raises outside equity, or increases its debt-
5. The sustainable growth rate is greater than 20 percent, because at a 20 percent growth rate the negative
EFN indicates that there is excess financing still available. If the firm is 100 percent equity financed,
then the sustainable and internal growth rates are equal and the internal growth rate would be greater
6. Common-size financial statements provide the financial manager with a ratio analysis of the company.
The common-size income statement can show, for example, that cost of goods sold as a percentage of
8. ROE is a better measure of the company’s performance. ROE shows the percentage return earned on
9. The EBITD/Assets ratio shows the company’s operating performance before interest, taxes, and
depreciation. This ratio would show how a company has controlled costs. While taxes are a cost, and
10. Long-term liabilities and equity are investments made by investors in the company, either in the form
of a loan or ownership. Return on investment is intended to measure the return the company earned
11. Presumably not, but, of course, if the product had been much less popular, then a similar fate would
have awaited due to lack of sales.
12. Since customers did not pay until shipment, receivables rose. The firm’s NWC, but not its cash,
13. Financing possibly could have been arranged if the company had taken quick enough action.
14. All three were important, but the lack of cash or, more generally, financial resources, ultimately spelled
15. Demanding cash up front, increasing prices, subcontracting production, and improving financial
Solutions to Questions and Problems
NOTE: All end-of-chapter problems were solved using a spreadsheet. Many problems require multiple
steps. Due to space and readability constraints, when these intermediate steps are included in this solutions
manual, rounding may appear to have occurred. However, the final answer for each problem is found
without rounding during any step in the problem.
Basic
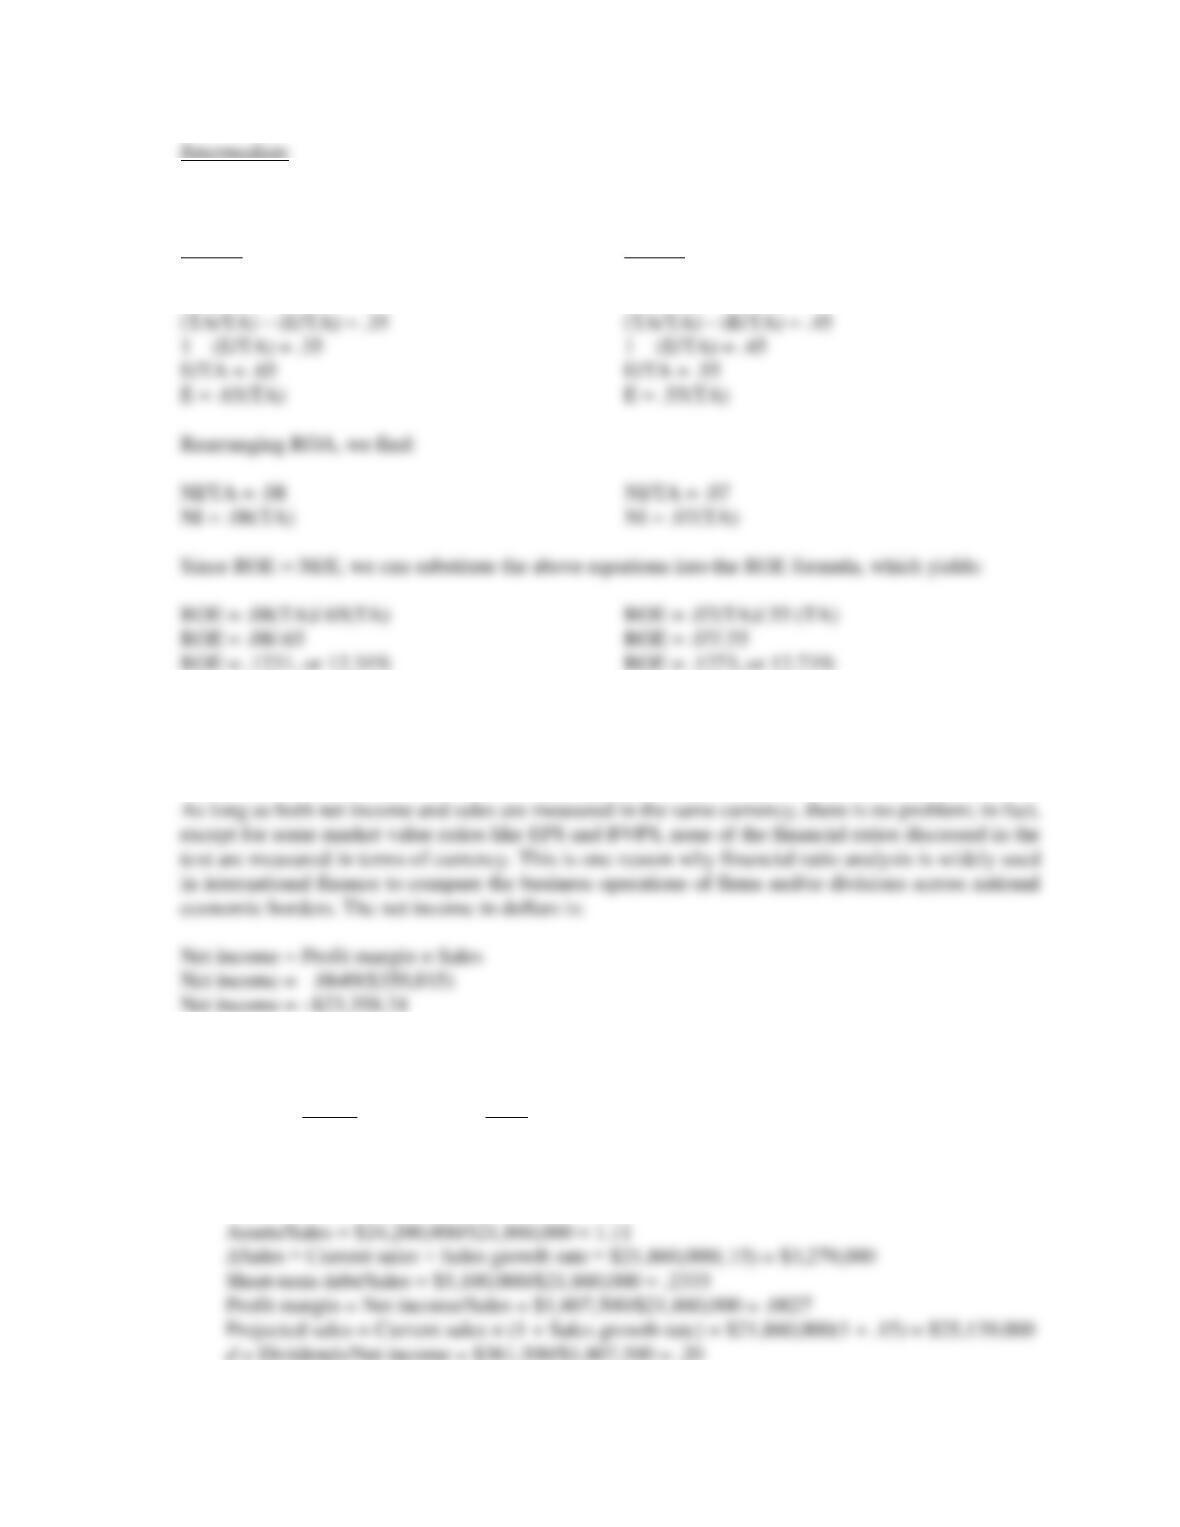
1. Using the DuPont identity, the ROE is:
2. The equity multiplier is:
Equity multiplier = 1 + D/E
Equity multiplier = 1 + .85
Equity multiplier = 1.85
One formula to calculate return on equity is:
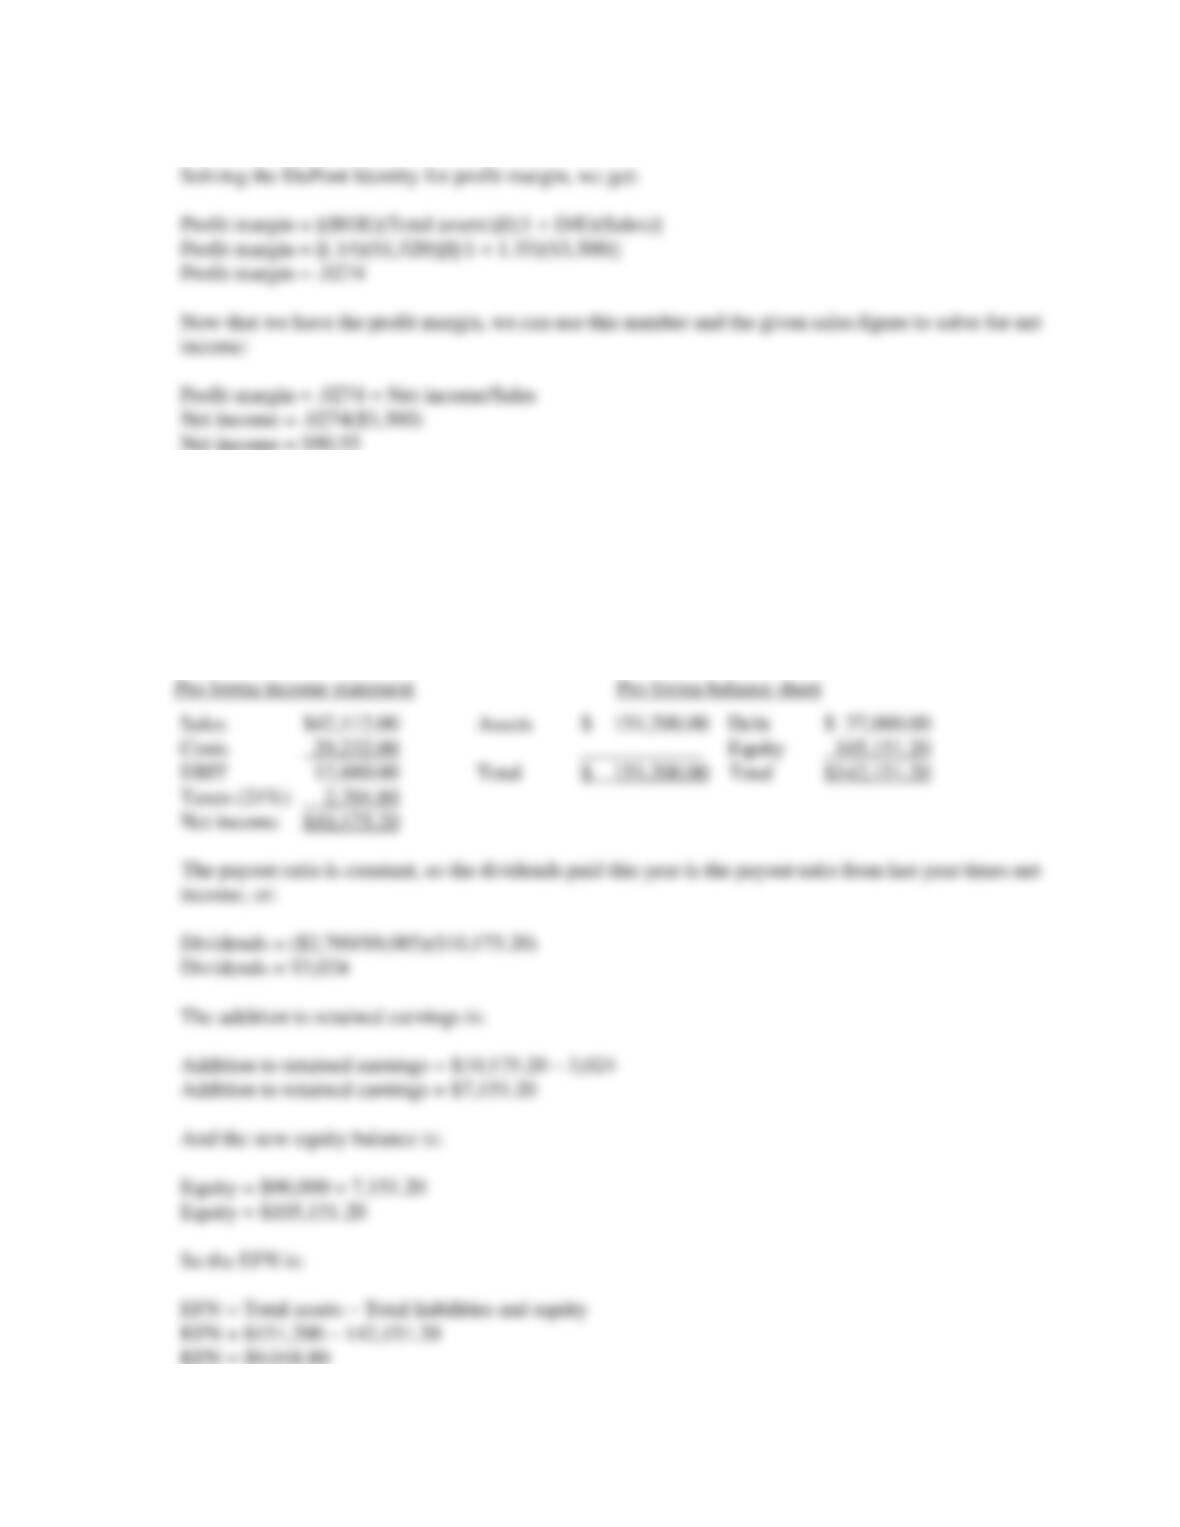
3. This is a multi-step problem involving several ratios. The ratios given are all part of the DuPont
Identity. The only DuPont Identity ratio not given is the profit margin. If we know the profit margin,
we can find the net income since sales are given. So, we begin with the DuPont Identity:
ROE = .14 = (Profit margin)(Total asset turnover)(Equity multiplier)
4. An increase of sales to $42,112 is an increase of:
Sales increase = ($42,112 – 37,600)/$37,600
Sales increase = .1200, or 12.00%
Assuming costs and assets increase proportionally, the pro forma financial statements will look like
this:
5. The maximum percentage sales increase without issuing new equity is the sustainable growth rate. To
calculate the sustainable growth rate, we first need to calculate the ROE, which is:
ROE = NI/TE
ROE = $20,066/$88,000
6. We need to calculate the retention ratio to calculate the sustainable growth rate. The retention ratio is:
b = 1 – .20
7. We must first calculate the ROE using the DuPont ratio to calculate the sustainable growth rate. The
ROE is:
ROE = (PM)(TAT)(EM)
8. An increase of sales to $9,462 is an increase of:
Sales increase = ($9,462 – 8,300)/$8,300
Sales increase = .14, or 14%
Assuming costs and assets increase proportionally, the pro forma financial statements will look like
this:
Pro forma income statement Pro forma balance sheet
Sales $ 9,462 Assets $ 21,774 Debt $ 8,400
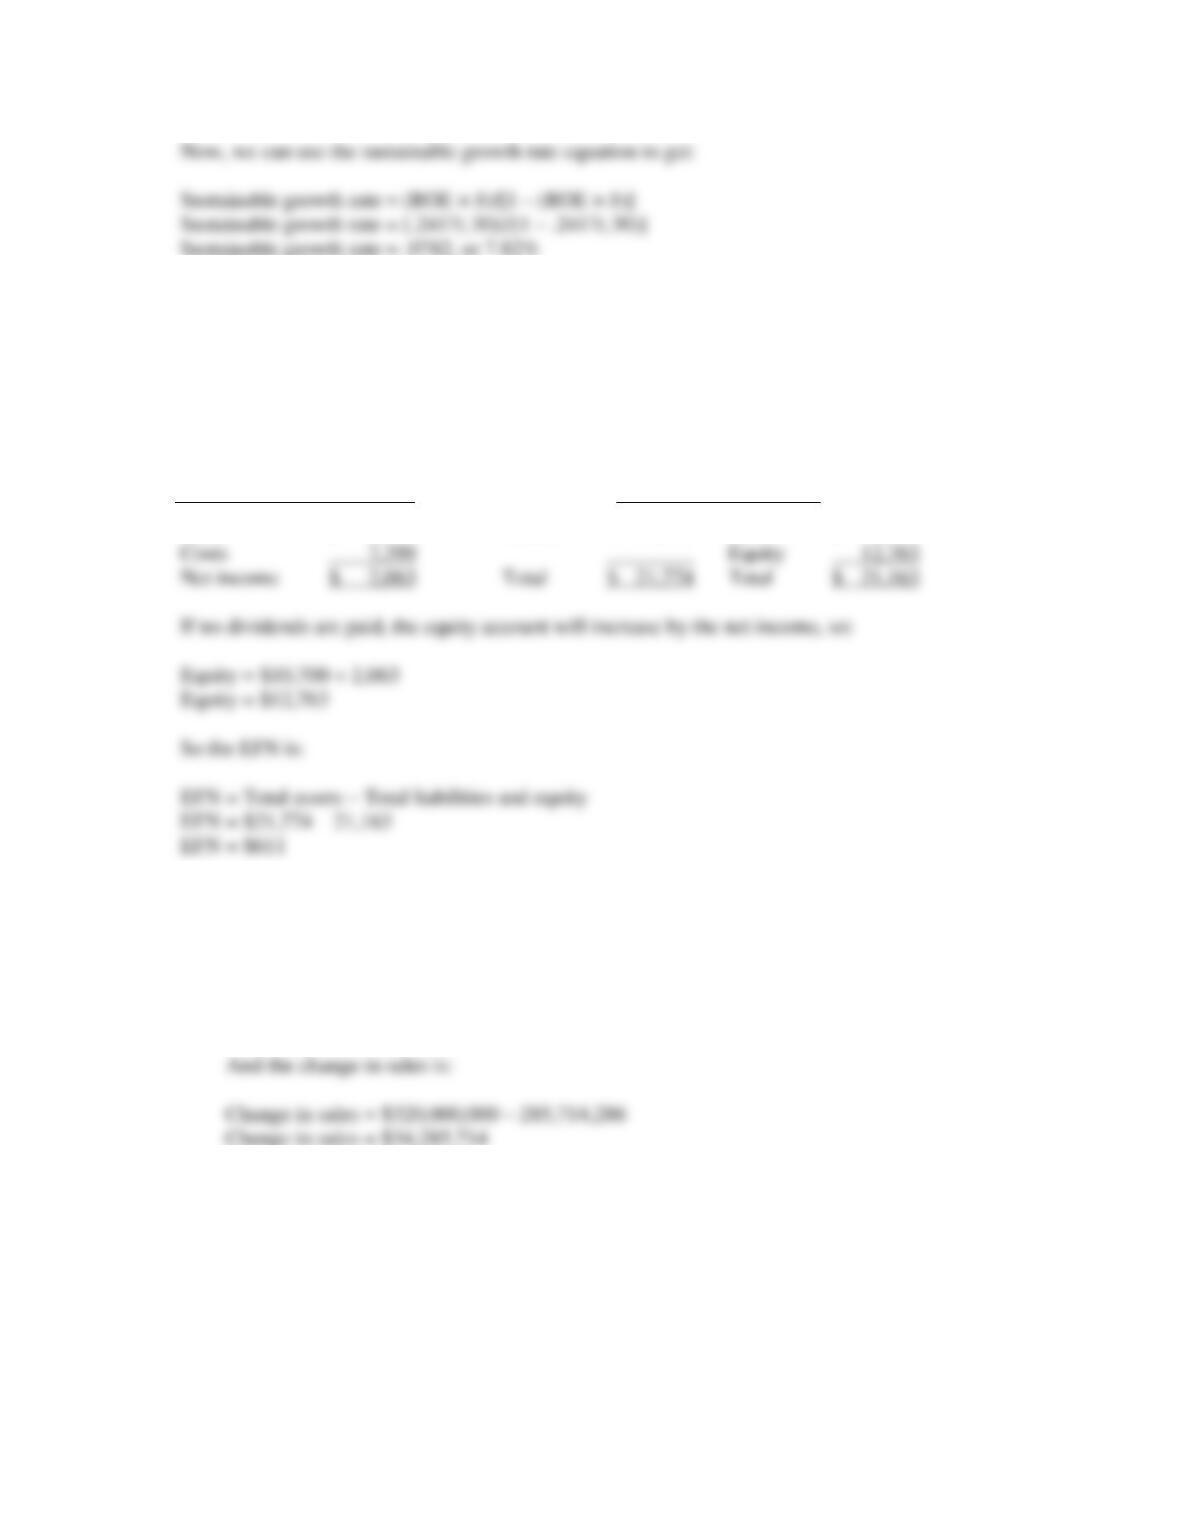
9. a. First, we need to calculate the current sales and change in sales. The current sales are next year’s
sales divided by one plus the growth rate, so:
Current sales = Next year’s sales/(1 + g)
Current sales = $320,000,000/(1 + .12)
Current sales = $285,714,286
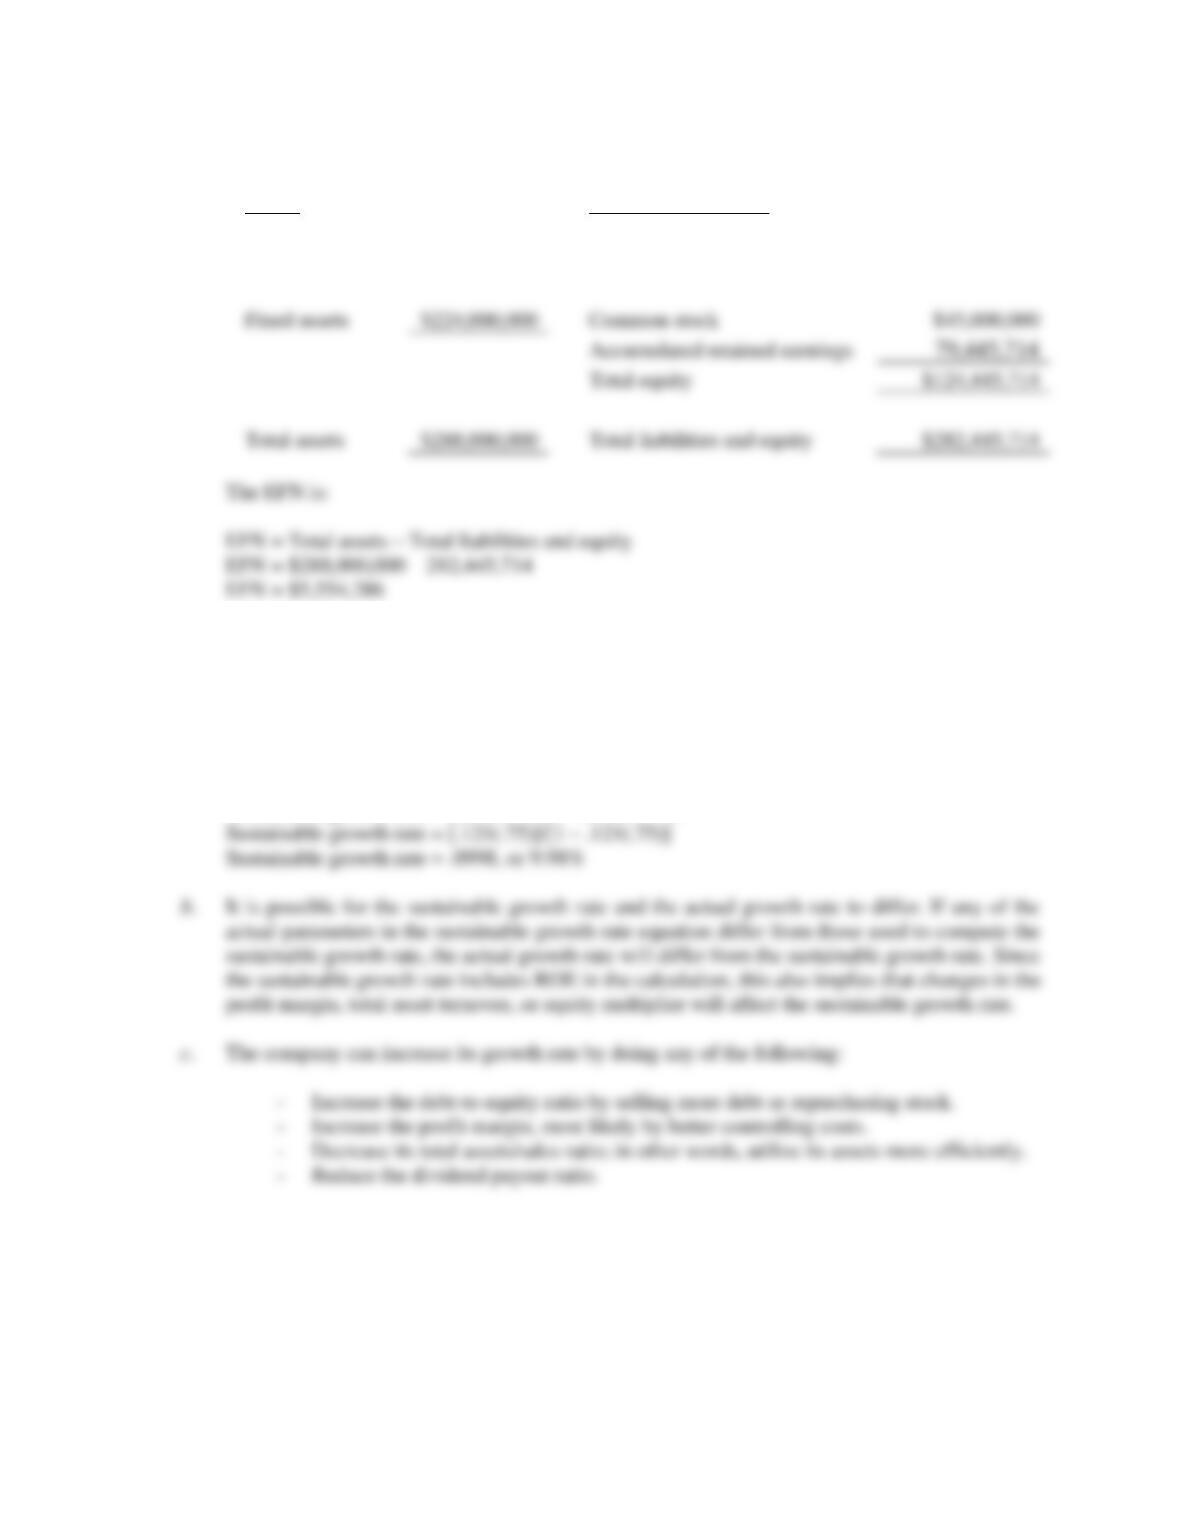
Accumulated retained earnings
59,285,714
Total equity
$104,285,714
Total assets
$257,142,857
Total liabilities and equity
$257,142,857
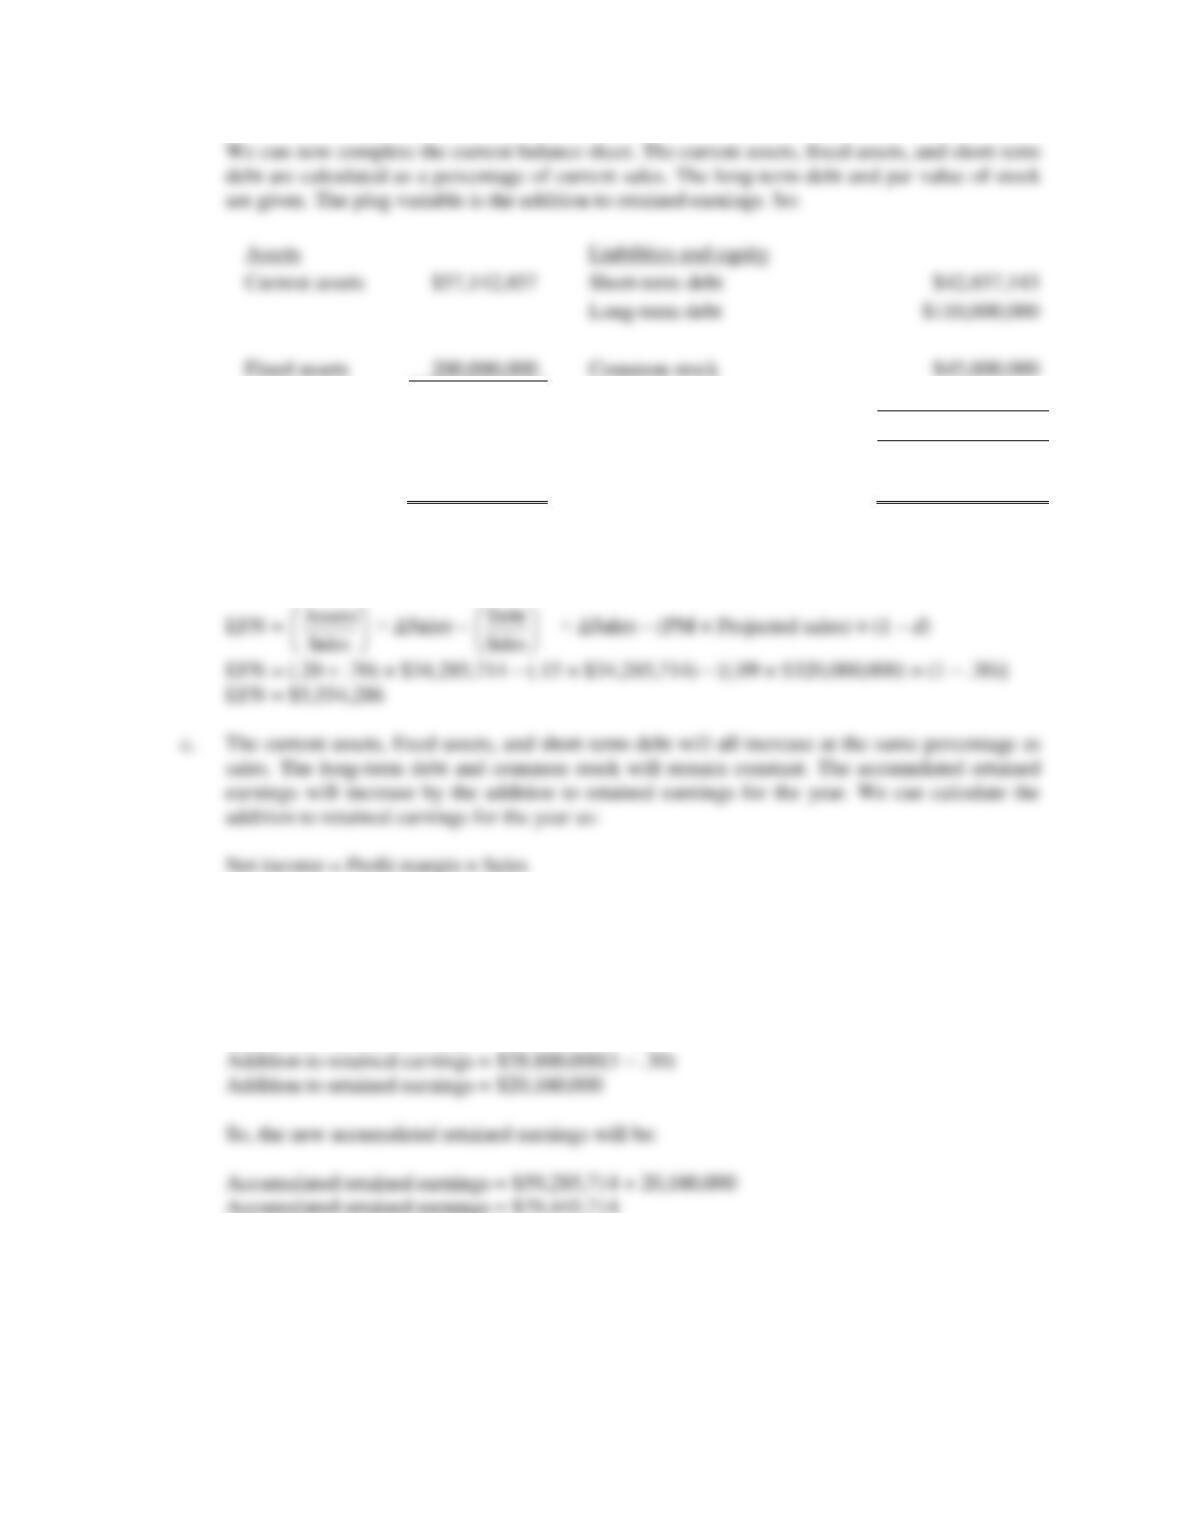
b. We can use the equation from the text to answer this question. The assets/sales and debt/sales are
the percentages given in the problem, so:
Net income = .09($320,000,000)
Net income = $28,800,000
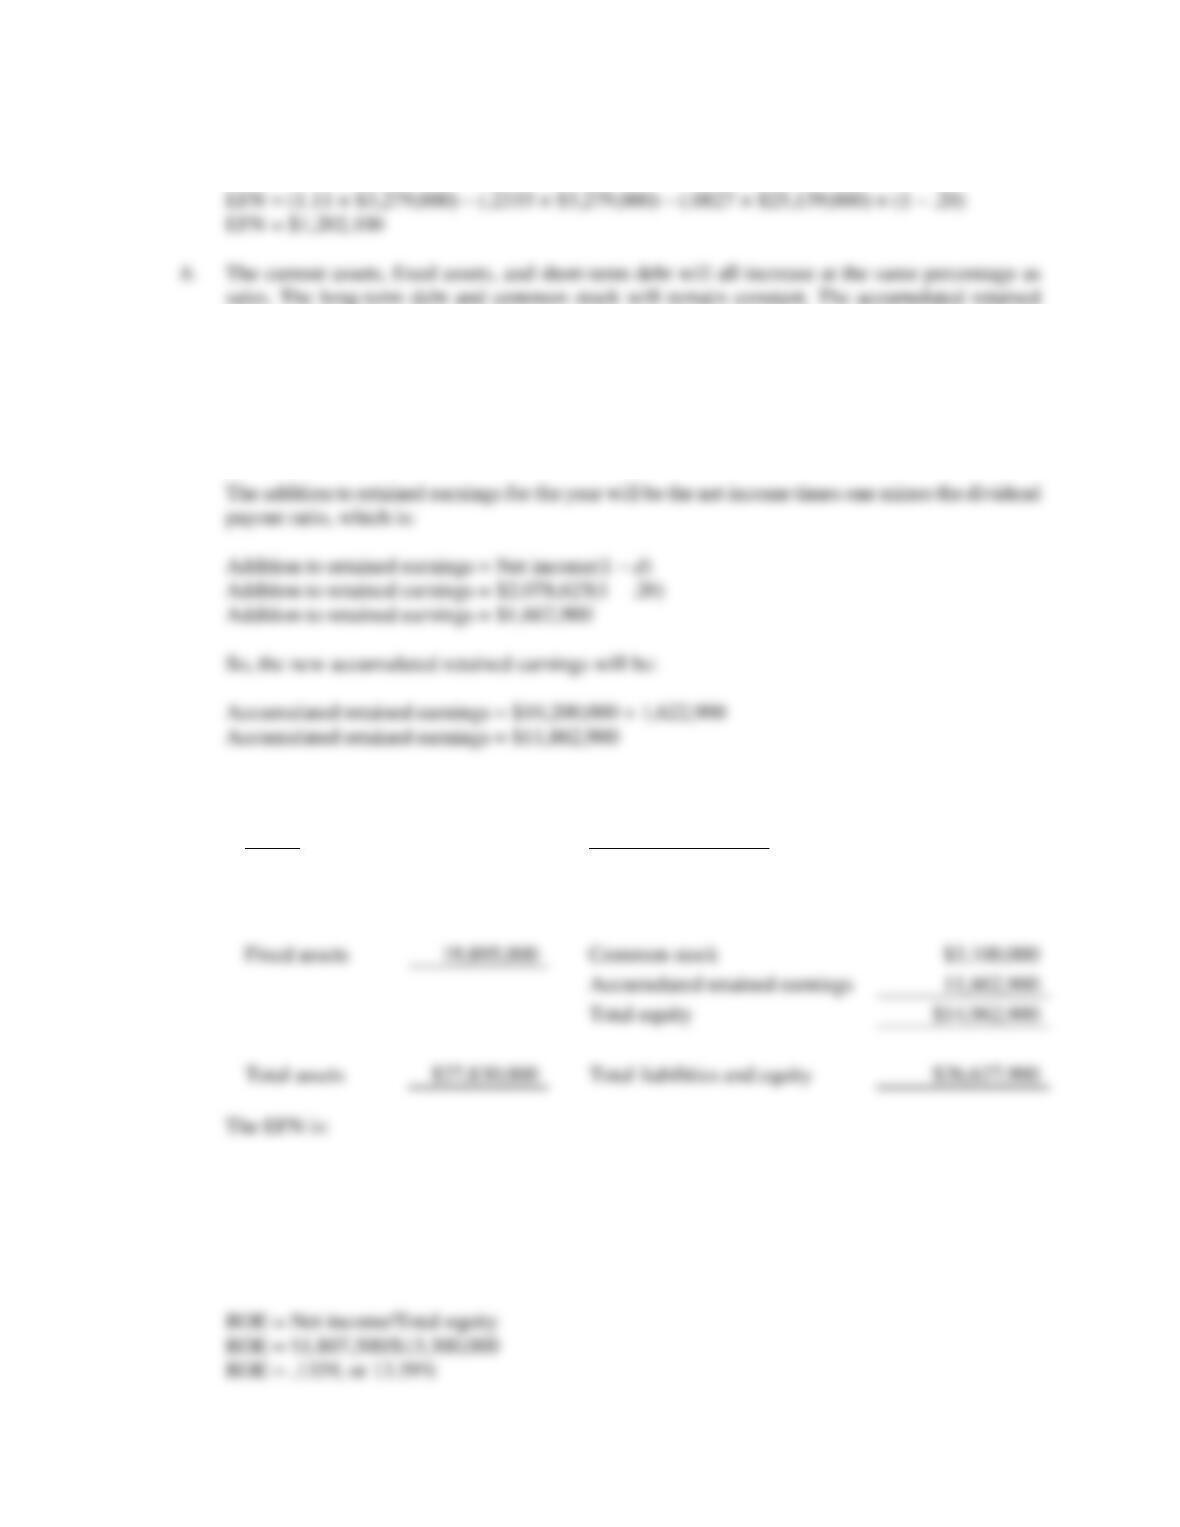
The addition to retained earnings for the year will be the net income times one minus the dividend
payout ratio, which is:
Addition to retained earnings = Net income(1 – d)
Assets
Liabilities and equity
Current assets
Short-term debt
Long-term debt
Fixed assets
Common stock
The pro forma balance sheet will be:
Assets
Liabilities and equity
Current assets
$64,000,000
Short-term debt
$48,000,000
Long-term debt
$110,000,000
10. a. The plowback ratio is one minus the dividend payout ratio, so:
b = 1 – .25
b = .75
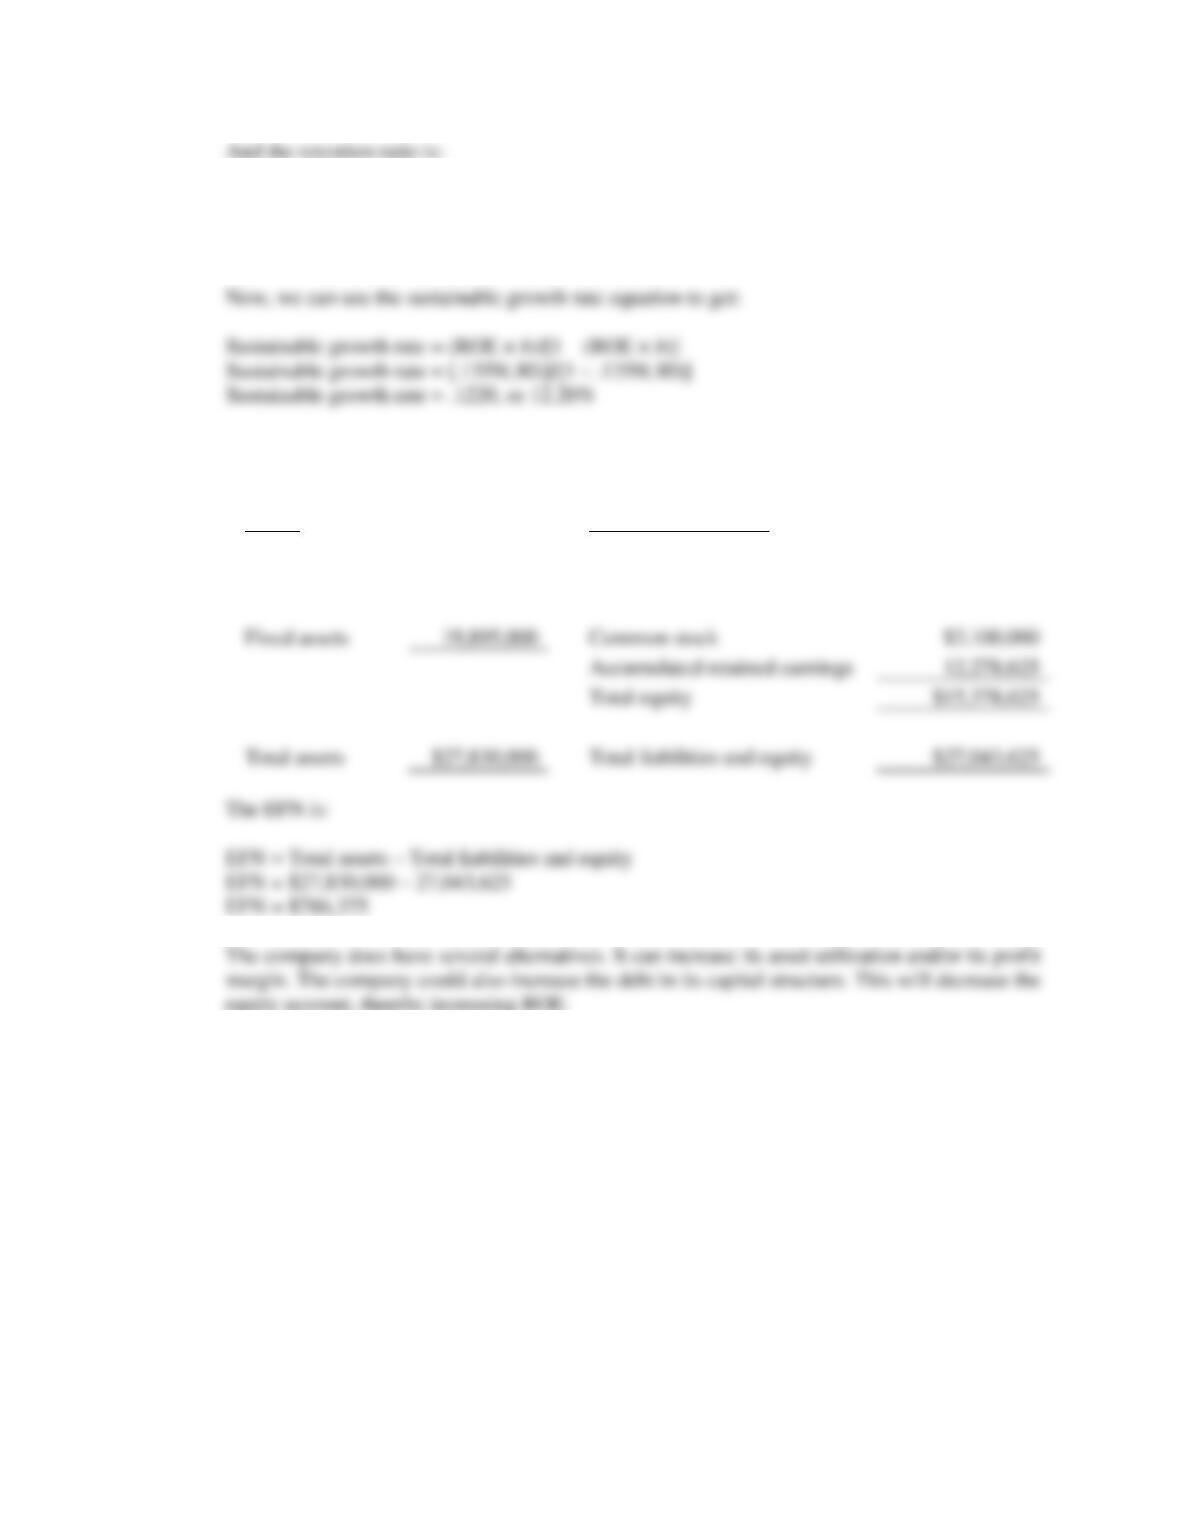
Now, we can use the sustainable growth rate equation to get:
Sustainable growth rate = (ROE × b)/[1 – (ROE × b)]
Fixed assets
Common stock
$45,000,000
Total assets
Total liabilities and equity
$282,445,714
11. The solution requires substituting two ratios into a third ratio. Rearranging D/TA:
Firm A Firm B
D/TA = .35 D/TA = .45
(TA – E)/TA = .35 (TA – E)/TA = .45
12. Profit margin = Net income/Sales
Profit margin = –£18,137/£279,386
Profit margin = –.0649, or 6.49%
13. a. The equation for external funds needed is:
EFN =
Sales
Assets
× ΔSales –
Sales
Debt
× ΔSales – (PM × Projected sales) × (1 – d)
where:
so:
earnings will increase by the addition to retained earnings for the year. We can calculate the
addition to retained earnings for the year as:
Net income = Profit margin × Sales
Net income = .0827($25,139,000)
Net income = $2,078,625
The pro forma balance sheet will be:
Assets
Liabilities and equity
Current assets
$7,935,000
Short-term debt
$5,865,000
Long-term debt
$5,800,000
Fixed assets
19,895,000
Common stock
$3,100,000
Total assets
Total liabilities and equity
EFN = Total assets – Total liabilities and equity
EFN = $27,830,000 – 26,627,900
EFN = $1,202,100
c. The ROE is:
b = Retention ratio = Retained earnings/Net income
b = $1,446,000/$1,807,500
b = .80
d. The company cannot just cut its dividends to achieve the forecast growth rate. As shown below,
even with a zero dividend policy, the EFN will still be $786,375.
Assets
Liabilities and equity
Current assets
$7,935,000
Short-term debt
$5,865,000
Long-term debt
$5,800,000
Fixed assets
19,895,000
Common stock
$3,100,000
Accumulated retained earnings
12,278,625
Total equity
14. This is a multi-step problem involving several ratios. It is often easier to look backward to determine
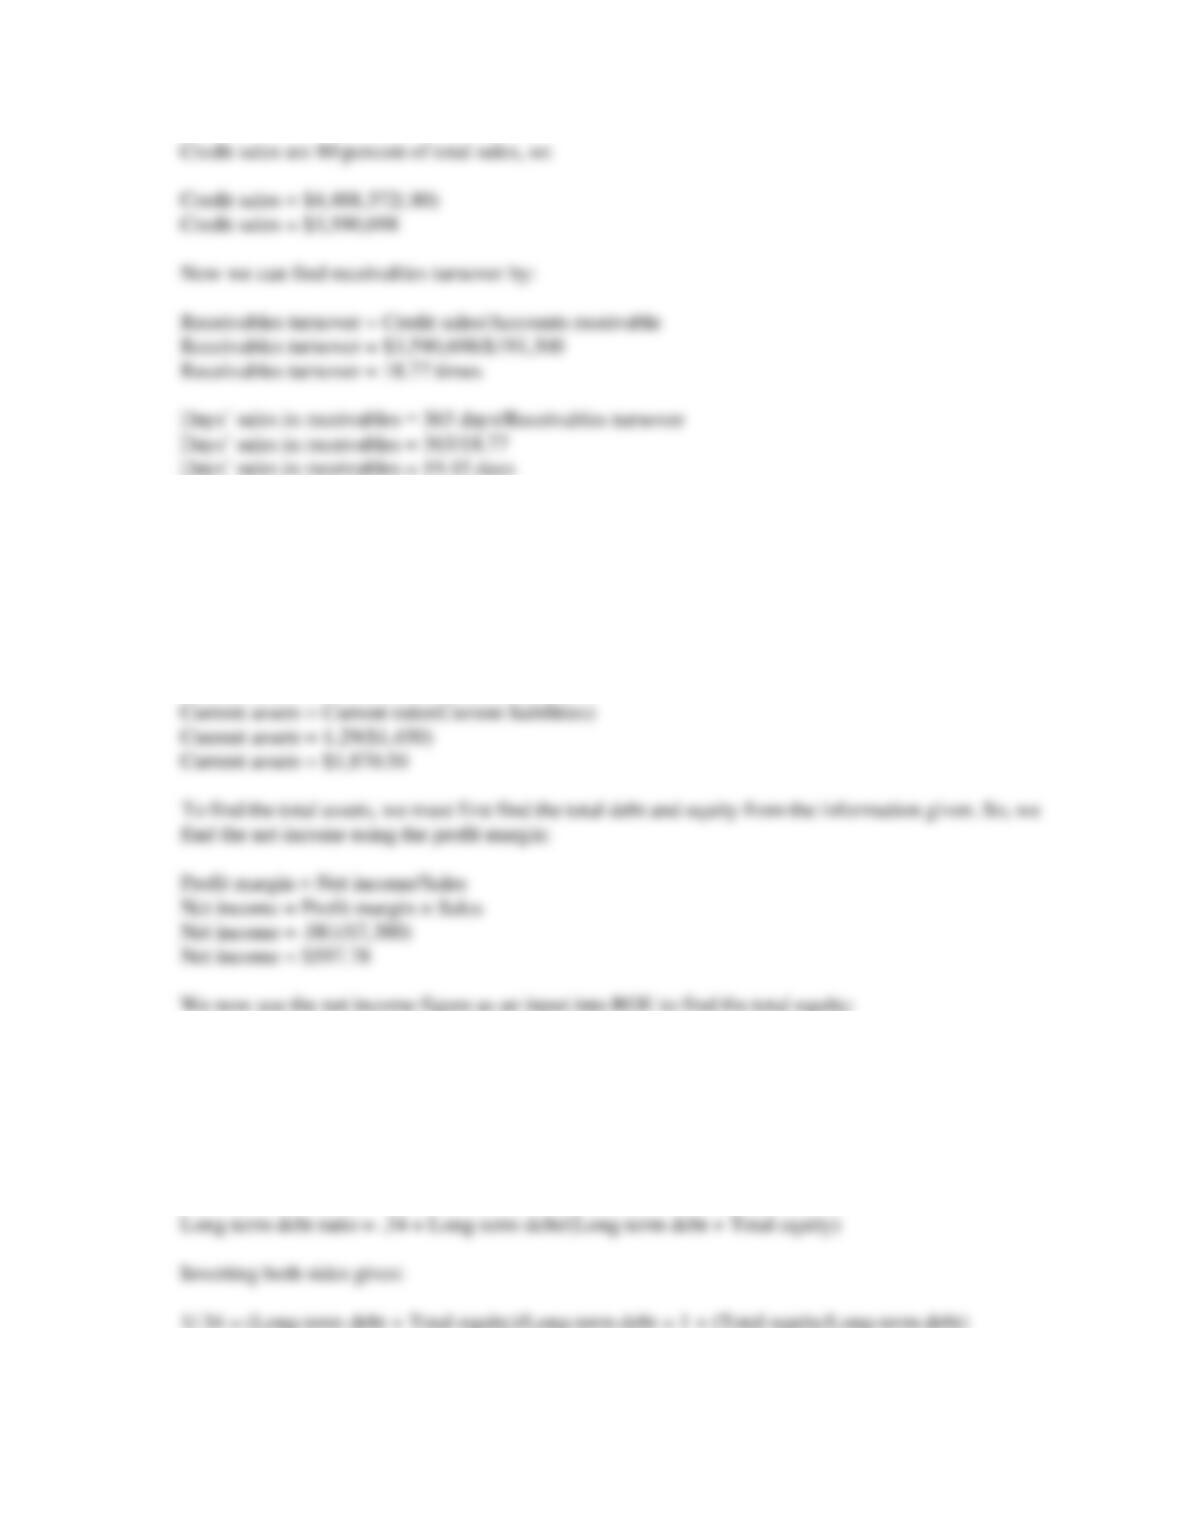
where to start. We need receivables turnover to find days’ sales in receivables. To calculate receivables
turnover, we need credit sales, and to find credit sales, we need total sales. Since we are given the
profit margin and net income, we can use these to calculate total sales as:
Profit margin = Net income/Sales
.0860 = $386,000/Sales
Sales = $4,488,372
15. The solution to this problem requires a number of steps. First, remember that:
Current assets + Net fixed assets = Total assets
So, if we find the current assets and the total assets, we can solve for net fixed assets. Using the
numbers given for the current ratio and the current liabilities, we solve for current assets:
Current ratio = Current assets/Current liabilities
ROE = Net income/Total equity
Total equity = Net income/ROE
Total equity = $597.78/.143
Total equity = $4,180.28
Next, we need to find the long-term debt. The long-term debt ratio is:
Total debt = $3,603.48
And, with the total debt, we can find the total debt & equity, which is equal to total assets:
Total assets = Total debt + Total equity
Total assets = $3,603.48 + 4,180.28
Total assets = $7,783.76
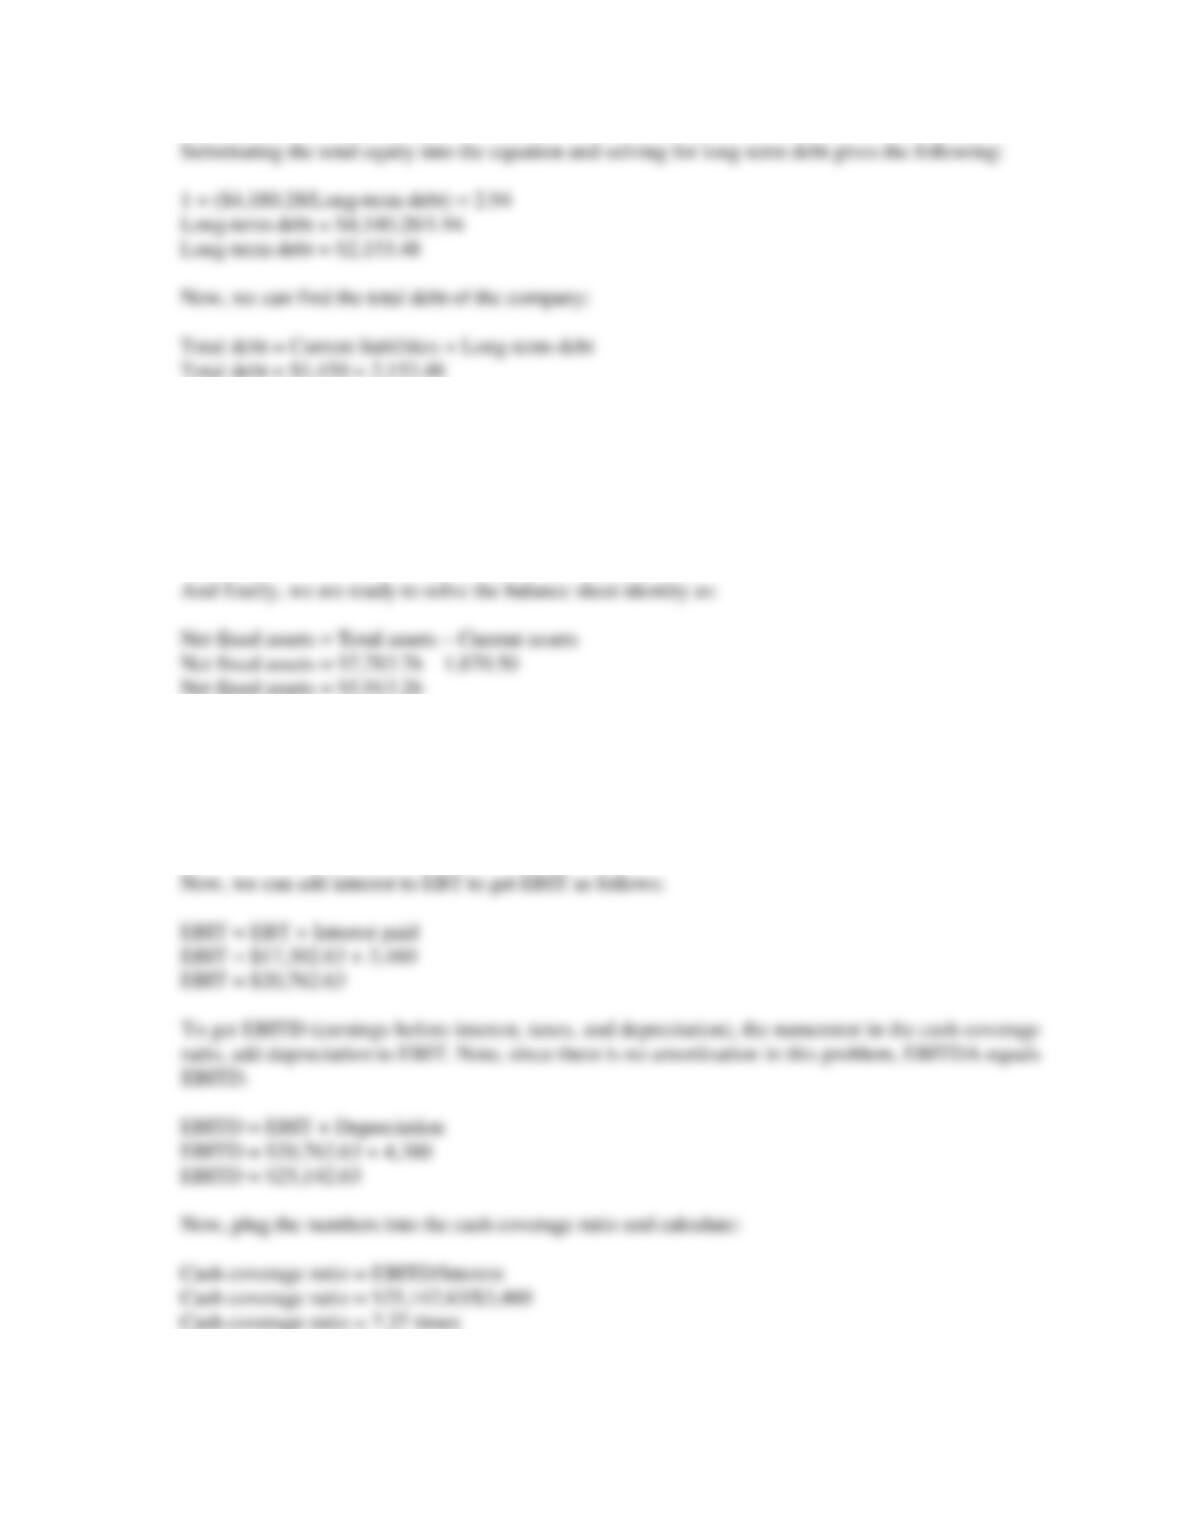
16. This problem requires you to work backward through the income statement. First, recognize that
Net income = (1 – TC)EBT. Plugging in the numbers given and solving for EBT, we get:
EBT = $13,150/(1 – .24)
EBT = $17,302.63
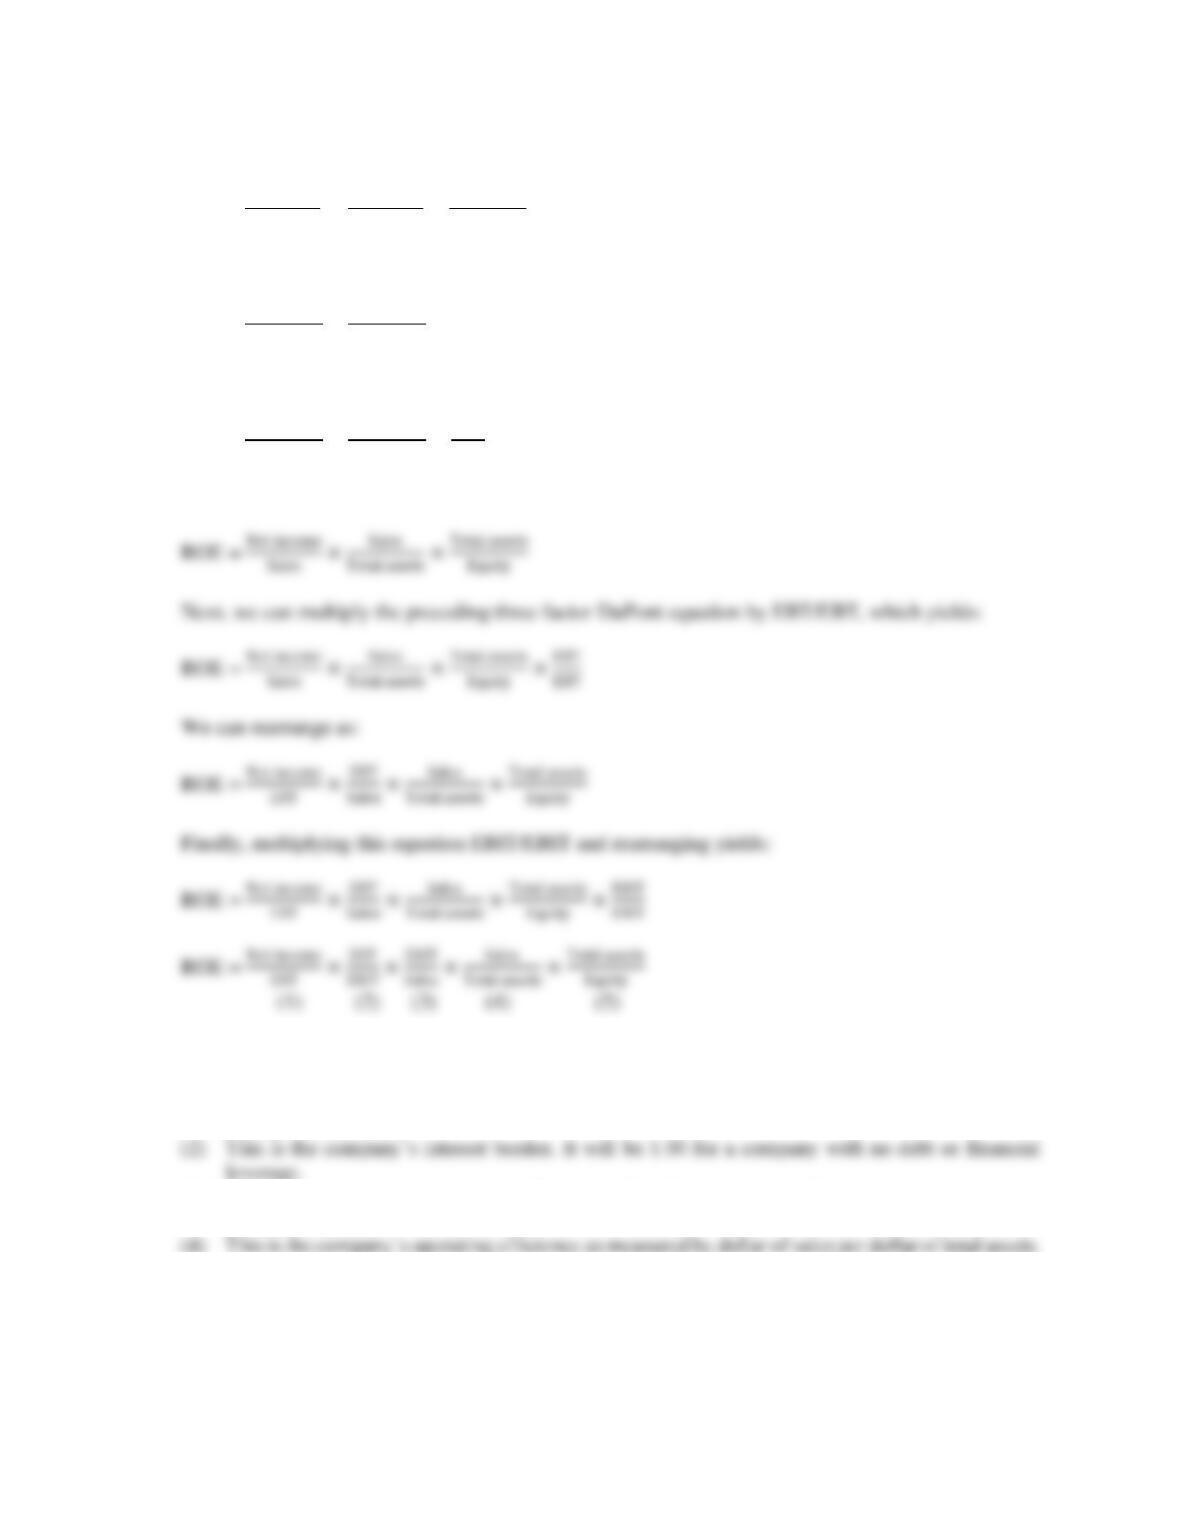
17. We can start by multiplying ROE by Total assets/Total assets
ROE = Net income
Equity =Net income
Equity ×Total assets
Total assets
Rearranging, we get:
ROE = Net income
Total assets ×Total assets
Equity
Next, we can multiply by Sales/Sales, which yields:
ROE = Net income
Total assets ×Equity
Total assets ×Sales
Sales
Rearranging, we get:
The interpretation of each term is as follows:
(1) This is the company’s tax burden. This is the proportion of the company’s profits retained after
paying income taxes.
(3) This is the company’s operating profit margin. It is the operating profit before interest and taxes
per dollar of sales.
(5) This is the company’s financial leverage as measured by the equity multiplier.
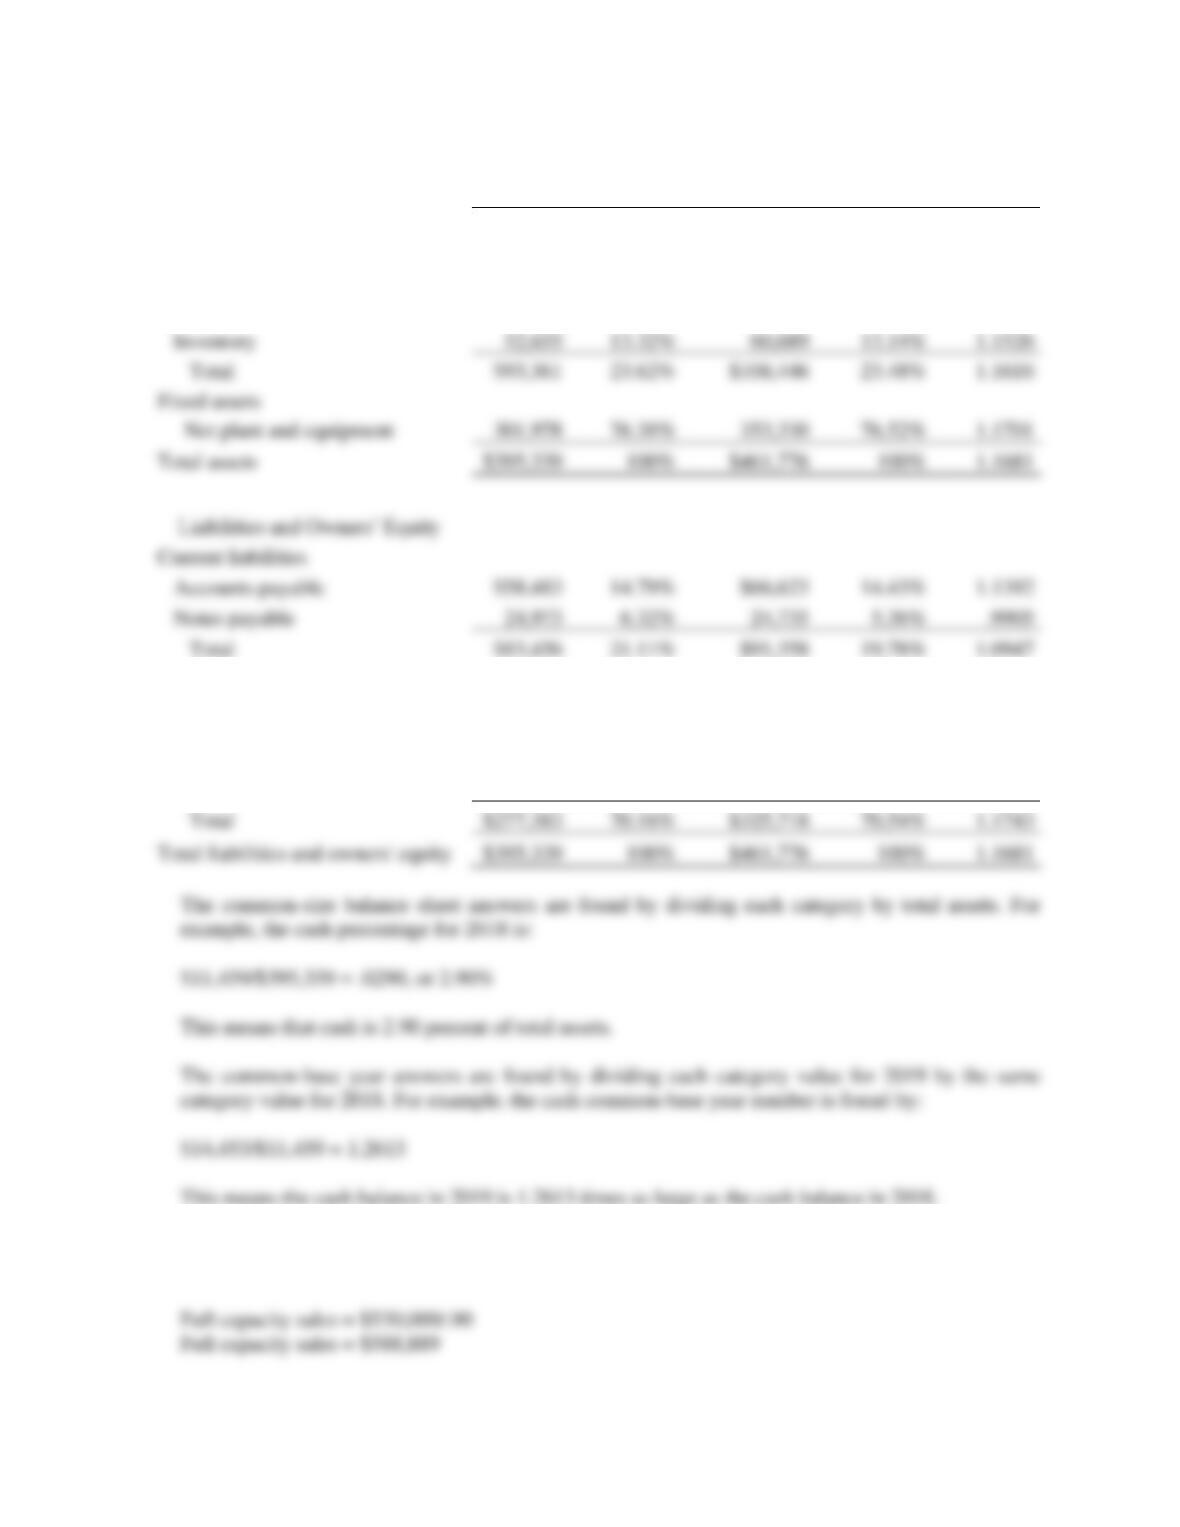
18.
2018
Common
size
2019
Common
size
Common
base year
Assets
Current assets
Cash
$11,459
2.90%
$14,453
3.13%
1.2613
Accounts receivable
29,247
7.40%
33,304
7.21%
1.1387
Long-term debt
34,500
8.73%
44,700
9.68%
1.2957
Owners’ equity
Common stock and paid-in
surplus
$54,000
13.66%
$56,500
12.24%
1.0463
Accumulated retained earnings
223,383
56.50%
269,218
58.30%
1.2052
Total
$277,383
70.16%
70.54%
1.1743
Total liabilities and owners’ equity
$395,339
1.1681
19. To determine full capacity sales, we divide the current sales by the capacity the company is currently
using, so:
Inventory
52,655
13.32%
60,689
13.14%
1.1526
Total
$93,361
23.62%
23.48%
1.1616
Fixed assets
Net plant and equipment
301,978
76.38%
353,330
76.52%
1.1701
Total assets
$395,339
1.1681
Current liabilities
Accounts payable
$58,483
14.79%
$66,623
14.43%
1.1392
Notes payable
6.32%
24,735
5.36%
Total
$83,456
21.11%
$91,358
19.78%
1.0947