Answers and Solutions: 25 – 1
Chapter 25
Portfolio Theory and Asset Pricing Models
ANSWERS TO END-OF-CHAPTER QUESTIONS
25-1 a. A portfolio is made up of a group of individual assets held in combination. An asset
that would be relatively risky if held in isolation may have little, or even no risk if held
in a well-diversified portfolio.
The feasible, or attainable, set represents all portfolios that can be constructed from a
given set of stocks. This set is only efficient for part of its combinations.
b. An indifference curve is the risk/return trade-off function for a particular investor and
reflects that investor’s attitude toward risk. The indifference curve specifies an
investor’s required rate of return for a given level of risk. The greater the slope of the
indifference curve, the greater is the investor’s risk aversion.
c. The Capital Asset Pricing Model (CAPM) is a general equilibrium market model
developed to analyze the relationship between risk and required rates of return on assets
when they are held in well-diversified portfolios. The SML is part of the CAPM.
Answers and Solutions: 25 – 2
d. The characteristic line for a particular stock is obtained by regressing the historical
returns on that stock against the historical returns on the general stock market. The
e. Arbitrage Pricing Theory (APT) is an approach to measuring the equilibrium risk/return
relationship for a given stock as a function of multiple factors, rather than the single
factor (the market return) used by the CAPM. The APT is based on complex
mathematical and statistical theory, but can account for several factors (such as GNP
and the level of inflation) in determining the required return for a particular stock.
Answers and Solutions: 25 – 3
SOLUTIONS TO END-OF-CHAPTER PROBLEMS
25-1 bi = iM (i / M) = 0.70(0.40/0.20) = 1.4.
25-3 r
^p = wAr
^A + (1 − wA) r
^B
= 0.30(12%) + 0.70(18%) = 16.20%
25-4 a.
.)rr(rb)rr(rr
M
iiM
RFMRFiRFMRFi
−+=−+=
Answers and Solutions: 25 – 4
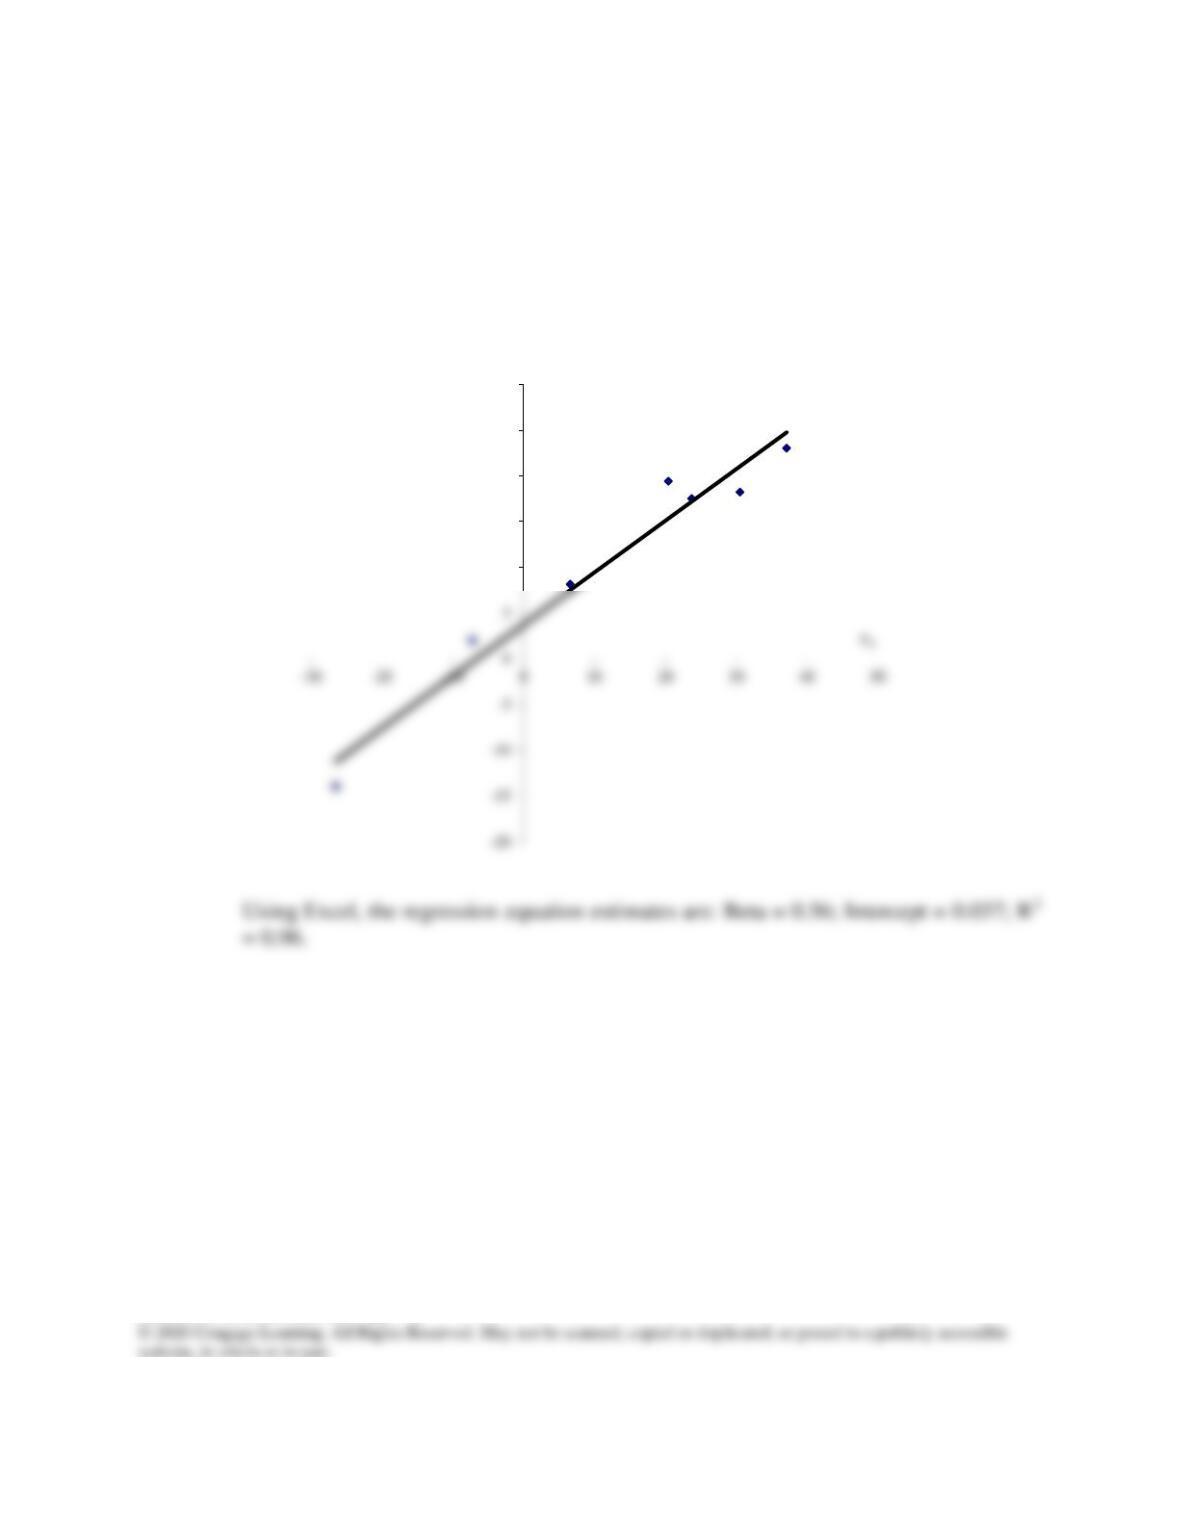
25-5 a. A plot of the approximate regression line is shown in the following figure:
10
15
20
25
30
r
X
(%)
Answers and Solutions: 25 – 5
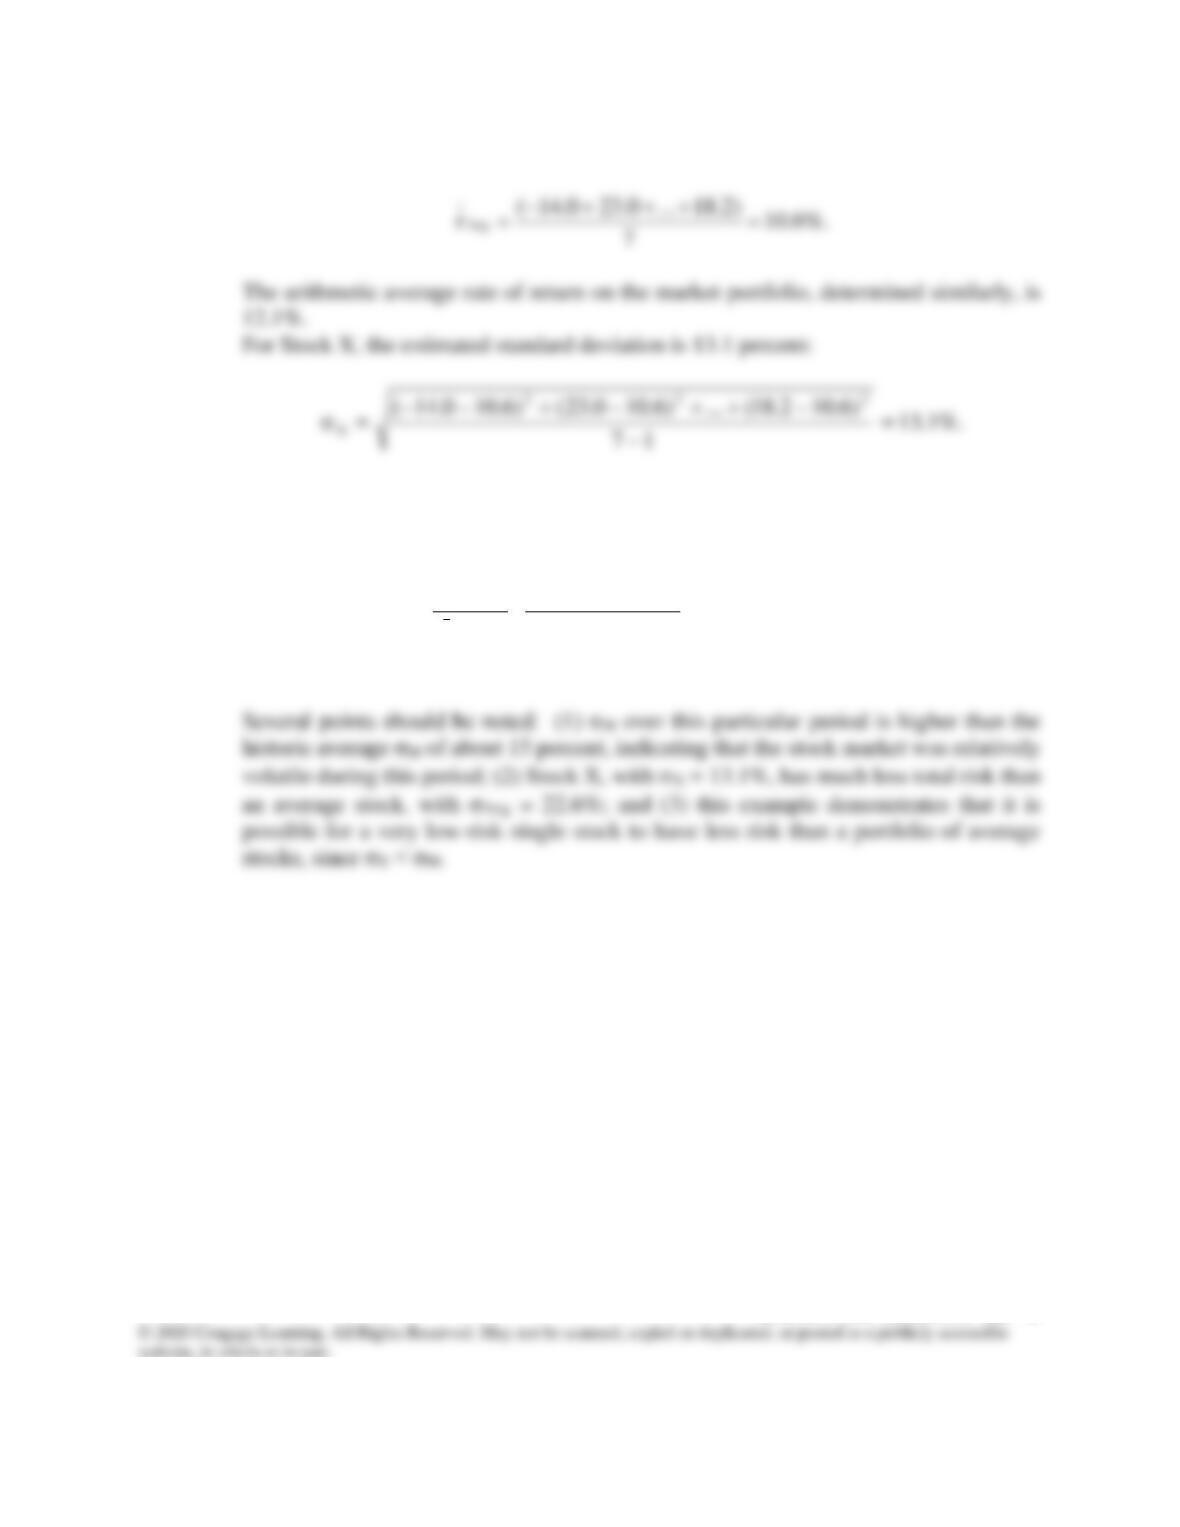
b. The arithmetic average return for Stock X is calculated as follows:
The standard deviation of returns for the market portfolio is similarly determined to be
22.6 percent. The results are summarized below:
Stock X Market Portfolio
Average return,
Avg
r
10.6% 12.1%
Standard deviation, σ 13.1 22.6
c. Since Stock X is in equilibrium and plots on the Security Market Line (SML), and
given the further assumption that 𝑟
∧
𝑋= 𝑟
−
𝑋 and
MM rr =
—and this assumption often does
not hold—then this equation must hold:
Answers and Solutions: 25 – 7
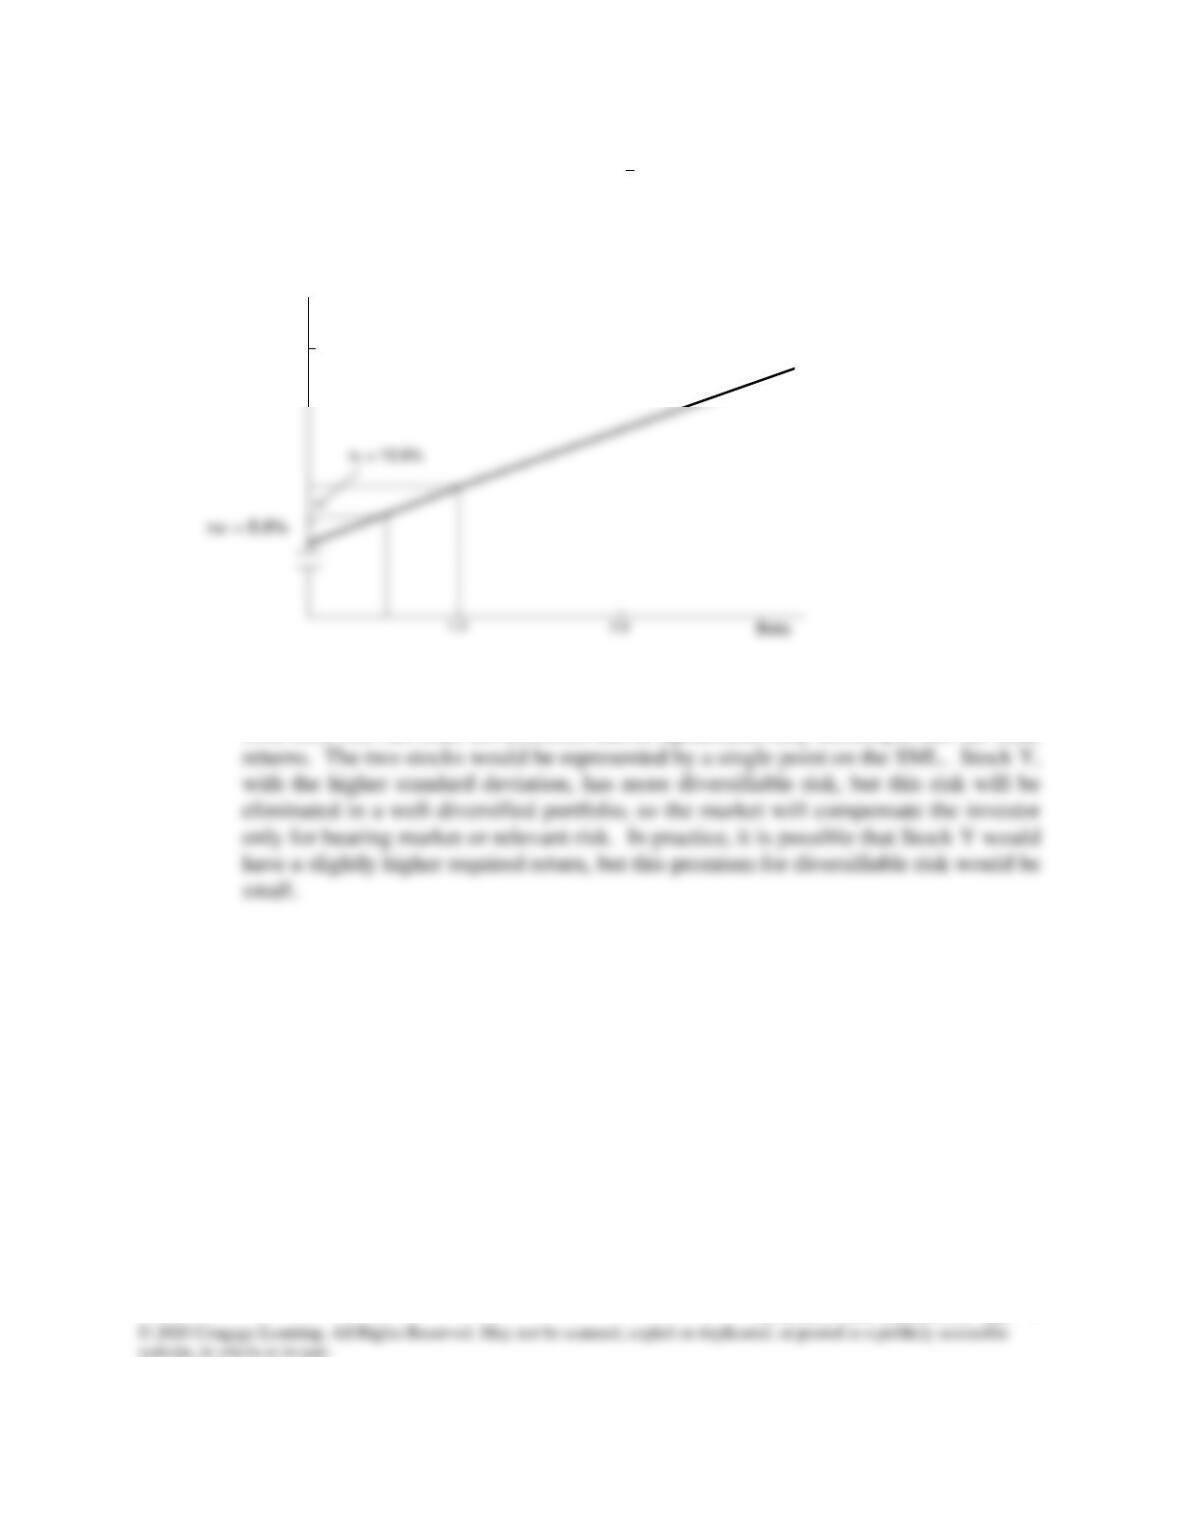
d. The SML is plotted below. Data on the risk-free security (bRF = 0,
rRF = 8.6%) and Security X (bX = 0.56,
X
r
= 10.6%) provide the two points through
which the SML can be drawn. rM provides a third point.
e. In theory, you would be indifferent between the two stocks. Since they have the same
beta, their relevant risks are identical, and in equilibrium they should provide the same
k(%)
20
r(%)
Answers and Solutions: 25 – 8
25-6
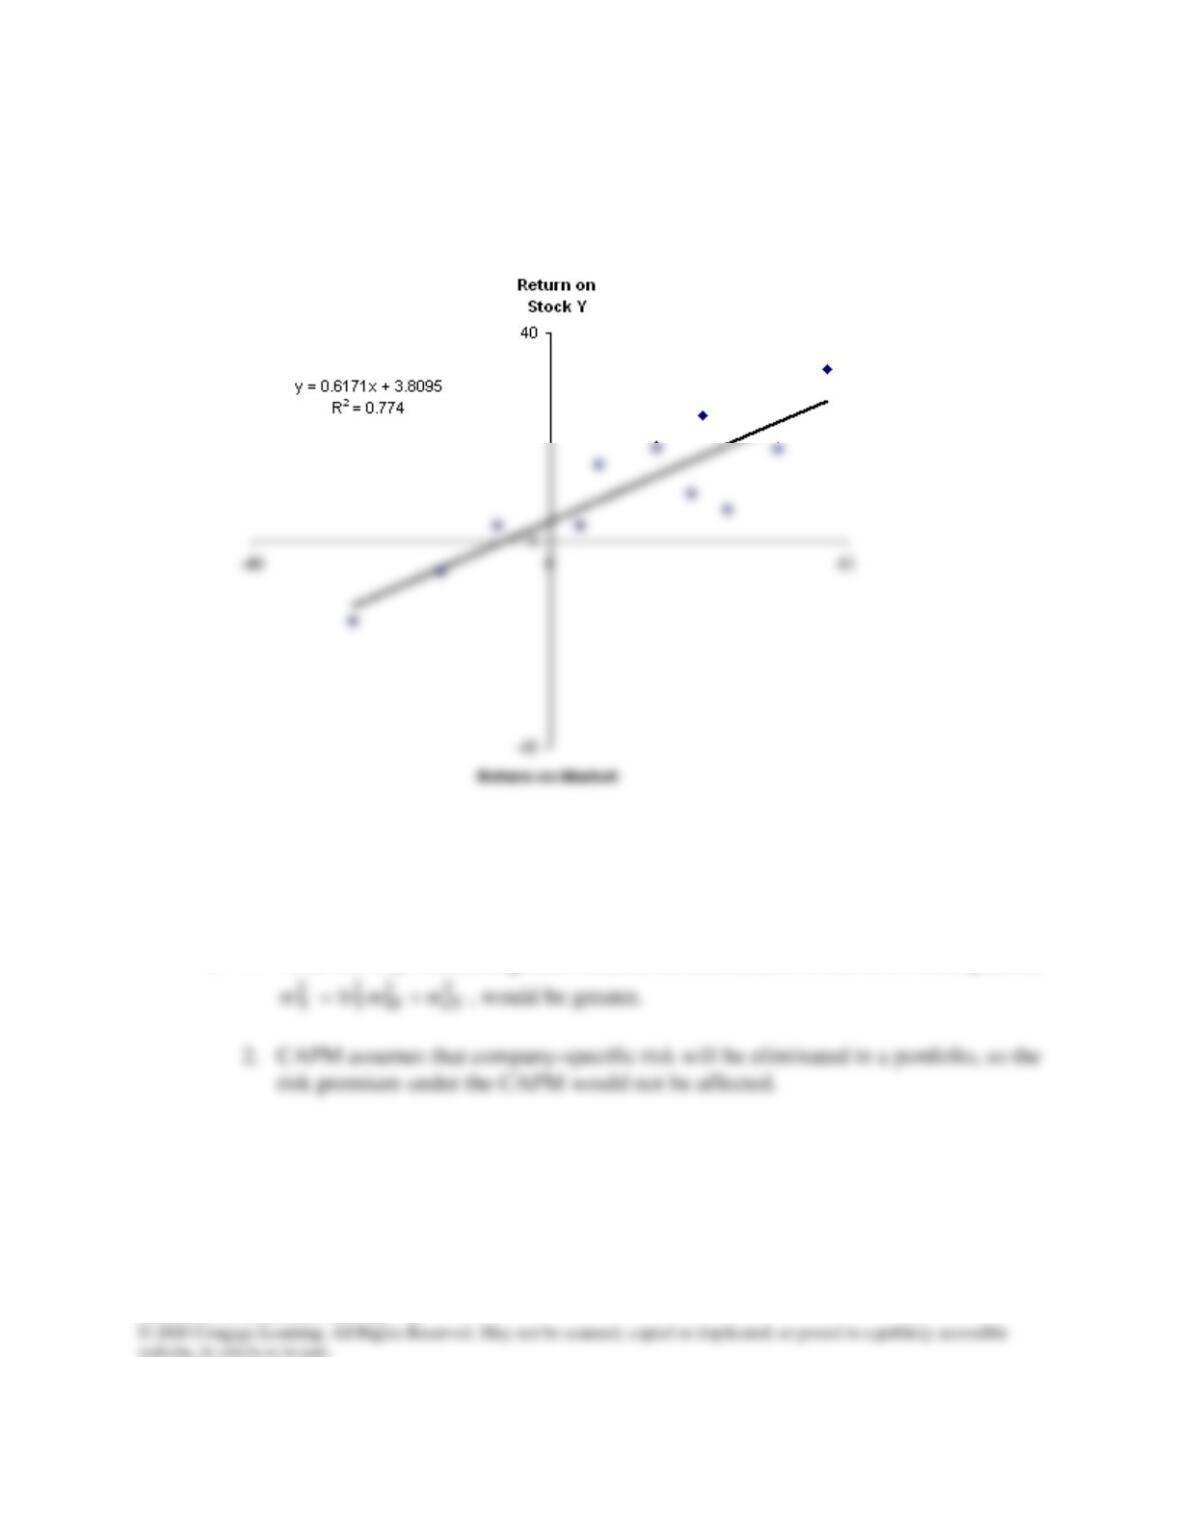
a. The regression graph is shown below. Using a spreadsheet, we find b = 0.62.
b. Because b = 0.62, Stock Y is about 62 percent as volatile as the market; thus, its relative
risk is about 62 percent of that of an average firm.
c. 1. Total risk
)( 2
Y
would be greater because the second term of the firm’s risk equation,
Answers and Solutions: 25 – 9
d. 1. The stock’s variance would not change, but the risk of the stock to an investor
holding a diversified portfolio would be greatly reduced.

Answers and Solutions: 25 – 10
SOLUTION TO SPREADSHEET PROBLEM
25-7 The detailed solution for the spreadsheet problem is available in the file Ch25 P07 Build
a Model Solution.xlsx on the textbook’s Web site.

Mini Case: 25 – 11
MINI CASE
You have been hired at the investment firm of Bowers & Noon. One of its clients doesn’t
understand the value of diversification or why stocks with the biggest standard deviations
don’t always have the highest expected returns. Your assignment is to address the client’s
concerns by showing the client how to answer the following questions.
a. Suppose asset A has an expected return of 10 percent and a standard deviation of
20 percent. Asset B has an expected return of 16 percent and a standard deviation
of 40 percent. If the correlation between A and B is 0.35, what are the expected
return and standard deviation for a portfolio comprised of 30 percent asset A and
70 percent asset B?
Answer:
r
ˆ
)w1(r
ˆ
wr
ˆBAAAP
−+=
b. Plot the attainable portfolios for a correlation of 0.35. Now plot the attainable
portfolios for correlations of +1.0 and -1.0.
Answer: