1
2
3
4
5
6
7
11
12
13
14
15
16
17
18
19
24
25
26
27
31
32
33
34
46
A B C D E F G H I J K
11/23/2018
Situation
Proposition I.
Input Data Firm U Firm L
No Debt Some Debt
SL = VL − D
b. Assume that Firms U and L are in the same risk class, and that both have EBIT = $560,000. Firm U uses no debt financing, and its cost of equity
is rsU = 14%. Firm L has $1 million of debt outstanding at a cost of rd = 8%. There are no taxes. Assume that the MM assumptions hold, and then:
1. The weighted average cost of capital is independent of the firm’s capital structure.
2. The WACC of a firm with debt is equal to the unlevered cost of equity.
Chapter 21. Mini Case
David Lyons, the CEO of Lyons Solar Technologies, is concerned about his firm’s level of debt financing. The company uses short-term debt to
a. Business Week recently ran an article on companies‘ debt policies, and the names Modigliani and Miller (MM) were mentioned several times
as leading researchers on the theory of capital structure. Briefly, who are MM, and what assumptions are embedded in the MM and Miller
models? Answer: See Chapter 21 Mini Case Show
matter, he poses the following questions to you, his recently hired assistant.
47
48
59
60
61
62
63
64
65
66
67
68
69
70
71
72
73
74
75
89
90
91
92
A B C D E F G H I J K
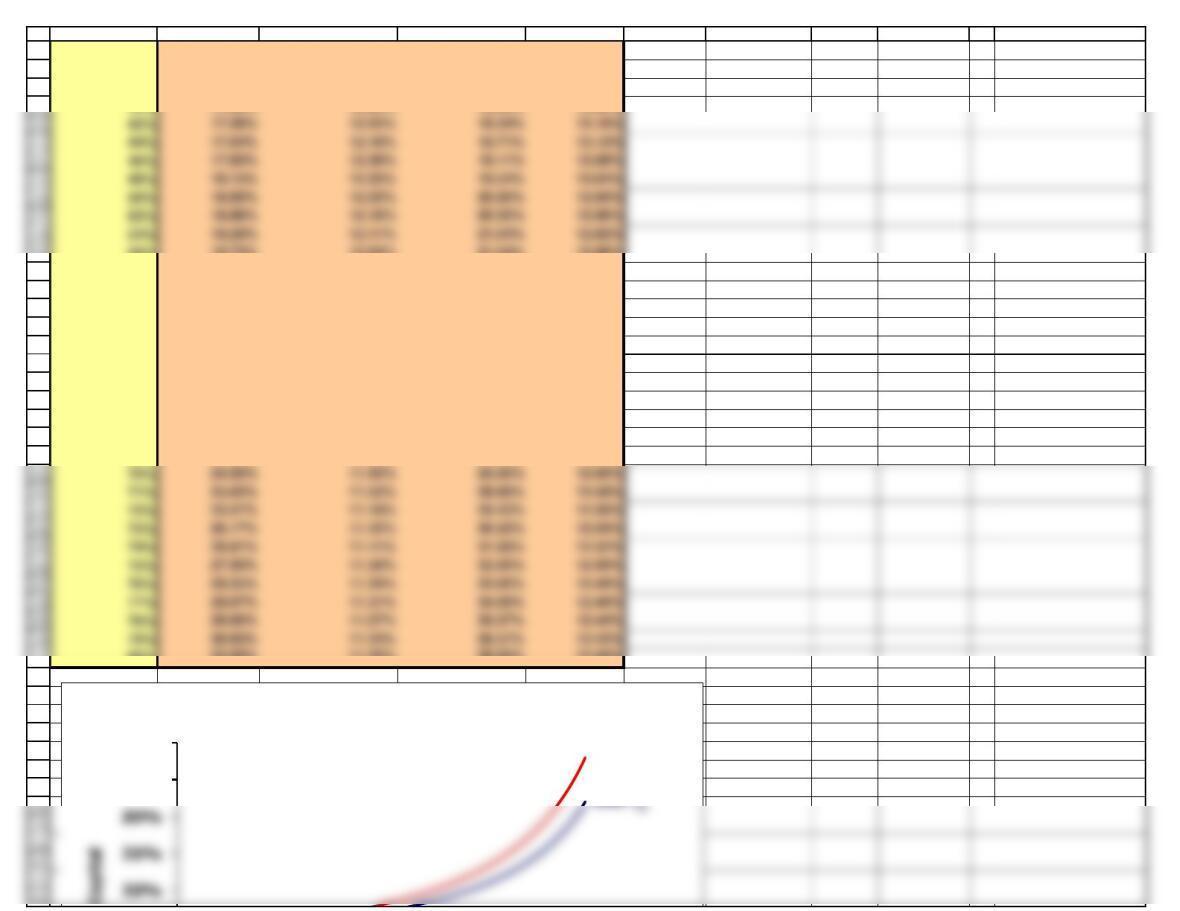
= $3,000,000
MM without Taxes (Millions of dollars)
D
VUSD/VLrdrsWACC
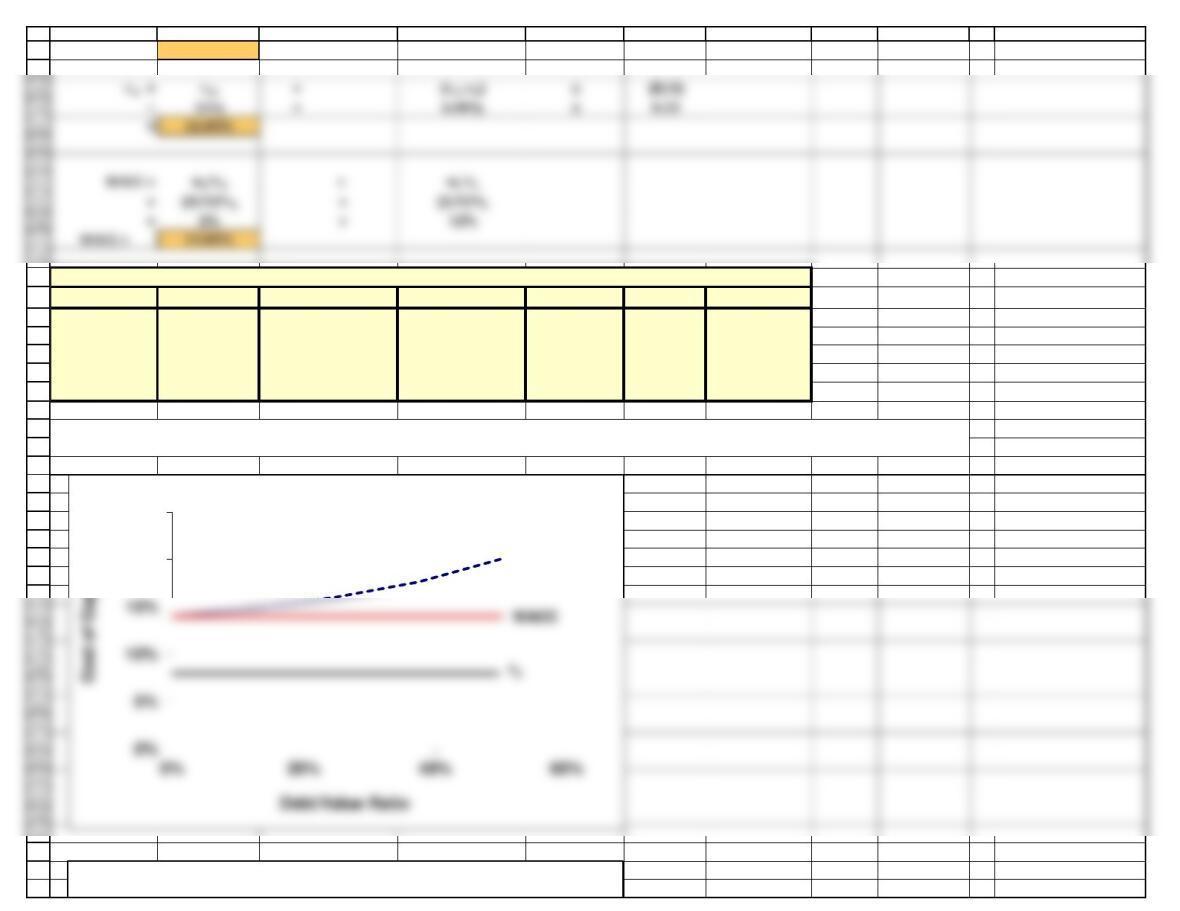
0.0 $4.00 $4.00 0.00% 8.00% 14.00% 14.00%
0.5 $4.00 $3.50 12.50% 8.00% 14.86% 14.00%
1.0 $4.00 $3.00 25.00% 8.00% 16.00% 14.00%
1.5 $4.00 $2.50 37.50% 8.00% 17.60% 14.00%
2.0 $4.00 $2.00 50.00% 8.00% 20.00% 14.00%
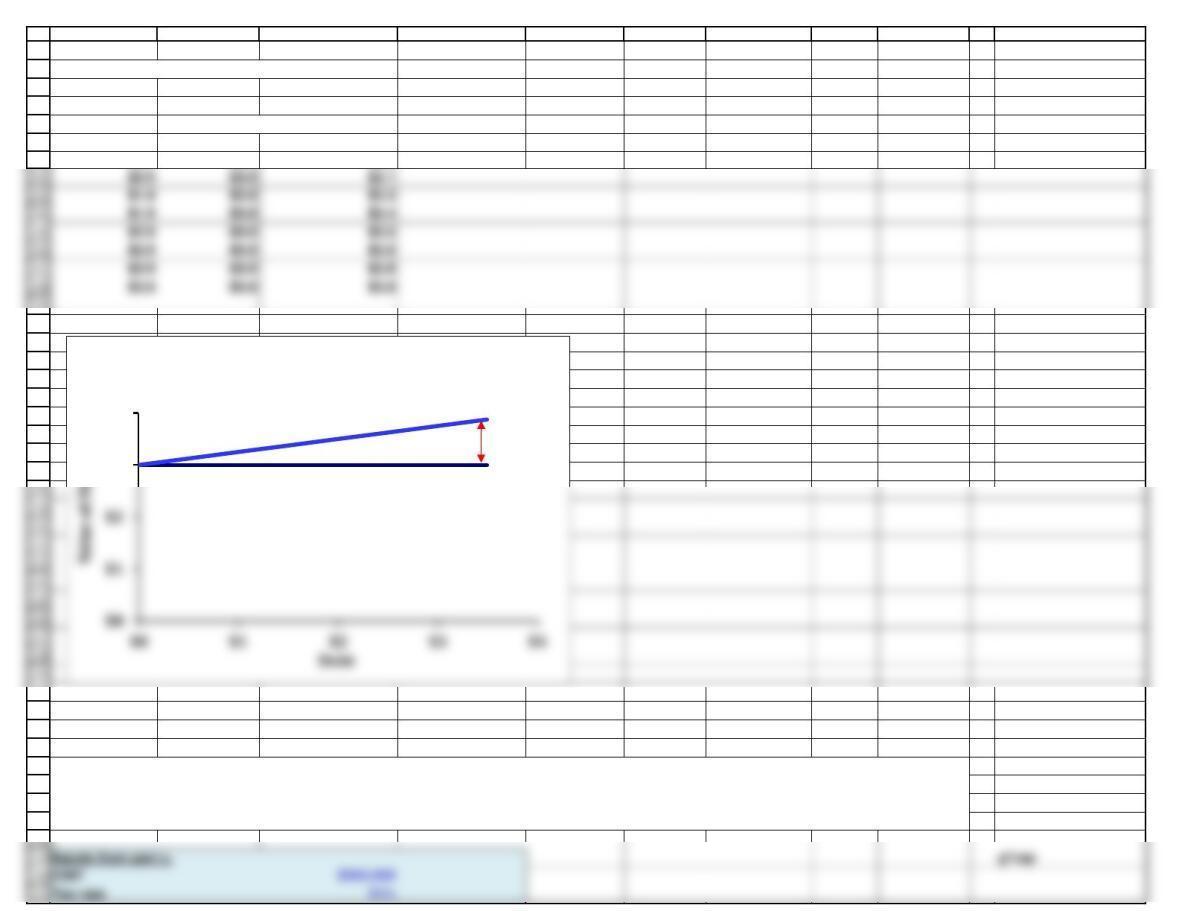
b(2): Graph (a) the relationships between capital costs and leverage as measured by D/V, and (b) the relationship between value and D.
20%
25%
Without Taxes
rs
$5 Without Taxes (Millions of Dollars)
rsU 14% 14% 14% 14%
93
94
95
96
97
98
99
112
113
114
115
116
117
118
126
127
128
129
130
131
A B C D E F G H I J K
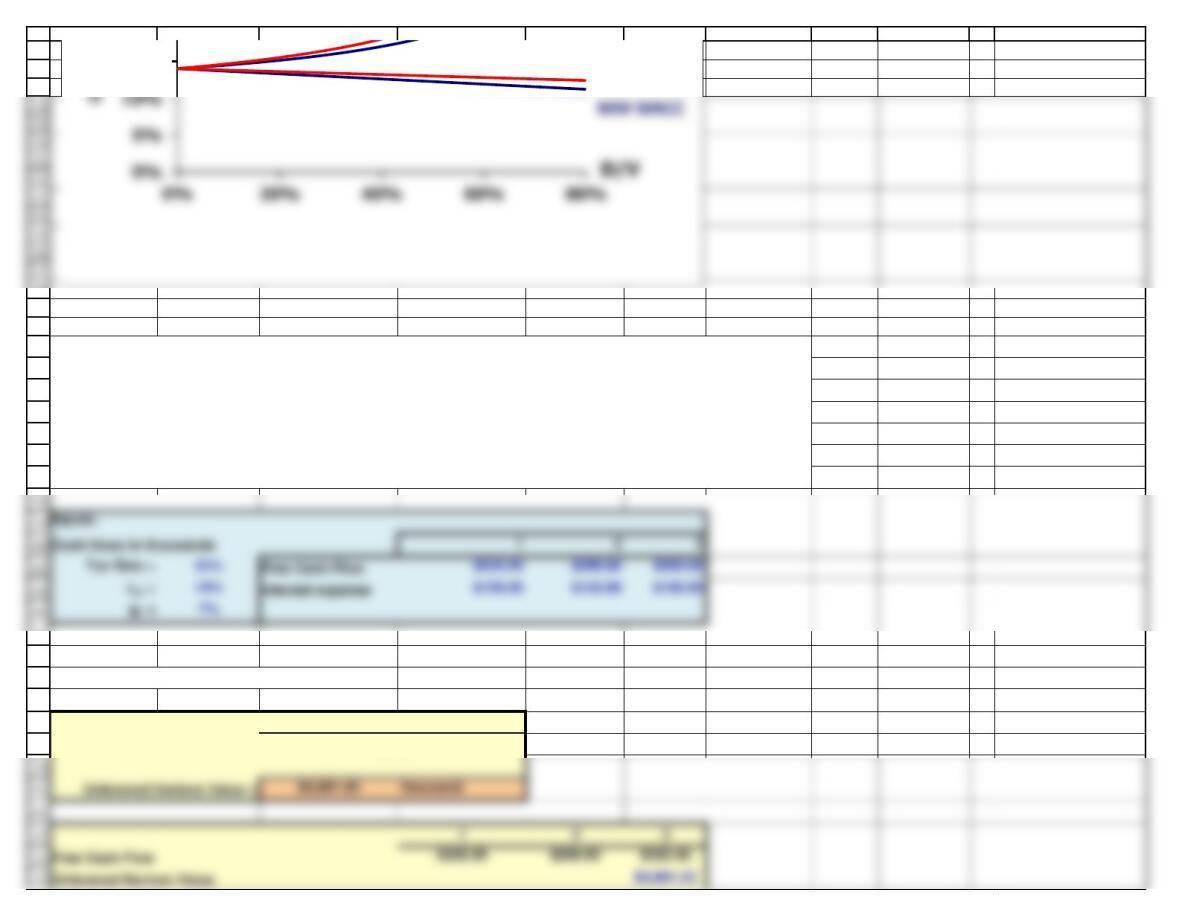
Modigliani and Miller with CorporateTaxes
Firm U Firm L 25% Tax Rate 25% Tax Rate
Input Data No Debt Some Debt No Debt Some Debt
EBIT $560,000 $560,000 $560,000 $560,000
Debt $0 $1,000,000 $0 $1,000,000
rd8.0% 8.0%
c. Using the data given in Part b, but now assuming that Firms L and U are both subject to a 25 percent corporate tax rate, repeat the
analysis called for in b(1) and b(2) under the MM with-tax model.
$3
$4
$5
Without Taxes (Millions of Dollars)
VU= VL
139
140
141
148
149
150
151
152
153
154
155
156
157
165
166
167
168
169
170
184
A B C D E F G H I J K
V Tax Shield
$0 $0 $0 $250,000
V Total $4,000,000 $4,000,000 $3,000,000 $3,250,000
S (V stock) $4,000,000 $3,000,000 $3,000,000 $2,250,000 V stock = V total – Debt
Effects of Leverage: MM Models
MM with Corporate Taxes (Millions of dollars)
Tc = 25.00%
DV S D/V
rdrd x (1-T) rsWACC
$0.00 $3.000 $3.000 0.00% 8.00% 6.00% 14.00% 14.00%
$0.50 $3.125 $2.625 16.00% 8.00% 6.00% 14.86% 13.44%
$1.00 $3.250 $2.250 30.77% 8.00% 6.00% 16.00% 12.92%
Value of Tax Shield = T x Debt
Value of Firm = Value of Unlevered Firm +T x Debt
50%
60%
With Taxes
rs
Tax rate
185
186
187
188
189
190
191
199
200
201
202
203
204
205
206
207
208
220
221
222
223
224
225
226
227
A B C D E F G H I J K
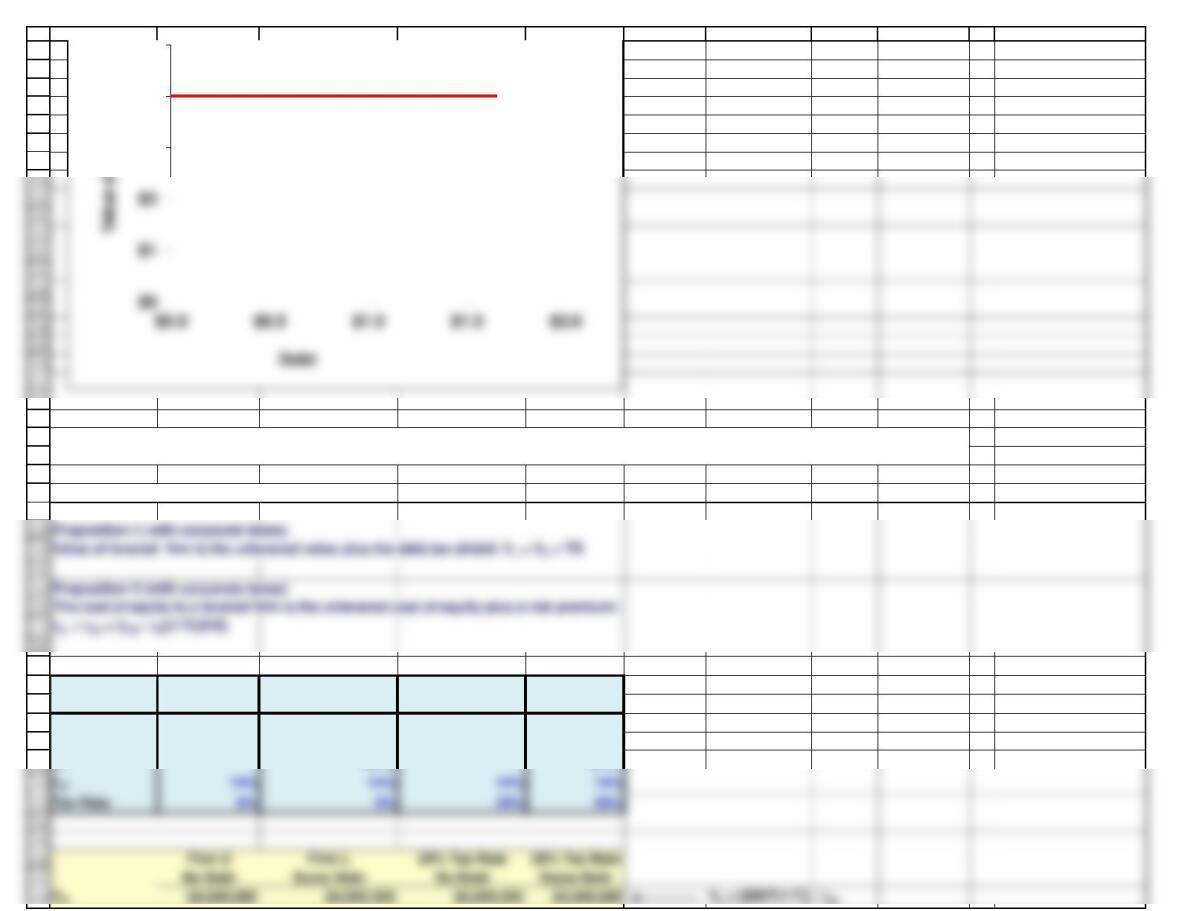
The Relationship Between Value and Debt
Debt T = 0 T = 25%
$0.0 $3.0 $3.0
Levered value
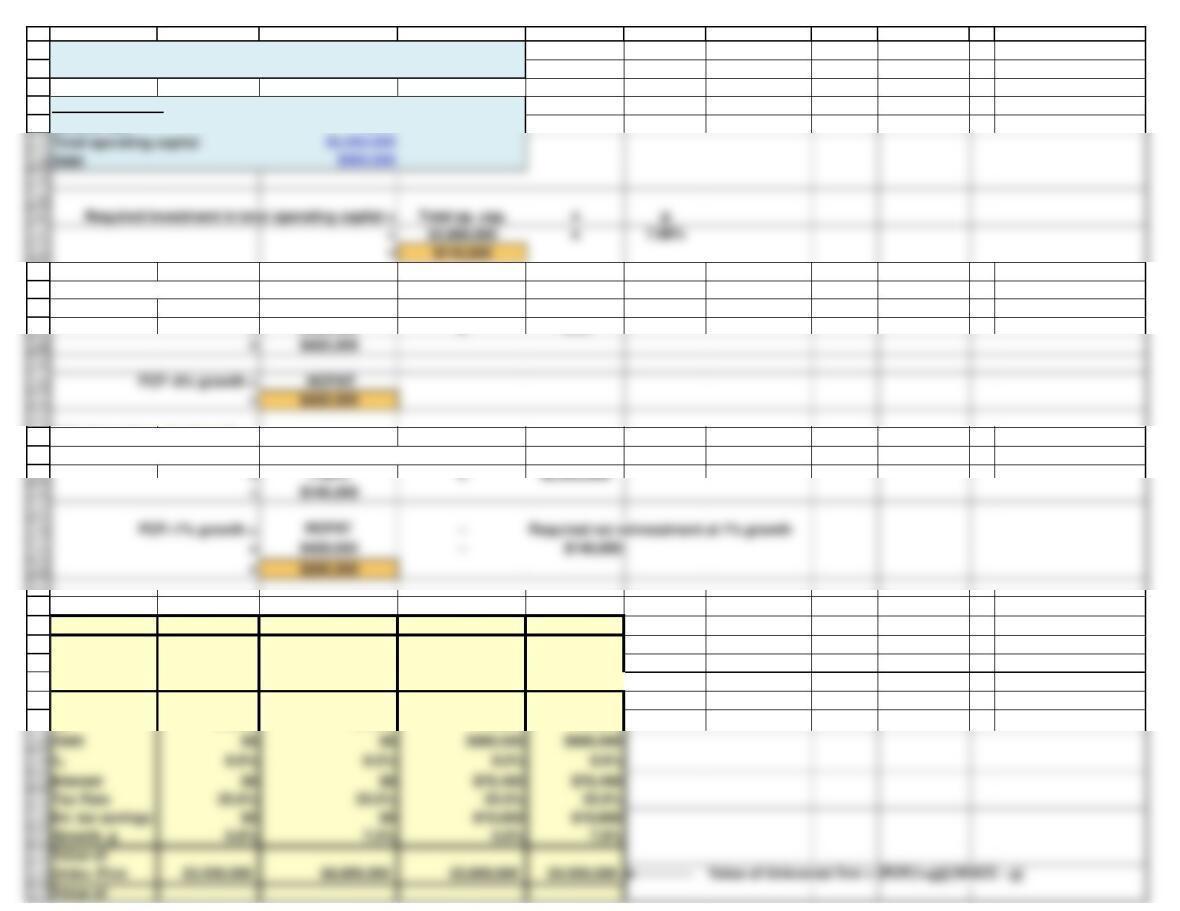
d. Suppose that Firms U and L have the same input values as in Part c except for debt of $980,000. Also, both firms have total net operating
capital of $2,000,000 and both firms are expected to grow at a constant rate of 7%. (Assume that the EBIT in Part c is expected at t = 1.) Use
the compressed adjusted present value (APV) model to estimate the value of U and L. Also estimate the levered cost of equity and the
weighted average cost of capital.
$3
$4
Value of a Levered Firm: The Impact of
Taxes and Debt (Millions of dollars)
VU
VL
TD
$0.5 $3.0 $3.1
$1.0 $3.0 $3.3
rd8.0% 8.0% 8.0% 8.0%
232
233
234
235
236
244
245
246
247
253
254
261
262
263
264
265
266
267
268
A B C D E F G H I J K
Unlevered cost of equity
14% = WACC if D = 0
Cost of debt
8%
Additional Inputs
Growth rate
7.00%
FCF Calculation: No Growth
NOPAT = EBIT x (1-T)
= $560,000 x 75%
FCF Calculation: 7% Growth
Required inv. in op. cap. = g x Total net operating capital
Firm U Firm U Firm L Firm L
25% Tax Rate 25% Tax Rate 25% Tax Rate 25% Tax Rate
zero Debt zero Debt some Debt some Debt
and no growth and 7% growth and no growth and 7% growth
Exp. FCF $420,000 $280,000 $420,000 $280,000
rsU 14.00% 14.00% 14.00% 14.00%
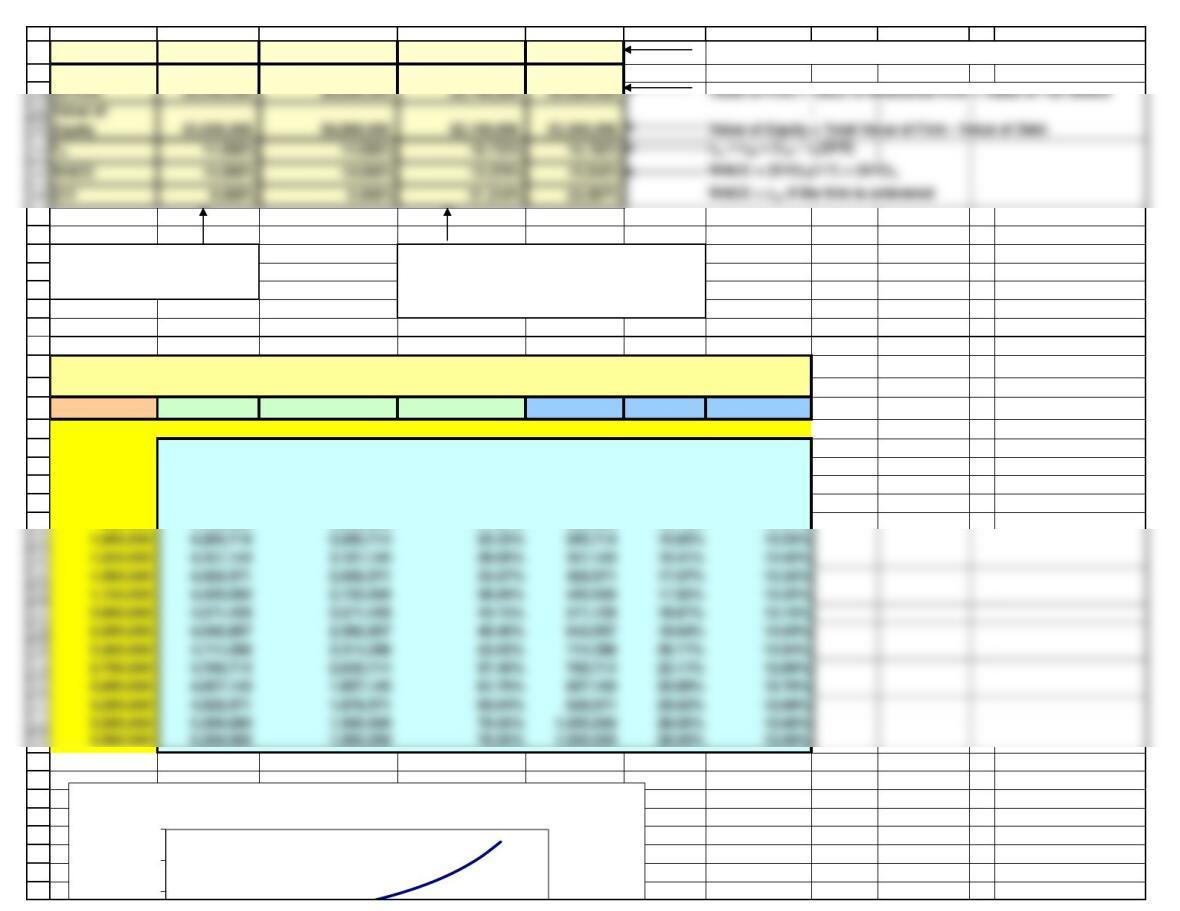
1,000,000 4,285,714 3,285,714 23.33% 285,714 15.83% 13.53%
1,250,000 4,357,143 3,107,143 28.69% 357,143 16.41% 13.43%
1,500,000 4,428,571 2,928,571 33.87% 428,571 17.07% 13.32%
1,750,000 4,500,000 2,750,000 38.89% 500,000 17.82% 13.22%
2,000,000 4,571,429 2,571,429 43.75% 571,429 18.67% 13.13%
2,250,000 4,642,857 2,392,857 48.46% 642,857 19.64% 13.03%
2,500,000 4,714,286 2,214,286 53.03% 714,286 20.77% 12.94%
3,000,000 4,857,143 1,857,143 61.76% 857,143 23.69% 12.76%
3,250,000 4,928,571 1,678,571 65.94% 928,571 25.62% 12.68%
3,500,000 5,000,000 1,500,000 70.00% 1,000,000 28.00% 12.60%
278
279
286
287
288
289
290
291
292
293
294
295
296
297
298
299
300
301
302
315
316
317
318
319
320
321
322
A B C D E F G H I J K
Tax Shield $0 $0 $140,000 $280,000
Value of Tax Shield = [(rd)(T)(D)(1+g)] / ( rU – g)
Total Value
CAPV with growth: rTS = rsU.growth = 7.00%
T = 25.00%
DV S D/V Tax shield
rsL WACC
$4,280,000 $3,300,000 22.897% $280,000 15.782% 13.542%
– 4,000,000 4,000,000 0.00% – 14.00% 14.00%
250,000 4,071,429 3,821,429 6.14% 71,429 14.39% 13.88%
500,000 4,142,857 3,642,857 12.07% 142,857 14.82% 13.76%
750,000 4,214,286 3,464,286 17.80% 214,286 15.30% 13.64%
980,000 4,280,000 3,300,000 22.90% 280,000 15.78% 13.54%
This column will NOT be the same as the
“25% tax rate, some debt” column from part c
because we are discounting the tax shield at
rsU instead of rd.
This column is the same as the
“25% tax rate no debt” column
from part c.
20%
25%
30%
Cost of capital
Cost of Capital with growth
WACC = (D/V)rd(1-T) + (S/V)rs
WACC = rsU if the firm is unlevered
14.50% 13.65% 14.67% 13.80%
14.79% 13.48% 15.06% 13.70%
15.13% 13.30% 15.50% 13.60%
15.50% 13.13% 16.00% 13.50%
323
333
334
335
336
337
338
342
343
344
345
346
347
348
349
350
351
352
353
358
359
360
361
362
367
A B C D E F G H I J K
Things to note:
2. The gain from debt is larger with growth than without growth.
The increase in the firm’s value as a result of $1,000,000 in debt over its unlevered value is:
7.00% of the unlevered value
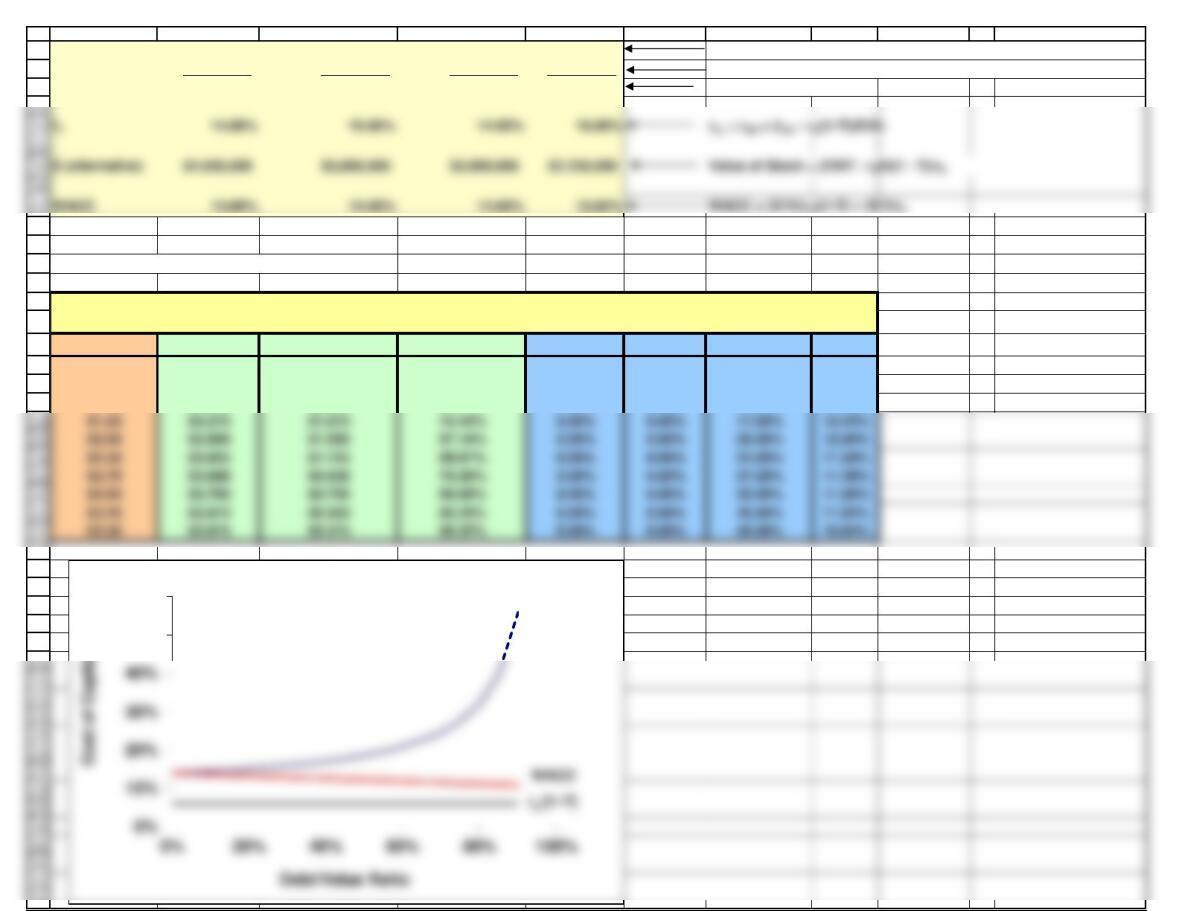
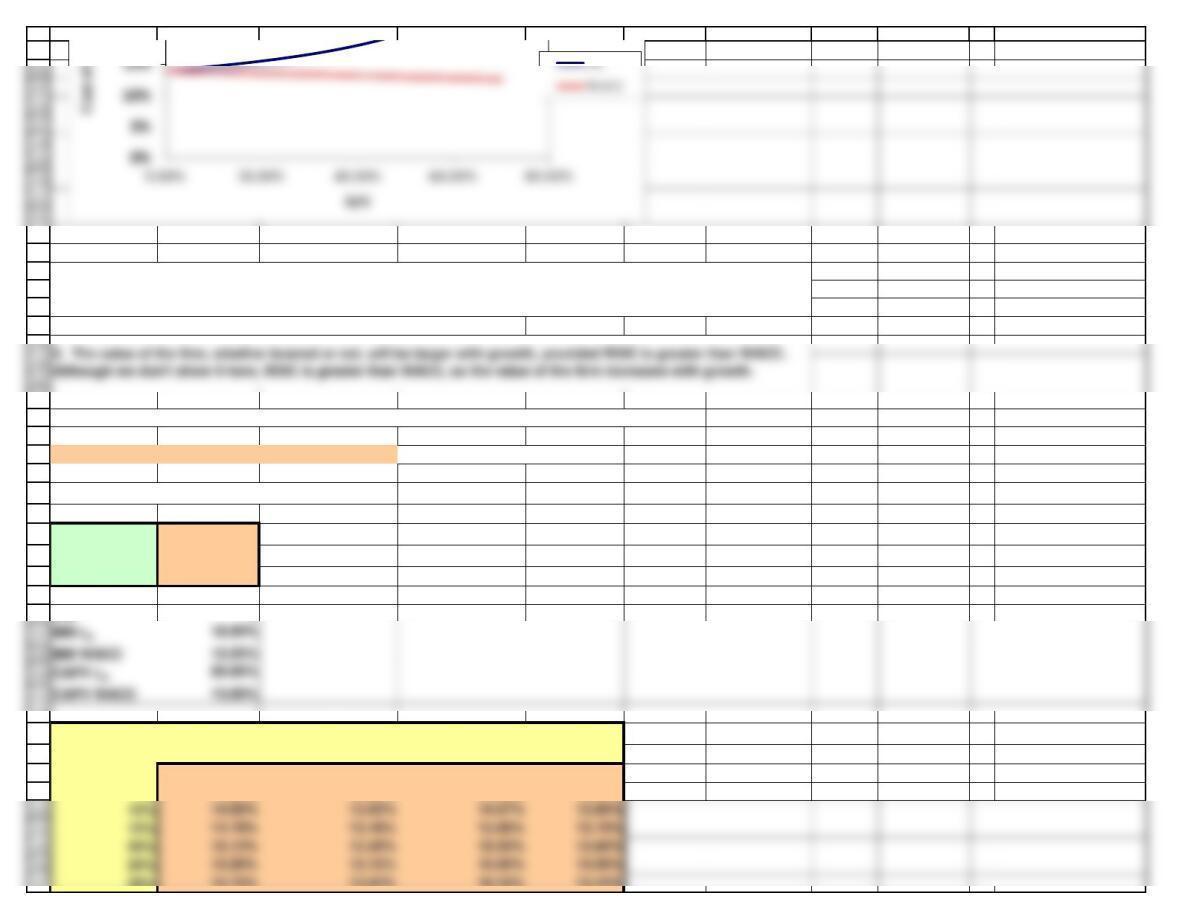
MM versus Compressed APV rsL and WACC
rd8.0%
rsU 14.00%
Tax Rate 25%
D/V
50%
D/S 1
MM rsL MM WACC APV rsL APV WACC
D/V
18.50% 12.25% 20.00% 13.00%
0%
14.00% 14.00% 14.00% 14.00%
5%
14.24% 13.83% 14.32% 13.90%
28%
15.75% 13.02% 16.33% 13.44%
Increase in value =
1. The gain from the tax shield will be lower using the compressed APV model than under MM because the CAPV
model discounts the interest tax shield at the unlevered cost of equity, which is larger than the cost of debt. The
MM model discounts the tax shield at the cost of debt.
20%
25.02% 11.52% 28.69% 12.58%
25.57% 11.48% 29.43% 12.56%
26.17% 11.45% 30.22% 12.54%
26.81% 11.41% 31.08% 12.52%
27.50% 11.38% 32.00% 12.50%
28.25% 11.34% 33.00% 12.48%
29.07% 11.31% 34.09% 12.46%
29.95% 11.27% 35.27% 12.44%
30.93% 11.24% 36.57% 12.42%
368
369
370
371
379
380
381
382
383
384
385
386
387
388
389
390
401
402
403
404
405
406
407
408
A B C D E F G H I J K
31%
16.02% 12.92% 16.70% 13.38%
34%
16.32% 12.81% 17.09% 13.32%
37%
16.64% 12.71% 17.52% 13.26%
40%
17.00% 12.60% 18.00% 13.20%
56%
19.73% 12.04% 21.64% 12.88%
58%
20.21% 11.97% 22.29% 12.84%
60%
20.75% 11.90% 23.00% 12.80%
61%
21.04% 11.87% 23.38% 12.78%
62%
21.34% 11.83% 23.79% 12.76%
63%
21.66% 11.80% 24.22% 12.74%
64%
22.00% 11.76% 24.67% 12.72%
65%
22.36% 11.73% 25.14% 12.70%
66%
22.74% 11.69% 25.65% 12.68%
67%
23.14% 11.66% 26.18% 12.66%
68%
23.56% 11.62% 26.75% 12.64%
69%
24.02% 11.59% 27.35% 12.62%
80%
32.00% 11.20% 38.00% 12.40%
35%
40%
Cost of Capital
Costs of Capital for MM and APV
APV rsL
17.26% 12.53% 18.34% 13.16%
17.54% 12.46% 18.71% 13.12%
17.83% 12.39% 19.11% 13.08%
18.15% 12.32% 19.54% 13.04%
18.50% 12.25% 20.00% 13.00%
18.88% 12.18% 20.50% 12.96%
19.28% 12.11% 21.04% 12.92%
415
416
417
428
429
430
431
432
433
434
435
436
437
444
445
446
447
448
449
A B C D E F G H I J K
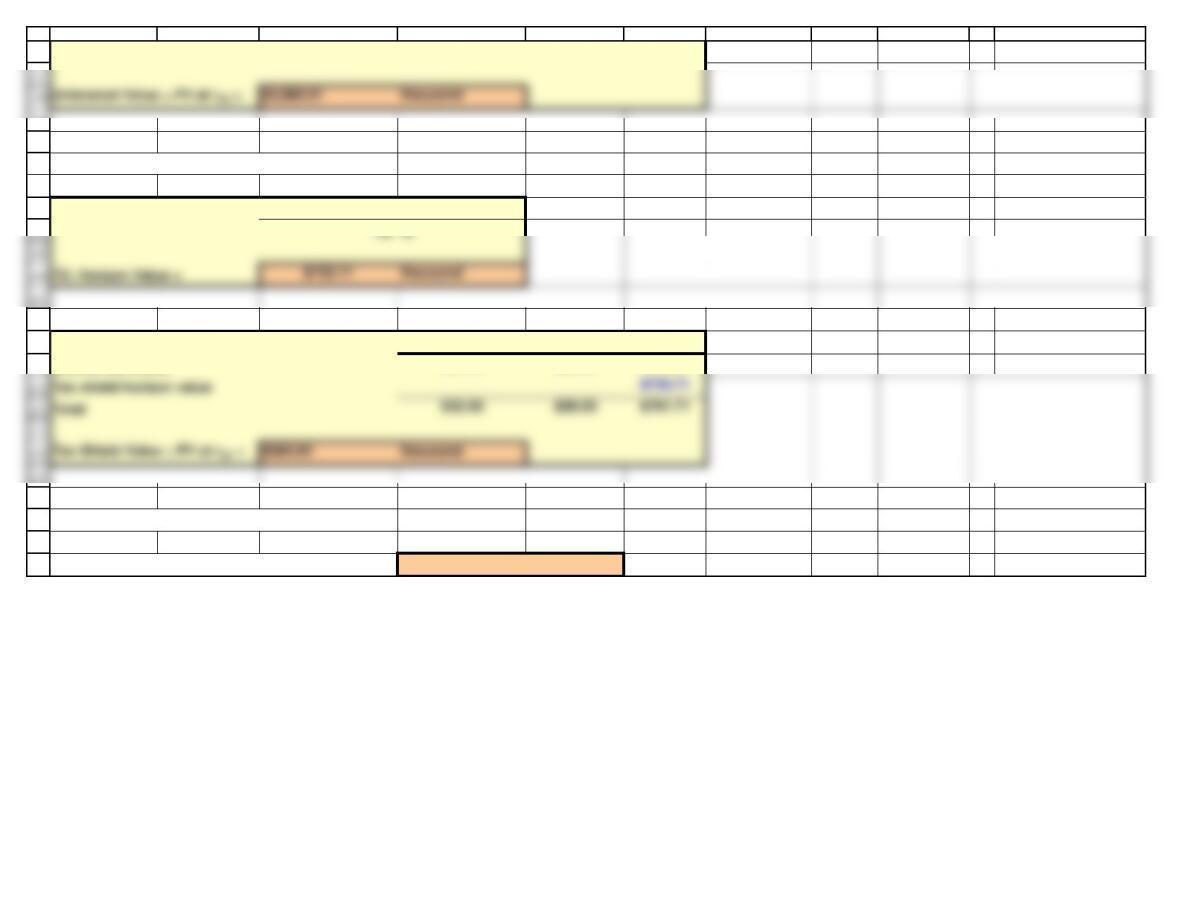
Estimate the unlevered value of operations
rsU – g
Unlevered Horizon Value =
e. Suppose the expected free cash flow for Year 1 is $250,000 but it is expected to grow faster than 7% during the
next 3 years: FCF2 = $290,000 and FCF3 = $320,000, after which it will grow at a constant rate of 7%. The expected
interest expense at Year 1 is $128,000, but it is expected to grow over the next couple of years before the capital
structure becomes constant: Interest expense at Year 2 will be $152,000, at Year 3 it will be $192,000 and it will
grow at 7% thereafter. What is the estimated horizon unlevered value of operations (i.e., the value at Year 3
immediately after the FCF at Year 3)? What is the current unlevered value of operations? What is the horizon value
of the tax shield at Year 3? What is the current value of the tax shield? What is the current total value? The tax rate
and unlevered cost of equity remain at 25% and 14%, respectively.
(Free Cash Flow)(1+g)
APV WACC
15%
20%
456
459
460
461
462
463
468
469
470
476
477
478
479
A B C D E F G H I J K
Total
$250.00 $290.00 $5,211.43
Estimate the value of the tax shield
1 2 3
Interest tax shield
$32.00 $38.00 $48.00
Estimate the total value of operations
Vops = Tax shield value + Unlevered value = $4,544.95 thousand
( Tax Shield)(1+g)
Tax Shield Horizon Value =
rsU – g