Chapter 20
Bank Performance
Outline
Valuation of a Commercial Bank
Factors That Affect Cash Flows
Impact of the Credit Crisis on Bank Valuations
Assessing Bank Performance
Interest Income and Expenses
Evaluation of a Bank’s ROA
Reasons for a Low ROA
Chapter 20: Bank Performance ❖ 2
Key Concepts
2. Explain how performance is influenced by management decisions, which is influenced by their
abilities to recognize risk and their incentives to take risk.
3. Explain how to evaluate a bank’s performance.
POINT/COUNTER-POINT:
Does a Bank’s Income Statement Clearly Indicate the Bank’s Performance?
POINT: Yes. The bank’s income statement can be analyzed to determine its performance and the
underlying reasons for its performance.
WHO IS CORRECT? Use the Internet to learn more about this issue and then formulate your own
opinion.
ANSWER: There is some degree of manipulation that is possible for banks, but regulatory oversight may
Questions
1. Interest Income. How can gross interest income rise, while the net interest margin remains
somewhat stable for a particular bank?
ANSWER: Gross expenses may rise during periods in which gross interest income rises, as both
2. Impact on Income. If a bank shifts its loan policy to pursue more credit card loans, how will its net
interest margin be affected?
3. Noninterest Income. What has been the trend in noninterest income in recent years? Explain.
ANSWER: Noninterest income increased during the 1990s, as banks were providing more financial
Chapter 20: Bank Performance ❖ 3
4. Net Interest Margin. How could a bank generate higher income before tax (as a percentage of
assets) when its net interest margin has decreased?
5. Net Interest Income. Suppose the net income generated by a bank is equal to 1.5 percent of assets.
Based on past experience, would the bank experience a loss or a gain? Explain.
6. Noninterest Income. Why have large money center banks’ noninterest income levels typically been
higher than those of smaller banks?
ANSWER: Money center banks have higher noninterest income levels (as a percentage of assets)
7. Bank Leverage. What does the assets/equity ratio of a bank indicate?
ANSWER: A bank’s assets/equity ratio is a measure of financial leverage, because it indicates how
8. Analysis of a Bank’s ROA. What are some of the more common reasons for a bank to experience a
low ROA?
ANSWER: A low ROA could occur because of excessive interest expenses, excessive noninterest
9. Loan Loss Provisions. Explain why the loan loss provisions of most banks could increase in a
particular period.
10. Bank Performance During the Credit Crisis. Why do you think some banks suffered larger losses
during the credit crisis than other banks?
ANSWER: Some banks suffered larger losses because they were more exposed to mortgage loans
11. Weak Performance. What are likely reasons for weak bank performance?
12. Bank Income Statement. Assume that SUNY Bank plans to liquidate Treasury security holdings and
use the proceeds for small business loans. Explain how this strategy will affect the different income
statement items. Also identify any income statement items for which the effects of this strategy are
more difficult to estimate.
Chapter 20: Bank Performance ❖ 4
ANSWER: Gross interest income would be expected to increase because small business loans
generate higher interest revenues (assuming the loans are repaid). Noninterest expenses may increase
CRITICAL THINKING QUESTION
Bank Non-Interest Income In recent years, many banks are relying more heavily on non-interest income
as a proportion of their total income. Write a short essay explaining whether banks that rely more heavily
on non-interest income will have better or worse performance than banks that rely more heavily on
traditional sources of income (such as loans)?
ANSWER
Banks that pursue non-traditional sources of income can generate more fee income, and this helps them to
Interpreting Financial News
Interpret the following statements made by Wall Street analysts and portfolio managers.
a. “The three most important factors that determine a local bank’s bad debt level are the bank’s
location, location, and location.”
b. “The bank’s profitability was enhanced by its limited use of capital.”
The bank has a high degree of financial leverage so that its return on assets (ROA) converts into
c. “Low risk is not always desirable. Our bank’s risk has been too low, given the market conditions.
We will restructure operations in a manner to increase risk.”
The bank expects that the economy will be strong, so it can make more loans to customers that
Chapter 20: Bank Performance ❖ 5
Managing in Financial Markets
As a manager of Hawaii Bank, you anticipate the following information provided to you:
Loan loss provision at end of year = 1 percent of assets
Gross interest income over the next year = 9 percent of assets
a. Forecast Hawaii Bank’s net interest margin.
Net interest margin is 4 percent (see income statement in the answer to part e).
b. Forecast Hawaii Bank’s earnings before taxes as a percentage of assets.
c. Forecast Hawaii Bank’s earnings after taxes as a percentage of assets.
Earnings after taxes as a percent of assets are 0.7 percent (see income statement in the answer to
part e).
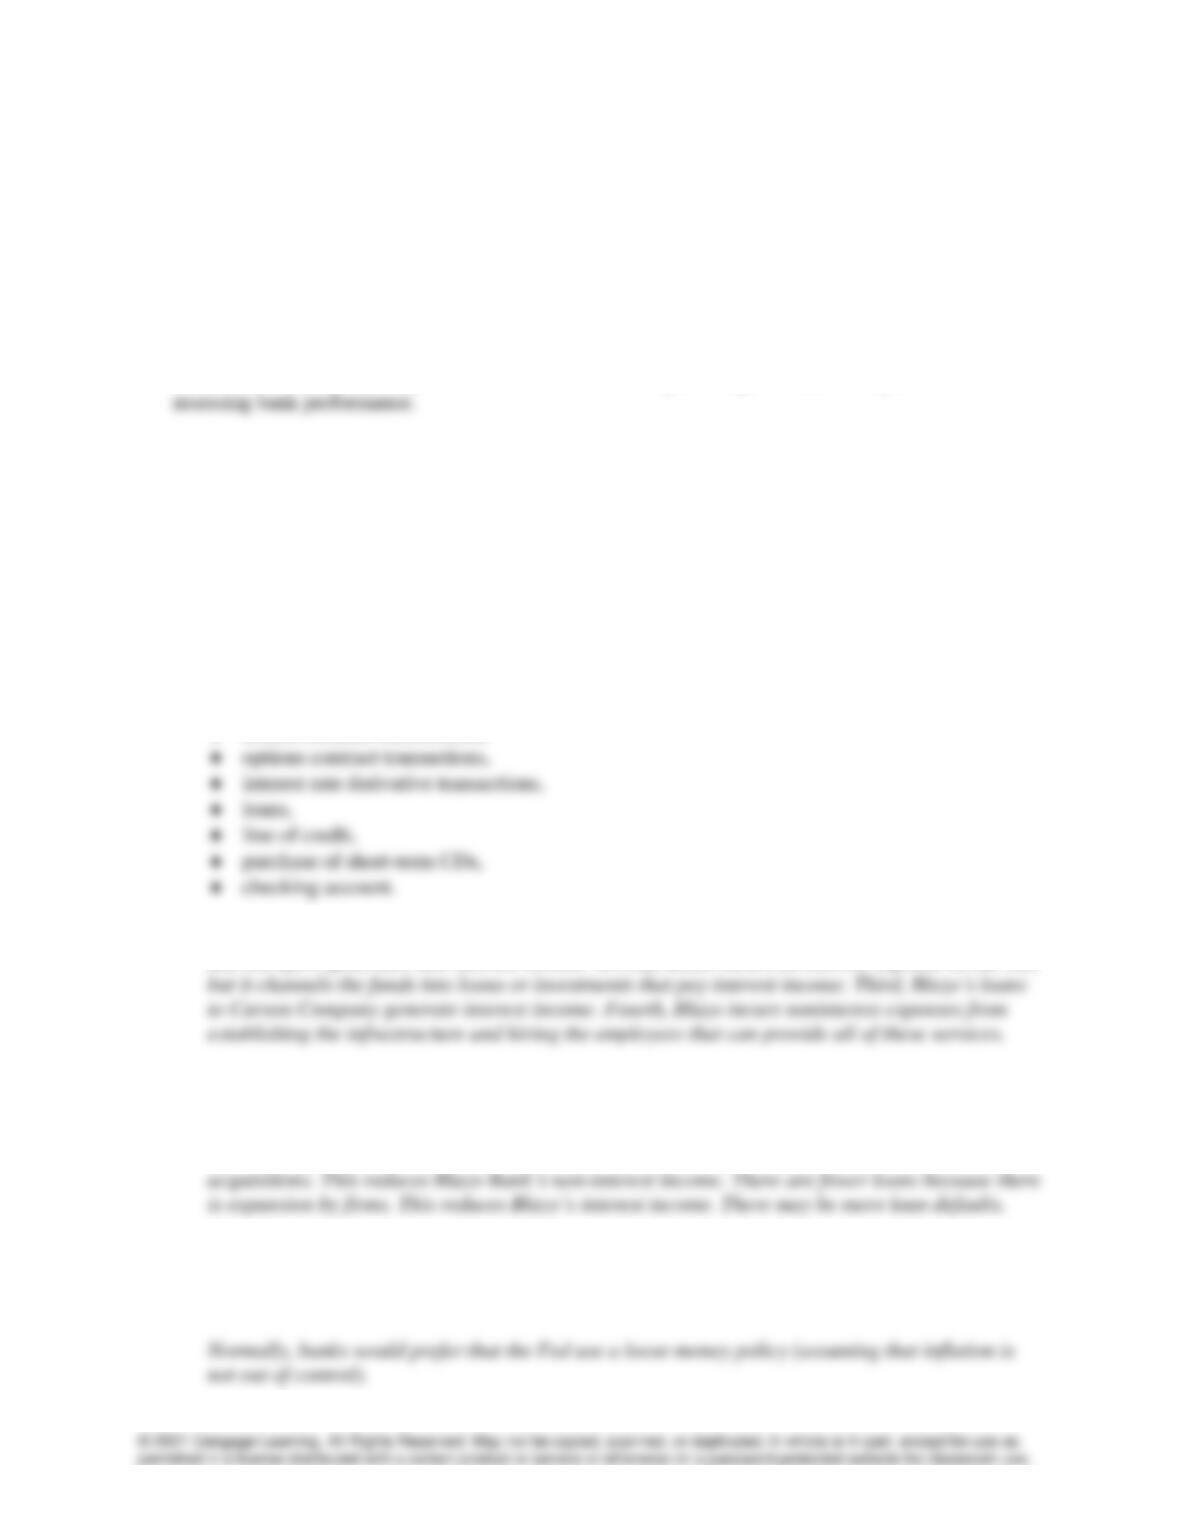
d. Forecast Hawaii Bank’s return on equity.
Gross interest income is now expected to be higher. Noninterest expenses are now expected to be
higher because of increased efforts on loan evaluation. Loan losses are expected to be higher.
Amount as a Percent of Assets
Gross interest income 9%
Gross interest expense – 5%
Chapter 20: Bank Performance ❖ 6
Problems
1. Assessing Bank Performance. Select a commercial bank whose income statement data are available.
Using recent income statement data about that bank, assess its performance. How does the
performance of this bank compare to the performance of other banks? Compared with other banks, is
its return on equity higher or lower than the ROE of other banks as reported in this chapter? What is
the main reason why its ROE is different from the norm? (Is it due to its interest expenses? Its
noninterest income?)
ANSWER: Answer will vary with the bank chosen. This question gives students experience in
Flow of Funds Exercise
How the Flow of Funds Affects Bank Performance
In recent years, Carson Company has requested the services listed in part (a) from Blazo Financial, a
financial conglomerate. These transactions have created a flow of funds between Carson Company and
Blazo.
a. Classify each service according to how Blazo benefits from the service.
advising on possible targets that Carson may acquire,
All the services except for the purchase of short-term CDs may generate fees for Blazo Financial,
b. Explain why Blazo’s performance from providing these services to Carson Company and other
firms will decline if economic growth is reduced.
If economic growth is reduced, the demand for advisory services, because there are less
c. Given the potential impact of slow economic growth on a bank’s performance, do you think that
commercial banks would prefer that the Fed use a restrictive monetary policy or an expansionary
monetary policy?
Chapter 20: Bank Performance ❖ 7
Solution to Integrative Problem for Part 6
Forecasting Bank Performance
1. The interest income and expenses are determined by applying the specified interest rate on each asset
The noninterest income and expenses were given in the question. The loan losses are determined by
applying the assumed loan loss percentage to the dollar amount of each type of loan. The ROA for
each of the three Treasury bill rate scenarios is derived in the following table:
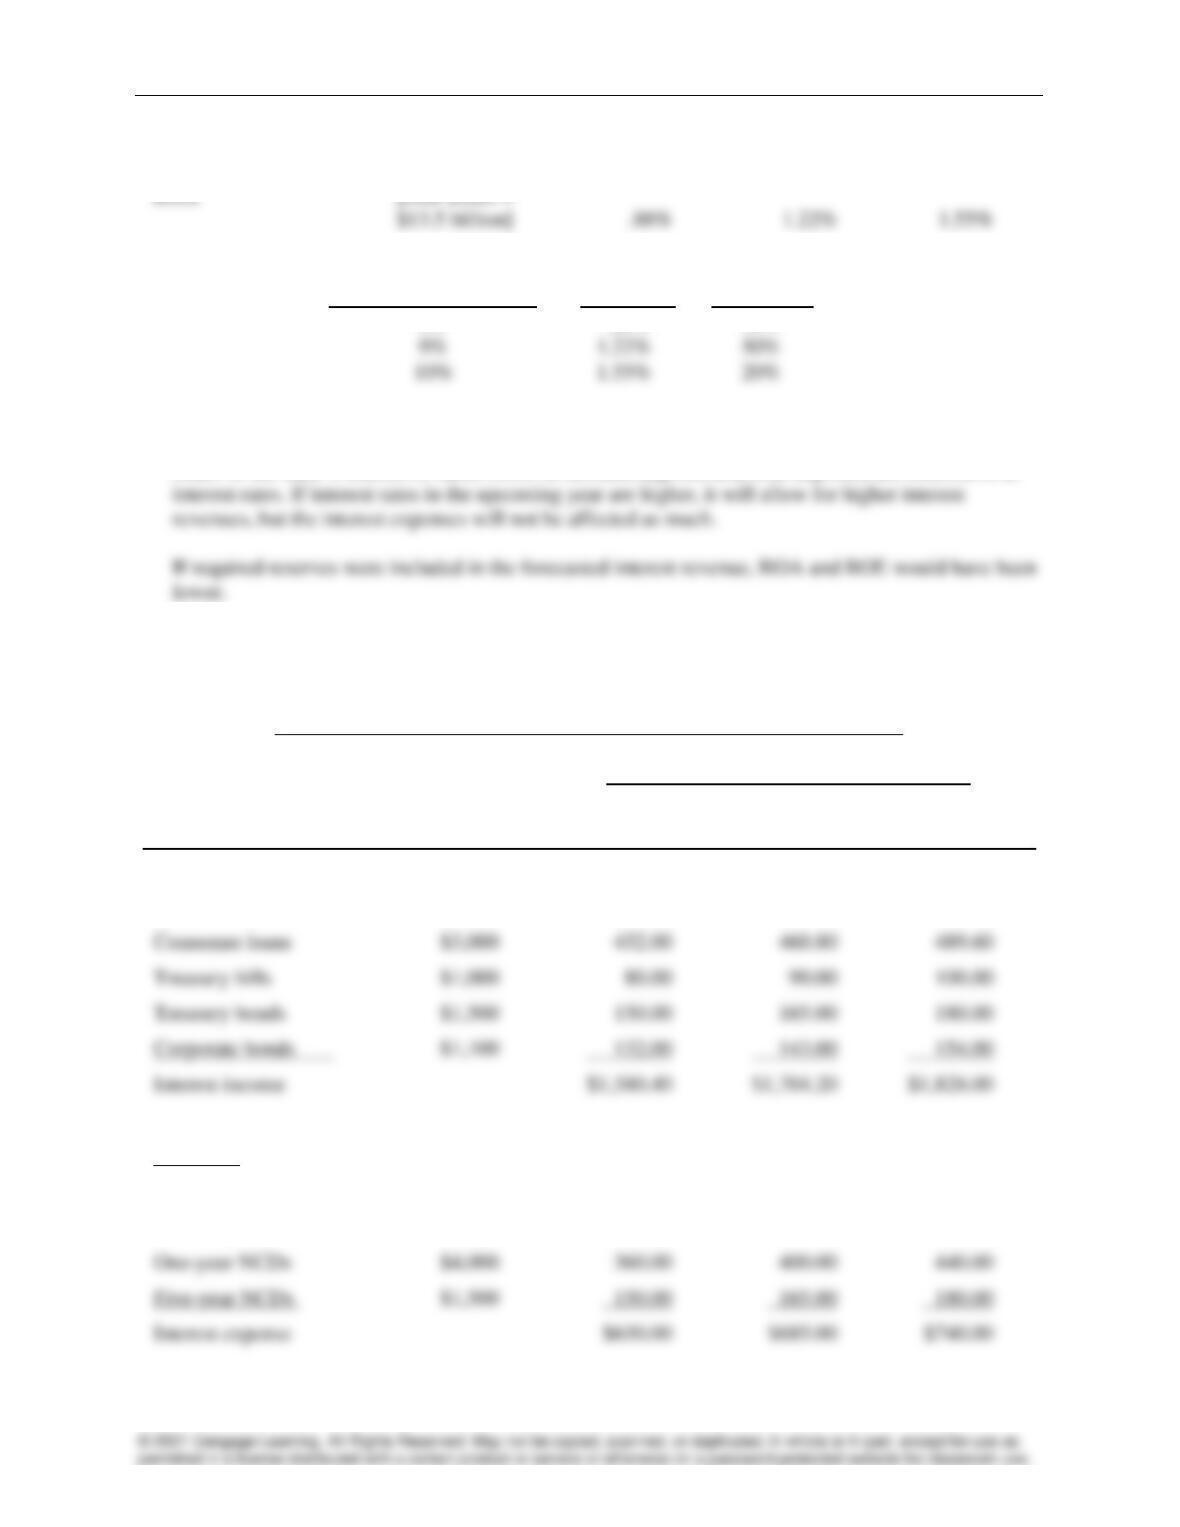
Income and Expenses (in millions) Based on Treasury Bill Rate Scenarios
Possible Treasury Bill Rate
Assets
Amount in
Millions
8%
9%
10%
Small business loans
$4,000
548.80
588.00
627.20
Large business loans
$2,000
237.60
257.40
277.20
Consumer loans
Treasury bills
$1,000
100.00
Treasury bonds
$1,500
150.00
165.00
180.00
Corporate bonds
$1,100
Interest income
Liabilities
Demand deposits
$5,000
0
0
0
Time deposits
$2,000
120.00
120.00
120.00
One-year NCDs
$3,000
270.00
300.00
330.00
Five-year NCDs
$2,500
Interest expense
Noninterest income
200.00
200.00
200.00
Noninterest expenses
740.00
740.00
740.00
Loan losses
Income before taxes
180.40
249.20
318.00
Tax (34%)
Chapter 20: Bank Performance ❖ 8
Net income
$119.10
$164.50
$209.90
$13.5 billion]
Interest Rate Scenario Forecasted
(Possible T-bill Rate) ROA Probability
2. Next year’s ROA will be higher if interest rates are higher as of the beginning of the year.
3. The two NCD expense items change, allowing for slightly lower total interest expenses and therefore
a slightly higher ROA, as shown in the following table:
Income and Expenses (in millions) Based on Treasury Bill Rate Scenarios
Possible Treasury Bill Rate
Assets
Amount in
Millions
8%
9%
10%
Small business loans
$4,000
548.80
588.00
627.20
Large business loans
$2,000
237.60
257.40
277.20
Consumer loans
$3,000
432.00
460.80
489.60
Treasury bills
$1,000
100.00
Treasury bonds
$1,500
150.00
165.00
180.00
Corporate bonds
$1,100
Interest income
Liabilities
Demand deposits
$5,000
0
0
0
Time deposits
$2,000
120.00
120.00
120.00
One-year NCDs
$4,000
360.00
400.00
440.00
Interest expense
$630.00
$685.00
$740.00
Chapter 20: Bank Performance ❖ 9
Noninterest income
200.00
200.00
200.00
Noninterest expenses
740.00
740.00
740.00
Loan losses
220.00
220.00
220.00
Income before taxes
190.40
259.20
328.00
Tax (34%)
64.70
88.10
111.50
Net income
$125.70
$171.10
$216.50
ROA
[total assets =
$13.5 billion]
.93%
1.26%
1.60%
Interest Rate Scenario Forecasted
(Possible T-bill Rate) ROA Probability
4. Higher.
Income and Expenses (in millions) Based on Treasury Bill Rate Scenarios
Possible Treasury Bill Rate
Assets
Amount in
Millions
8%
9%
10%
Small business loans
$5,000
686.00
735.00
784.00
Large business loans
$2,000
237.60
257.40
277.20
Treasury bills
0
0
Treasury bonds
$1,500
150.00
165.00
180.00
Corporate bonds
$1,100
Interest income
Liabilities
Demand deposits
$5,000
0
0
0
Chapter 20: Bank Performance ❖ 10
Time deposits
$2,000
120.00
120.00
120.00
One-year NCDs
$3,000
270.00
300.00
330.00
Five-year NCDs
$2,500
250.00
275.00
300.00
Interest expense
$640.00
$695.00
$750.00
Noninterest income
200.00
200.00
200.00
Noninterest expenses
740.00
740.00
740.00
Loan losses
220.00
240.00
220.00
Income before taxes
217.60
286.20
354.80
Tax (34%)
Net income
$143.60
$188.90
$234.20
ROA
[total assets =
$13.5 billion]
1.06%
1.40%
1.73%
Forecasted ROA if an
Extra $1 Billion is
Interest Rate Scenario Used for Loans to
(Possible T-bill Rate) Small Businesses Probability
8% 1.06% 30%
7. Higher.
8. The default rate on consumer loans may increase in the following years, causing the bank’s ROA to
be lower with the extra consumer loans than it would have been if it purchased Treasury bills.
10. The interest income is higher as a result of the increased allocation of consumer loans, but loan losses
are larger. The effects are offsetting to a degree, so that the ROA is adjusted just slightly, as shown in
the following table:
Income and Expenses (in millions) Based on Treasury Bill Rate Scenarios
Possible Treasury Bill Rate
Assets
Amount in
Millions
8%
9%
10%
Small business loans
$4,000
548.80
588.00
627.20
Chapter 20: Bank Performance ❖ 11
Large business loans
$1,000
118.80
128.70
138.60
Consumer loans
$4,000
576.00
614.40
652.80
Treasury bills
$1,000
100.00
Treasury bonds
$1,500
150.00
165.00
180.00
Corporate bonds
$1,100
Interest income
Liabilities
Demand deposits
$5,000
0
0
0
One-year NCDs
$4,000
360.00
400.00
440.00
Five-year NCDs
$1,500
Interest expense
Noninterest income
200.00
200.00
200.00
Noninterest expenses
740.00
740.00
740.00
Loan losses
250.00
250.00
250.00
Income before taxes
175.60
244.10
312.60
Tax (34%)
59.70
83.00
106.30
Net income
$13.5 billion]
Chapter 20: Bank Performance ❖ 12
Possible ROA if an
Interest Rate Scenario Extra $1 Billion is
(Possible T-bill Rate) Used for Consumer Loans Probability
8% .86% 30%
11. If interest rates rise after the loans are provided, the interest received on consumer loans will be
12. Interest Rate
Scenario Forecasted ROE Forecasted ROE
(Possible T- if Capital = if Capital =
bill Rate $1 Billion $1.2 Billion Probability
9% 16.47% 13.73% 50%