Answers and Solutions: 2 – 1
Chapter 2
Risk and Return: Part I
ANSWERS TO BEGINNING-OF-CHAPTER QUESTIONS
Our students have had an introductory finance course, and many have also taken a course on
investments and/or capital markets. Therefore, they have seen the Chapter 2 material previously.
However, we use the Beginning of Chapter (BOC) questions to review the chapter because our
students need a refresher.
With students who have not had as much background, it is best to go through the chapter on a
Our students have mainly taken multiple-choice exams, so they are uncomfortable with essay
tests. Also, we cover the chapters they were exposed to in the intro course rather quickly, so our
assignments often cover a lot of pages. We explain that much of the material is a review, and
that if they can answer the BOC questions (after the class discussion) they will do OK on the
exams. We also tell them, partly for motivation and partly to reduce anxiety, that our exams will
consist of 5 slightly modified BOC questions, of which they must answer 3. We also tell them
that they can use a 4-page “cheat sheet,” two sheets of paper, front and back. They can put
We initially expected really excellent exams, given that the students had the questions and could
use cheat sheets. Some of the exams were indeed excellent, but we were surprised and
disappointed at the poor quality of many of the midterm exams. Part of the problem is that our
students were not used to taking essay exams. Also, they would have done better if they had
taken the exam after we covered cases (in the second half of the semester), where we apply the
text material to real-world cases. While both points are true, it’s also true that some students are
just better than others.
Answers
2-1 Stand-alone risk is the risk faced by an investor who holds just one asset, versus the risk
inherent in a diversified portfolio.
Stand-alone risk is measured by the standard deviation (SD) of expected returns or the
coefficient of variation (CV) of returns = SD/expected return.
Answers and Solutions: 2 – 3
2-2 Diversification can eliminate unsystematic risk, but market risk will remain. See Figure 2-
6 for a picture of what happens as stocks are added to a portfolio. The graph shows that
the risk of the portfolio as measured by its SD declines as more and more stocks are added.
This is the situation if randomly selected stocks are added, but if stocks in the same industry
2-3 a. Note: This question is covered in more detail in Chapter 8, but students should
remember this material from their first finance course, so it is a review.
Expected: The rate of return someone expects to earn on a stock. It’s typically
measured as D1/P0 + g for a constant growth stock.
Answers and Solutions: 2 – 4
b. Are the 3 types of return equal? 1) Expected = required?. The answer is, “maybe.” For
the market to be in equilibrium, the expected and required rate of return as seen by “the
marginal investor” must be equal for any given stock and therefore for the entire
market. If the expected return exceeded the required return, then investors would buy,
2) Historical = expected and/or required? There is no reason whatever to think that
the historical rate of return for any given year for either one stock or for all stocks on
average will be equal to the expected and/or required rate of return. Rational people
don’t expect abnormally good or bad performance to continue. On the other hand,
2-4 To be risk averse means to dislike risk. Most investors are risk averse. Therefore, if
Securities A and B both have an expected return of say 10%, but Security A has less risk
than B, then most investors will prefer A. As a result, A’s price will be bid up, and B’s
price bid down, and in the resulting equilibrium A’s expected rate of return will be below
that of B. Of course, A’s required rate of return will also be less than B’s, and in
2-5 CAPM = Capital Asset Pricing Model. The CAPM establishes a metric for measuring the
market risk of a stock (beta), and it specifies the relationship between risk as measured by
beta and the required rate of return on a stock. Its principal developers (Sharpe and
Markowitz) won the Nobel Prize in 1990 for their work.
The key assumptions are spelled out in Chapter 3, but they include the following: (1)
2-6 a. Given historical returns on X, Y, and the Market, we could calculate betas for X and
Y. Then, given rrf and the MRP, we could use the SML equation to calculate X and
Y’s required rates of return. We could then compare these required returns with the
given expected returns to determine if X and Y are bargains, bad deals, or in
equilibrium.
Answers and Solutions: 2 – 6
b. Here we drop Year 1 and add Year 6, then calculate new betas and r’s. For Stock X,
the beta and required return would be reasonably stable. However, Y’s beta would fall,
given its sharp decline in a year when the market rose. In our Excel model, Y’s beta
falls from 1.66 to 0.19, and its required return as calculated with the SML falls to 8.8%.
The results for Y make little sense. The stock fell sharply because investors became
worried about its future prospects, which means that it fell because it became riskier.
Note that in April 2001, the same month that PG&E declared bankruptcy, its beta
as reported by Finance.Yahoo was only 0.05, so our hypothetical Stock Y did what the
real PG&E actually did. The moral of the story is that the CAPM, like other cost of
capital estimating techniques, can be dangerous if used without care and judgment.
One final point on all this: The utilities are regulated, and regulators estimate their
Answers and Solutions: 2 – 7
2-7 a. If technical trading rules could generate abnormal profits for an investor, then the
market would not even be weak form efficient. Finance researchers believe that markets
are at least weak form efficient because there are tens of thousands of analysts poring
b. If fundamental analysis cannot generate abnormal profits, then the market is said to be
semi-strong form efficient.
c. If insider trading cannot generate abnormal profits, then the market is said to be strong
form efficient. Strong form efficiency means that the stock market’s prices impound
all information about the stock, no matter how well kept the secret is.
Answers and Solutions: 2 – 8
ANSWERS TO END-OF-CHAPTER QUESTIONS
2-1 a. Stand-alone risk is only a part of total risk and pertains to the risk an investor takes by
holding only one asset. Risk is the chance that some unfavorable event will occur. For
b. The expected rate of return (^
r ) is the expected value of a probability distribution of
expected returns.
c. A continuous probability distribution contains an infinite number of outcomes and is
graphed from – and +.
f. A risk premium is the difference between the rate of return on a risk-free asset and the
expected return on Stock i which has higher risk. The market risk premium is the
difference between the expected return on the market and the risk-free rate.
Answers and Solutions: 2 – 9
h. The expected return on a portfolio.
r
p, is simply the weighted-average expected return
of the individual stocks in the portfolio, with the weights being the fraction of total
portfolio value invested in each stock. The market portfolio is a portfolio consisting of
all stocks.
j. Market risk is that part of a security’s total risk that cannot be eliminated by
diversification. It is measured by the beta coefficient. Diversifiable risk is also known
as company specific risk, that part of a security’s total risk associated with random
events not affecting the market as a whole. This risk can be eliminated by proper
diversification. The relevant risk of a stock is its contribution to the riskiness of a well-
diversified portfolio.
m. The slope of the SML equation is (rM – rRF), the market risk premium. The slope of the
SML reflects the degree of risk aversion in the economy. The greater the average
investors aversion to risk, then the steeper the slope, the higher the risk premium for all
stocks, and the higher the required return.
Answers and Solutions: 2 – 10
n. Equilibrium is the condition under which the expected return on a security is just equal
to its required return,
r
= r, and the market price is equal to the intrinsic value. The
Efficient Markets Hypothesis (EMH) states (1) that stocks are always in equilibrium
and (2) that it is impossible for an investor to consistently “beat the market.” In essence,
the theory holds that the price of a stock will adjust almost immediately in response to
o. The Fama-French 3-factor model has one factor for the excess market return (the
market return minus the risk free rate), a second factor for size (defined as the return
on a portfolio of small firms minus the return on a portfolio of big firms), and a third
p. Most people don’t behave rationally in all aspects of their personal lives, and behavioral
finance assumes that investors have the same types of psychological behaviors in their
2-2 a. The probability distribution for complete certainty is a vertical line.
2-3 Security A is less risky if held in a diversified portfolio because of its lower beta and
2-4 The risk premium on a high beta stock would increase more.
2-5 According to the Security Market Line (SML) equation, an increase in beta will increase a
company’s expected return by an amount equal to the market risk premium times the
Answers and Solutions: 2 – 12
SOLUTIONS TO END-OF-CHAPTER PROBLEMS
2-1 Investment Beta
$20,000 0.7
2-2 rRF = 4%; rM = 12%; b = 0.8; rs = ?
2-3 rRF = 5%; RPM = 7%; rM = ?
2-4 Predicted return = r¯RF,t + ai + bi(r¯M,t r¯RF,t) + ci(r¯SMB,t) + di(r¯HML,t)
= 5% + 0.0% + 1.2(10% – 5%) + (-0.4)(3.2%) + 1.3(4.8%)
= 15.96%
Answers and Solutions: 2 – 13
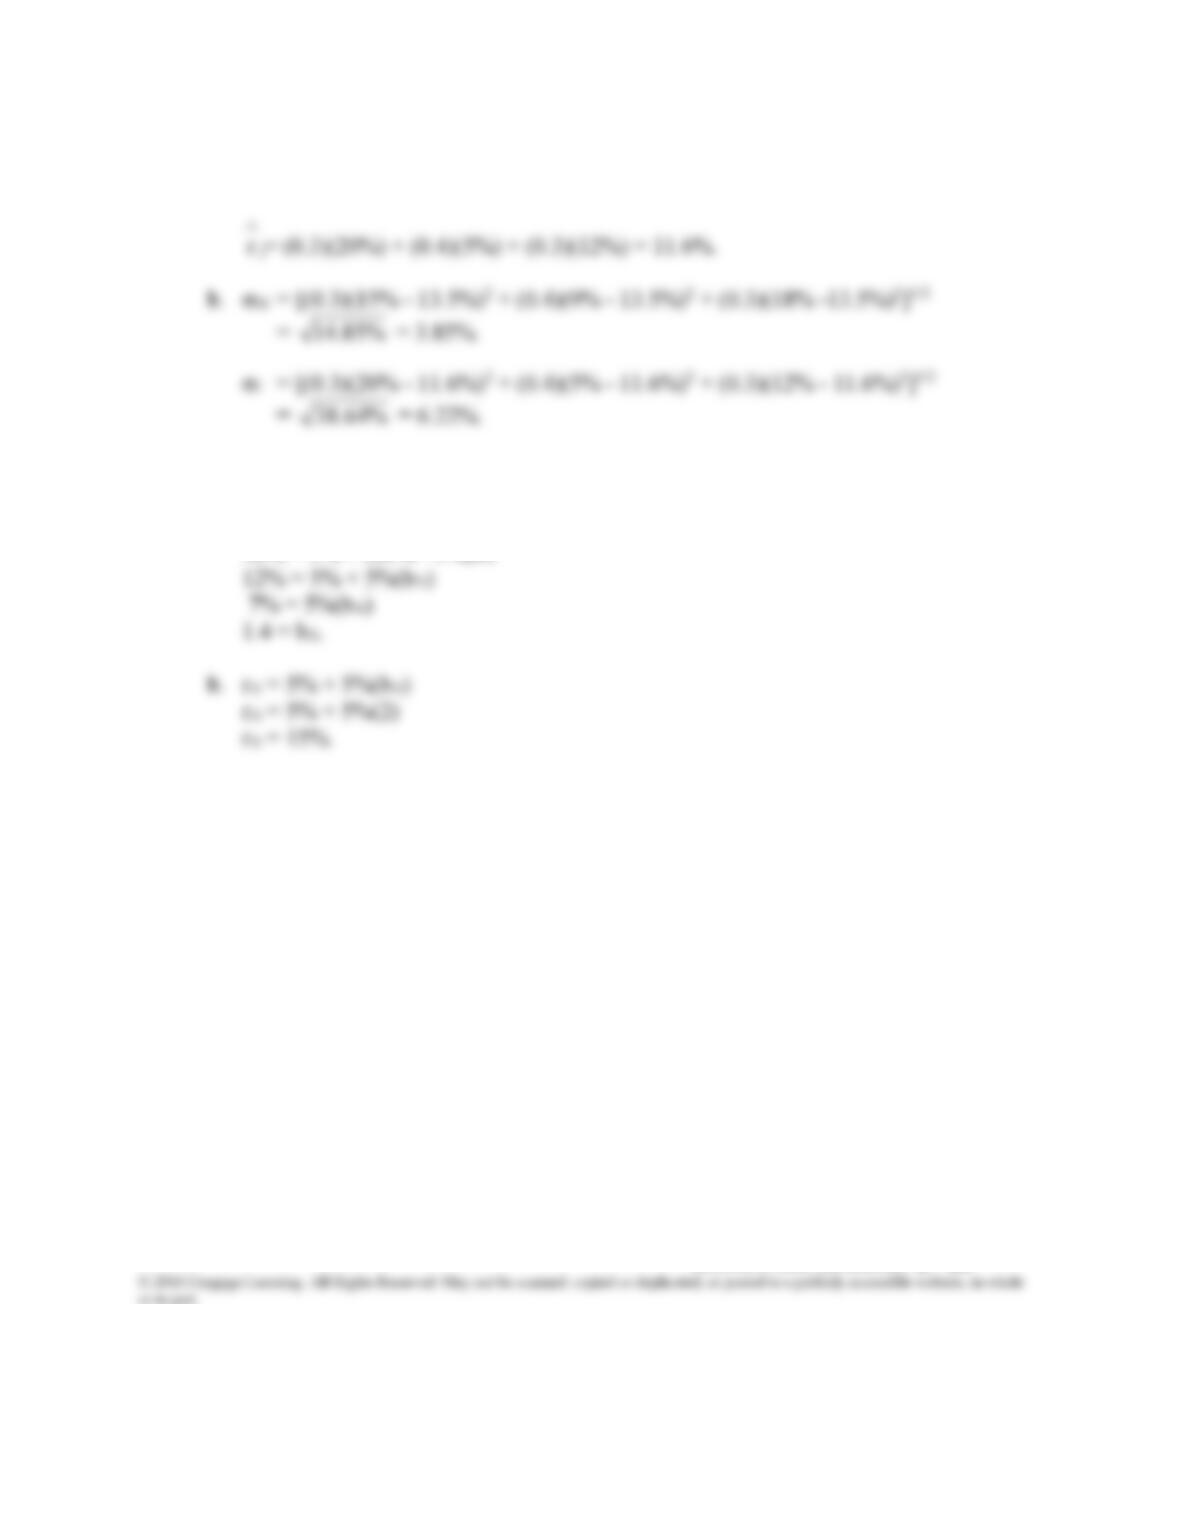
2-6 a.
r
m= (0.3)(15%) + (0.4)(9%) + (0.3)(18%) = 13.5%.
r
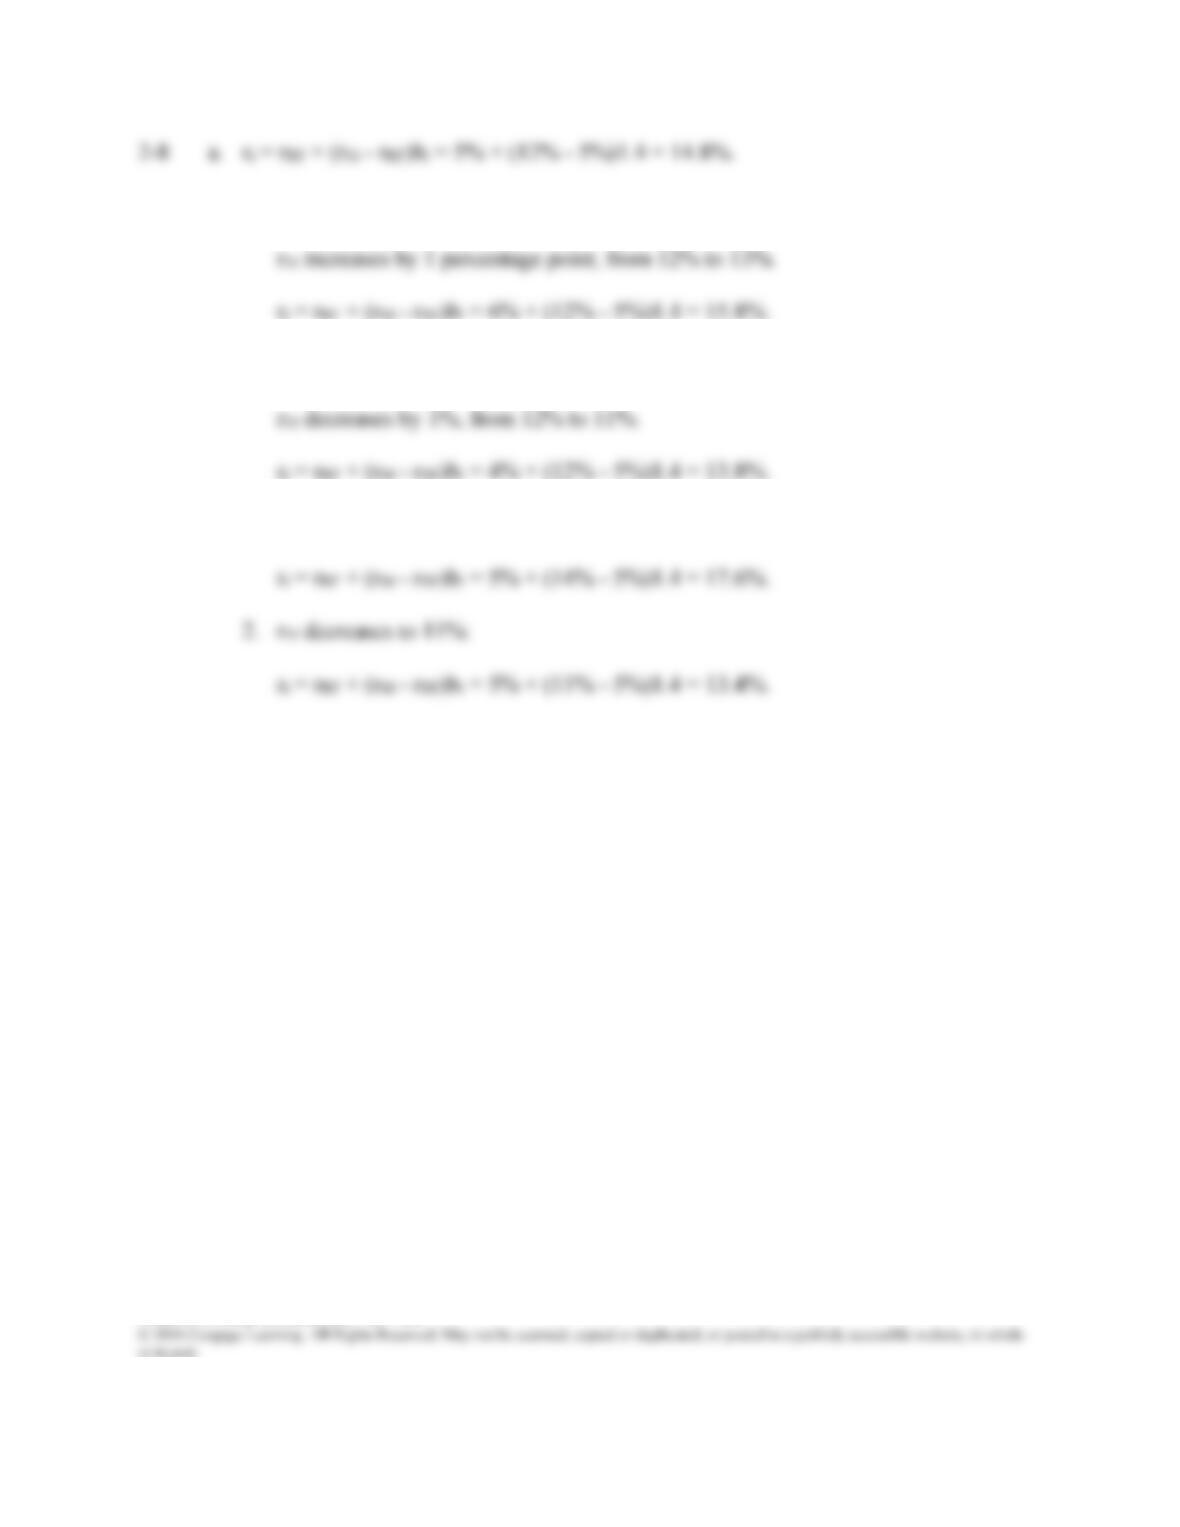
2-7 a. rA = rRF + (rM – rRF)bA
12% = 5% + (10% – 5%)bA
Answers and Solutions: 2 – 14
b. 1. rRF increases to 6%:
2. rRF decreases to 4%:
c. 1. rM increases to 14%:
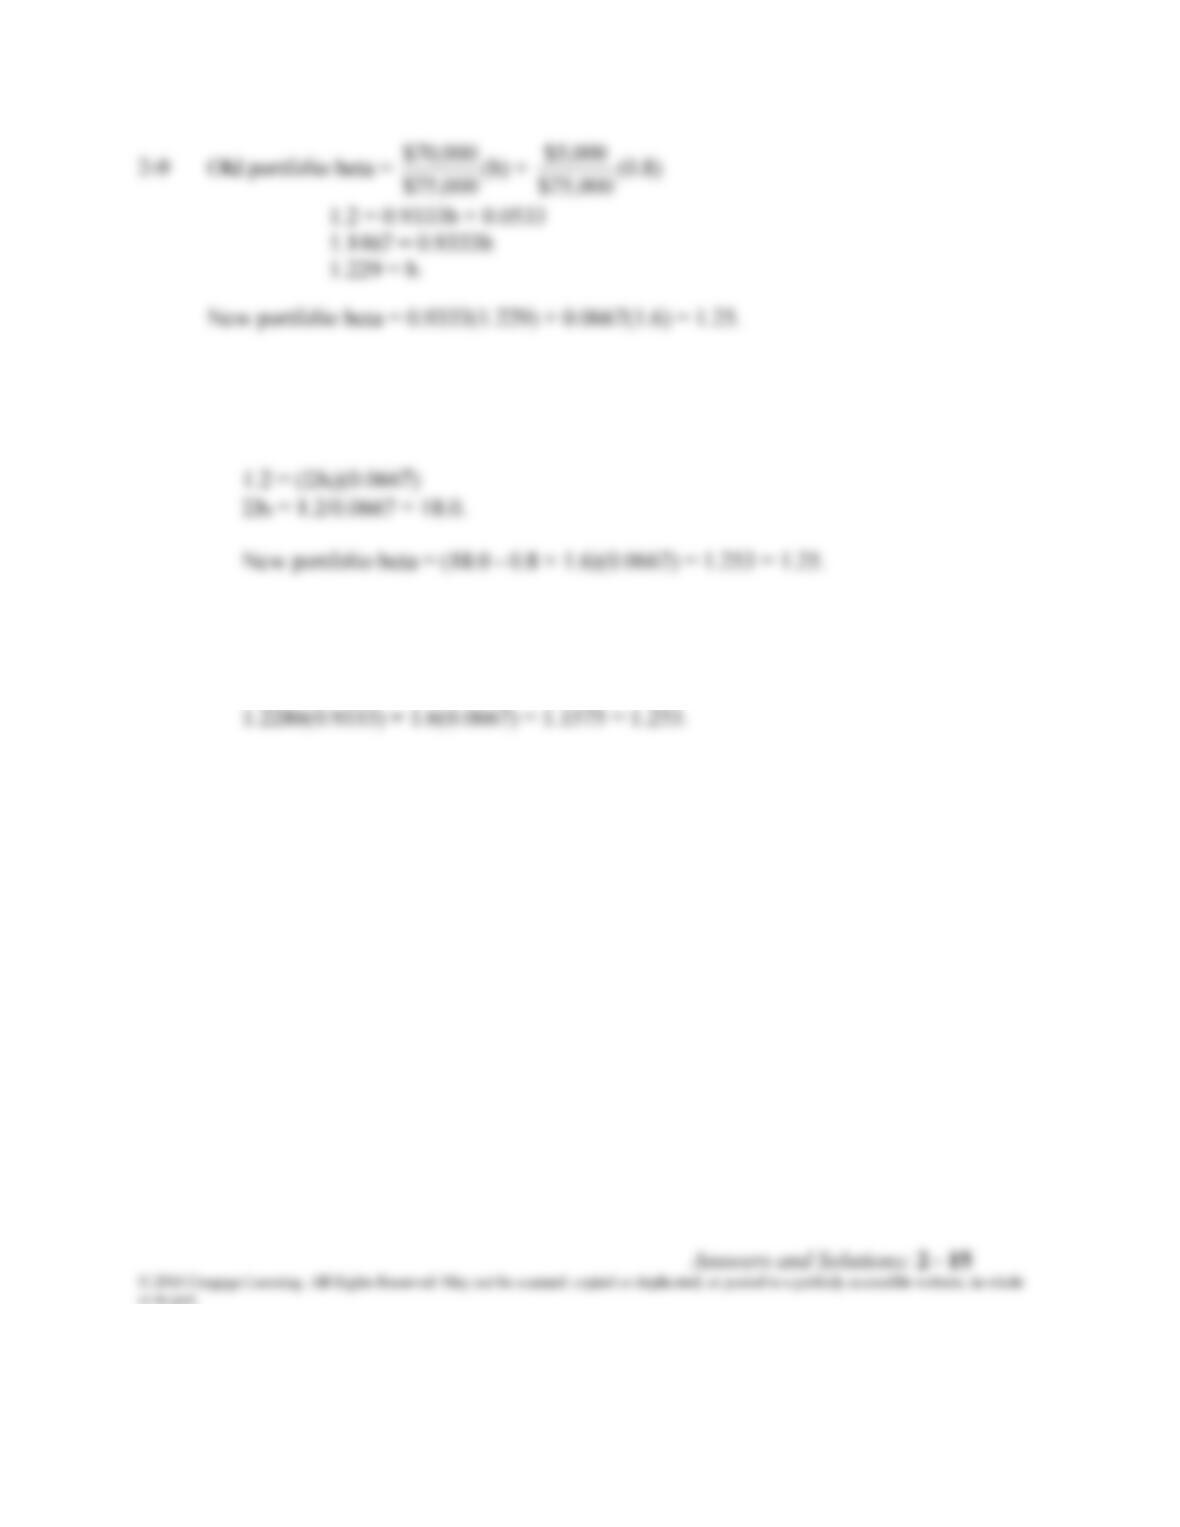
Alternative Solutions:
1. Old portfolio beta = 1.2 = (0.0667)b1 + (0.0667)b2 +…+ (0.0667)b20
2. bi excluding the stock with the beta equal to 0.8 is 18.0 – 0.8 = 17.2, so the beta of the
portfolio excluding this stock is b = 17.2/14 = 1.2286. The beta of the new portfolio
is:
Answers and Solutions: 2 – 16
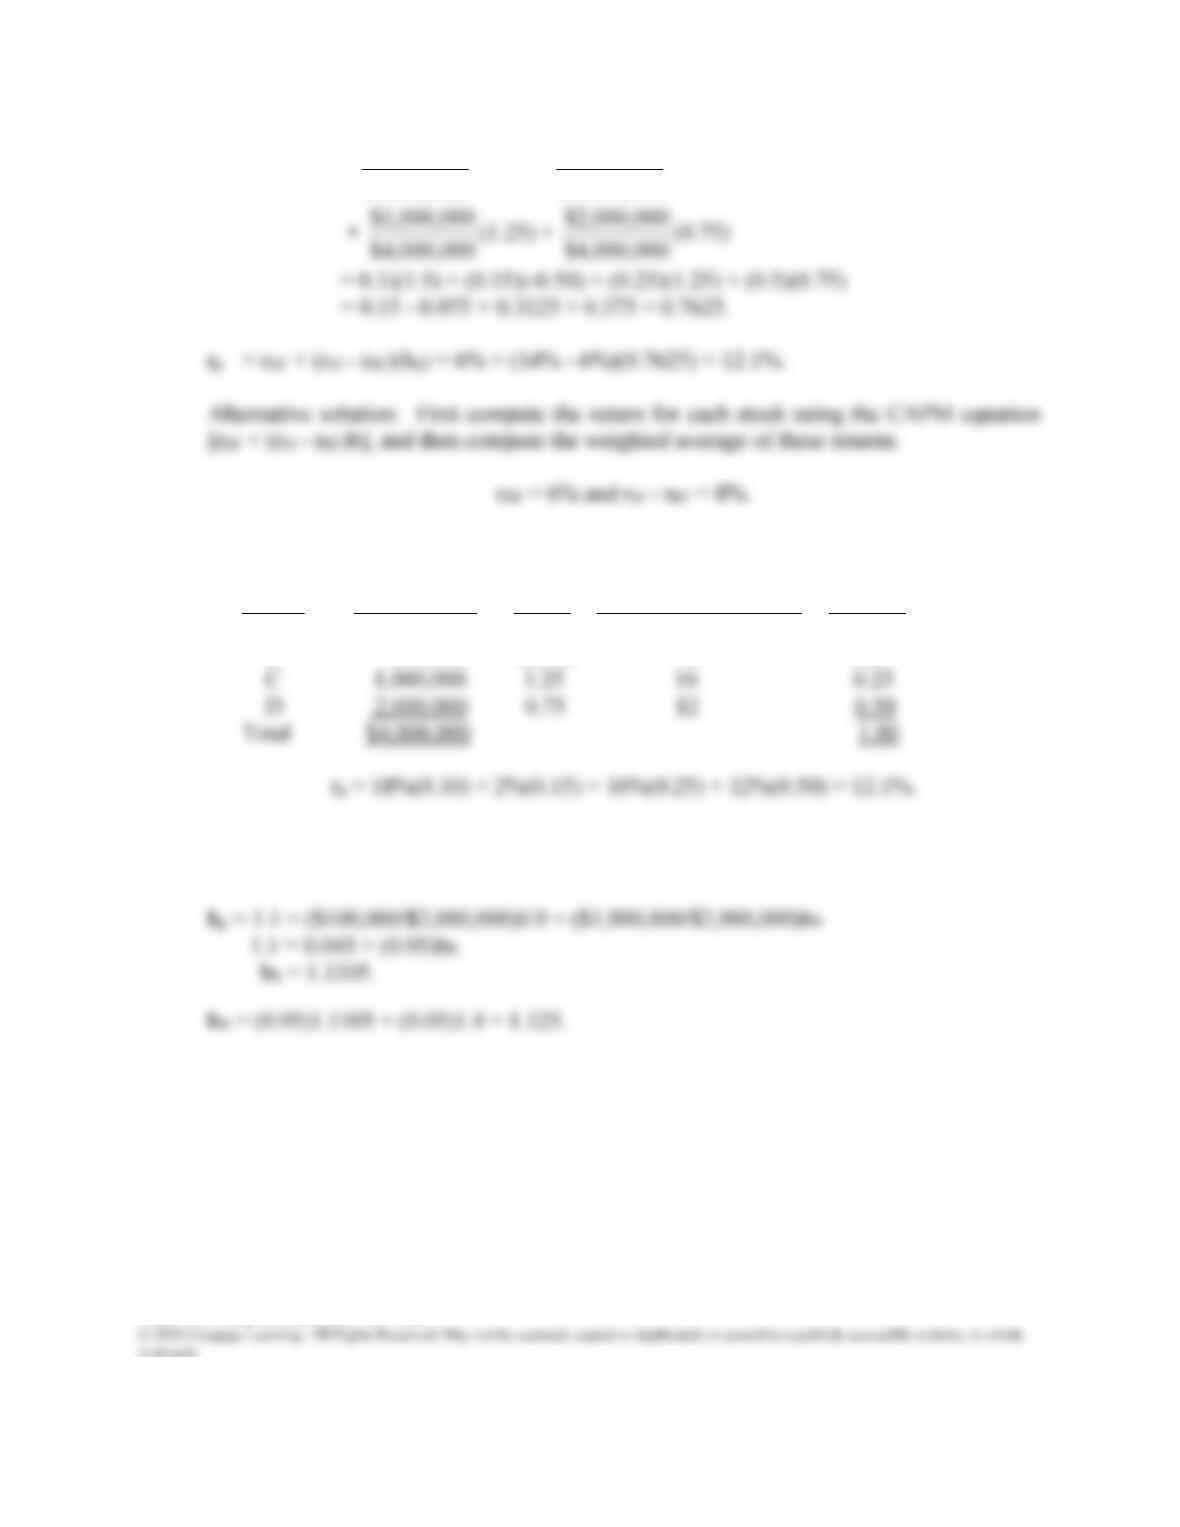
2-10 Portfolio beta = $4,000,000
$400,000 (1.50) + $4,000,000
$600,000 (-0.50)
Stock Investment Beta r = rRF + (rM – rRF)b Weight
A $ 400,000 1.50 18% 0.10
B 600,000 (0.50) 2 0.15
2-11 First, calculate the beta of what remains after selling the stock:
Answers and Solutions: 2 – 17
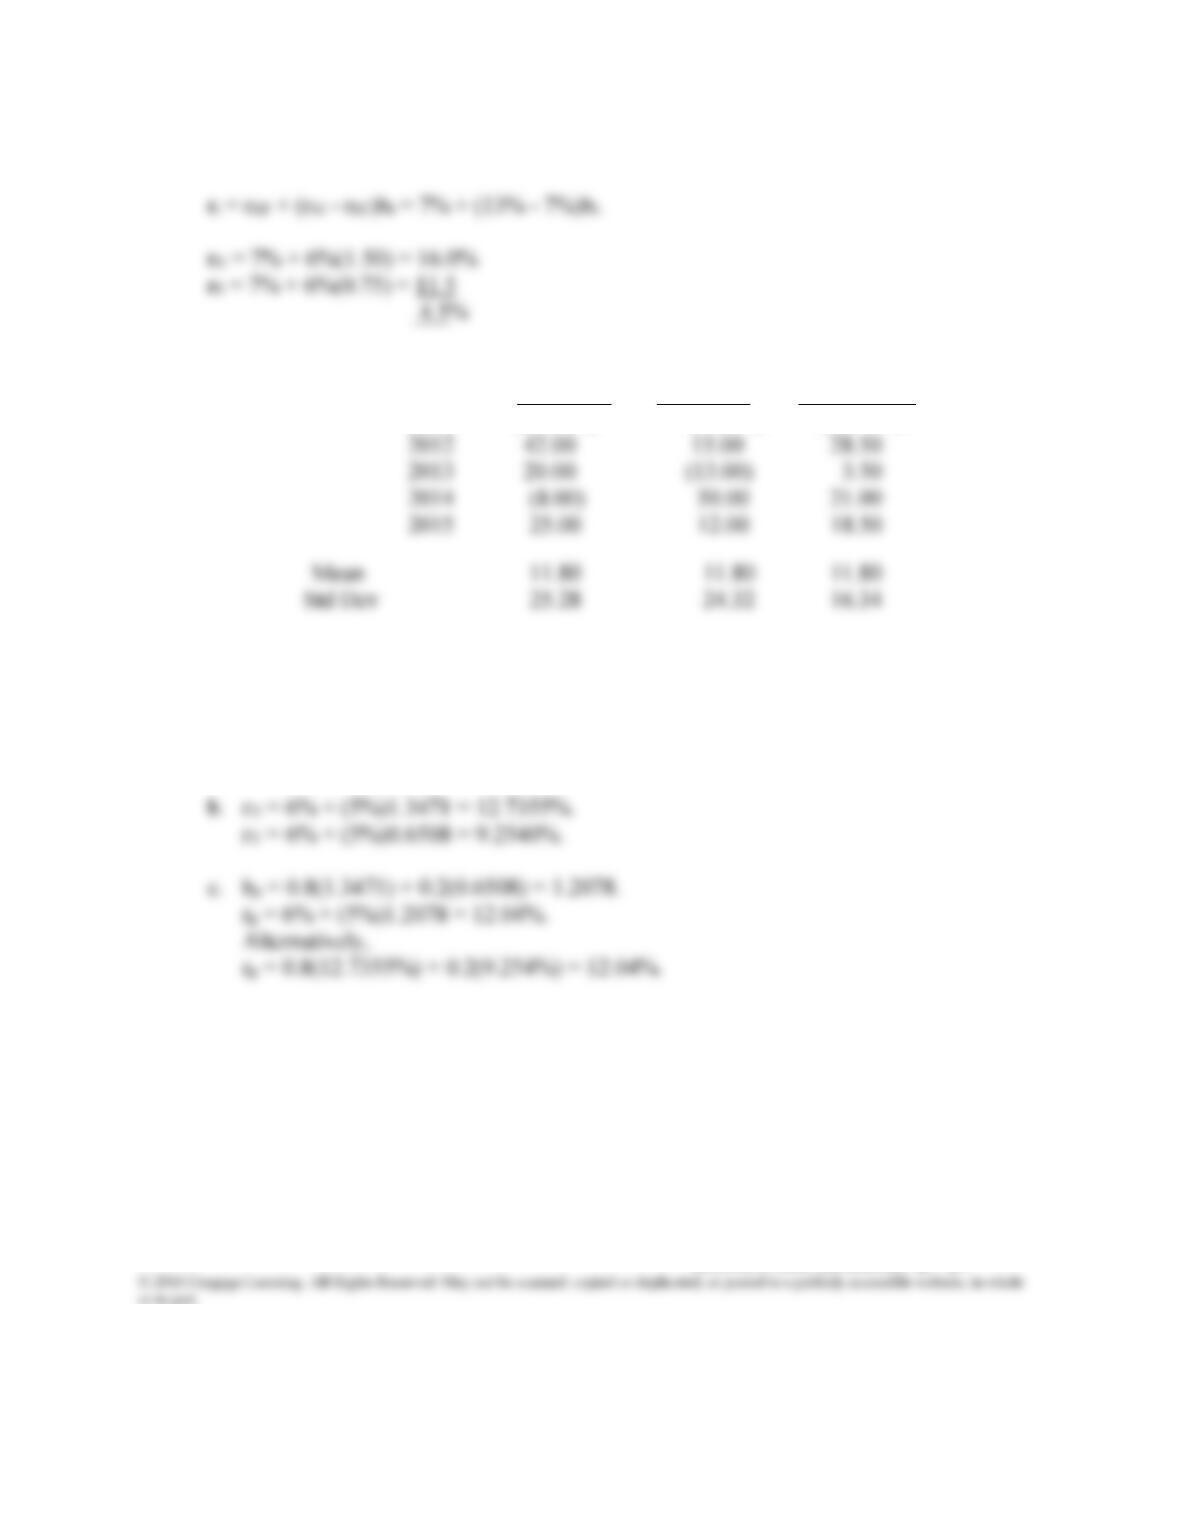
2-12 We know that bR = 1.50, bS = 0.75, rM = 13%, rRF = 7%.
2-13 The answers to a, b, and c are given below:
¯rA ¯rB Portfolio
2011 (20.00%) (5.00%) (12.50%)
d. A risk-averse investor would choose the portfolio over either Stock A or Stock B alone,
since the portfolio offers the same expected return but with less risk. This result occurs
because returns on A and B are not perfectly positively correlated (ρAB = -0.13).
2-14 a. bX = 1.3471; bY = 0.6508. These can be calculated with a spreadsheet.

Answers and Solutions: 2 – 18
SOLUTION TO SPREADSHEET PROBLEM
2-15 The detailed solution for the spreadsheet problem is available in the file Ch02-P15 Build

Mini Case: 2 – 19
Assume that you recently graduated and landed a job as a financial planner with Cicero
Services, an investment advisory company. Your first client recently inherited some assets
and has asked you to evaluate them. The client presently owns a bond portfolio with $1
million invested in zero coupon Treasury bonds that mature in 10 years. The client also has
$2 million invested in the stock of Blandy, Inc., a company that produces meat-and-potatoes
frozen dinners. Blandy’s slogan is “Solid food for shaky times.”
Unfortunately, Congress and the President are engaged in an acrimonious dispute over
the budget and the debt ceiling. The outcome of the dispute, which will not be resolved until
the end of the year, will have a big impact on interest rates one year from now. Your first
task is to determine the risk of the client’s bond portfolio. After consulting with the
economists at your firm, you have specified five possible scenarios for the resolution of the
dispute at the end of the year. For each scenario, you have estimated the probability of the
scenario occurring and the impact on interest rates and bond prices if the scenario occurs.
Given this information, you have calculated the rate of return on 10-year zero coupon for
each scenario. The probabilities and returns are shown below:
Scenario
Probability
of Scenario
Return on a 10-Year Zero
Coupon Treasury Bond
During the Next Year
Worst Case 0.10 −14%
MINI CASE
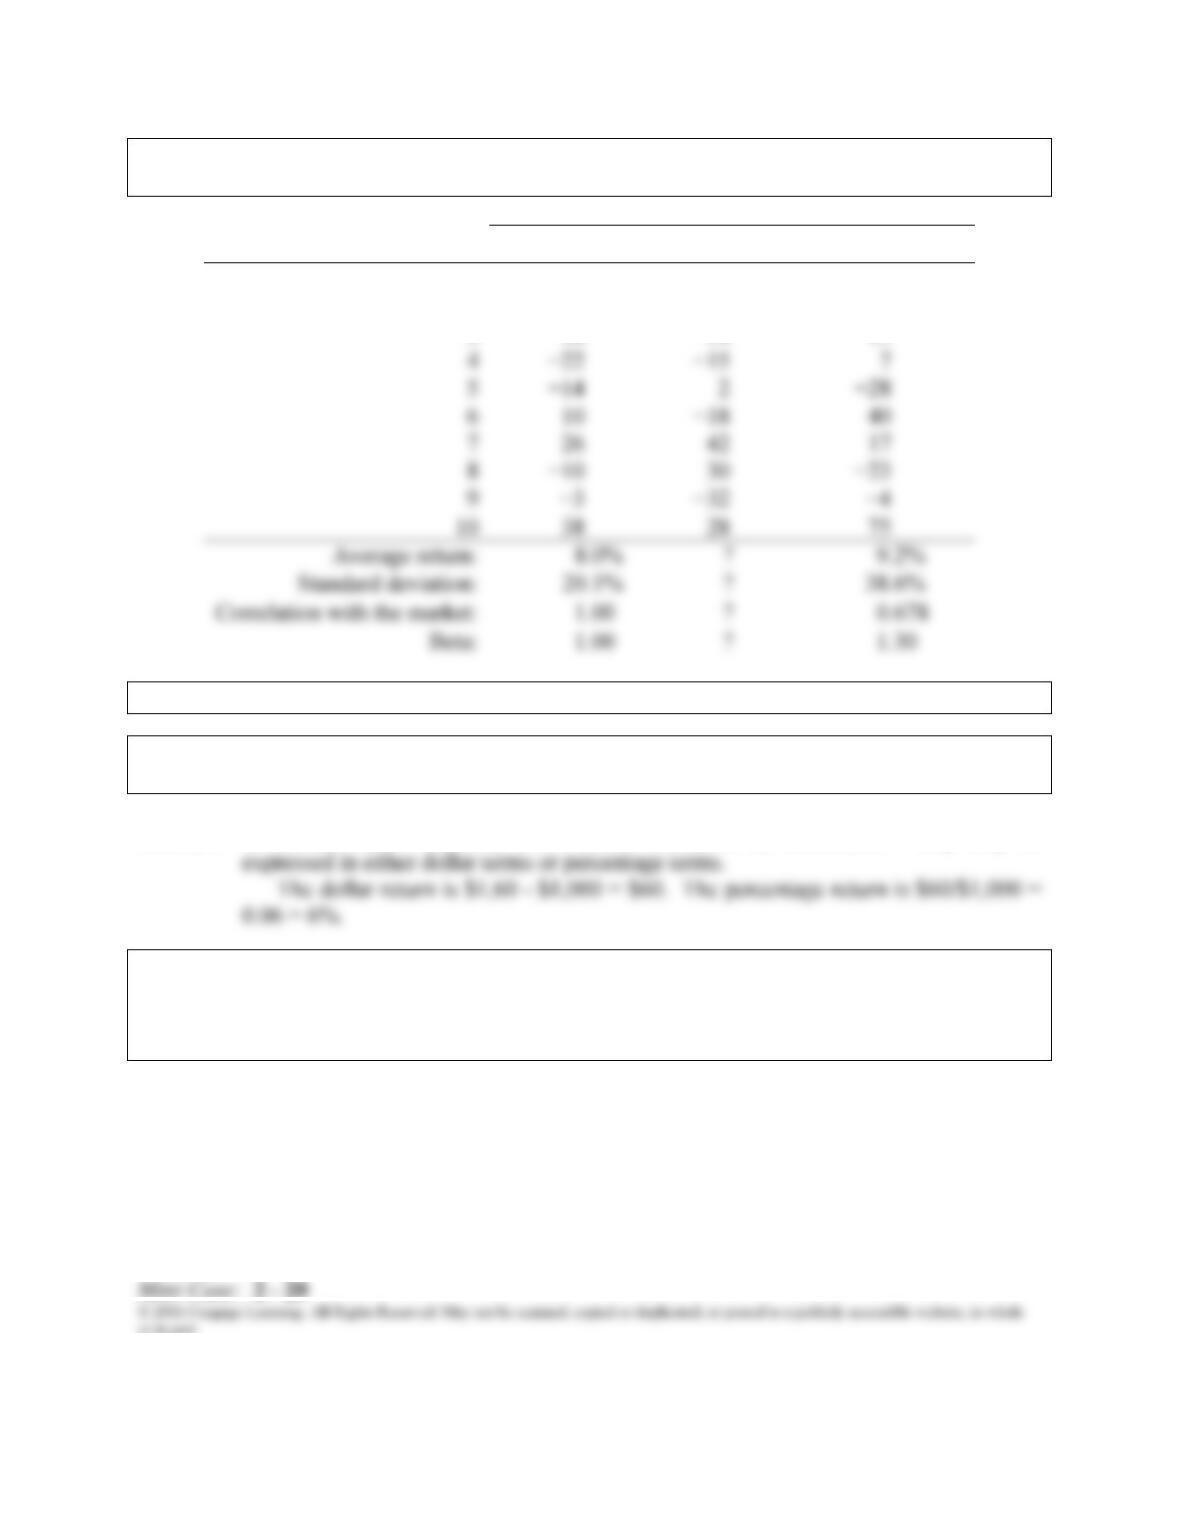
You have also gathered historical returns for the past 10 years for Blandy, Gourmange
Corporation (a producer of gourmet specialty foods), and the stock market.
Historical Stock Returns
Year Market Blandy Gourmange
1 30% 26% 47%
2 7 15 −54
3 18 −14 15
The risk-free rate is 4% and the market risk premium is 5%.
a. What are investment returns? What is the return on an investment that costs
$1,000 and is sold after 1 year for $1,060?
Answer: Investment return measures the financial results of an investment. They may be
b. Graph the probability distribution for the bond returns based on the 5 scenarios.
What might the graph of the probability distribution look like if there were an
infinite number of scenarios (i.e., if it were a continuous distribution and not a
discrete distribution)?