C02
Chapter 2 Spreadsheet Problem Solutions (C02)
1. There are a number of instructions with which you should be familiar
to use these computerized models. These instructions appear in a
separate worksheet labeled INSTRUCTIONS. If you have not already
done so, you should read these instructions now. To read these
instructions, click on theworksheet labeled INSTRUCTIONS.
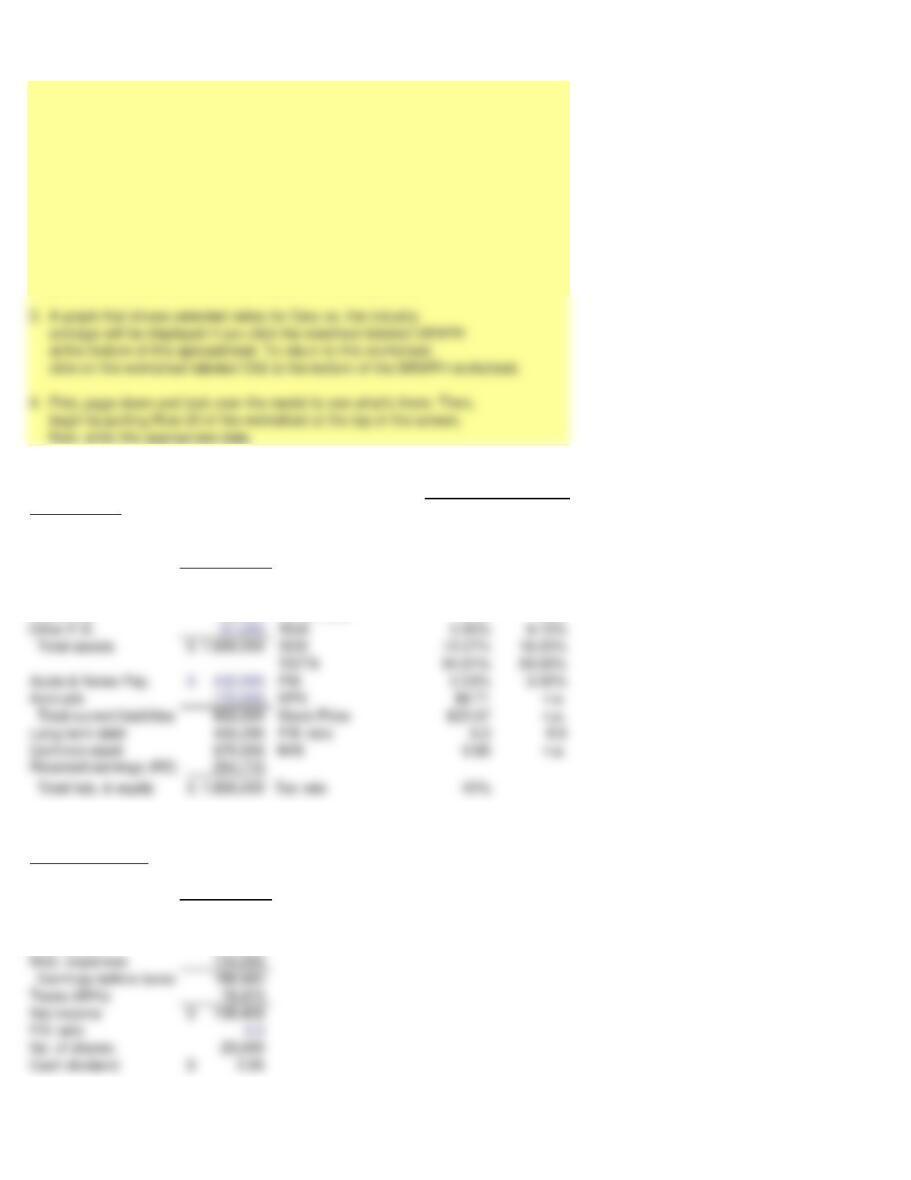
2. We have entered the some data for you. All that is required of
you is to enter the new dat and analyze the resulting ratios.
INPUT DATA: KEY OUTPUT:
Cary Industry
Balance Sheet
Cash 72,000$ Quick 0.85 1.00
A/R 439,000 Current 2.33 2.70
Inventories 894,000 Inv. turn. 4.00 5.80
Total current assets 1,405,000 DSO 36.84 32.00
Land and bldg 238,000 FA turnover 9.95 13.00
RE last year 146,302
Income Statement
Sales 4,290,000$
Cost of G.S. 3,580,000
Gross operating profit 710,000
Adm. & sales exp. 236,320
Depreciation 159,000
Ratio Analysis
Page 1
GRAPH
25
30
35
40
40.00%
50.00%
60.00%
Page 2
We have already entered the base case data for each model in this
file, and the models have performed the analysis for preceding parts
of the problem. You will need to enter the data for each of the
remaining parts of the problem–we indicate in each problem the parts
that should be done using the spreadsheet. However, there are several
points worth noting before you go into a model:
1. The input data are entered in specified cells in the INPUT DATA
section. When you change an input item, the model automatically
2. The key output data are displayed to the right of the INPUT DATA
3. Input data items that you can change are distinguished from the
ones you should not change. The items that you can change are
highlighted in color (blue) whereas the other items are printed in black.
4. All percentages must be entered as decimals. Dollars and other
numbers must be entered without dollar signs or commas.
5. Instructions and comments concerning specific models accompany
GENERAL INSTRUCTIONS FOR COMPUTERIZED PROBLEM SOLUTIONS