CFIN6 – CHAPTER 2
INTEGRATIVE PROBLEM SOLUTIONS
a. Begin by reviewing briefly what balance sheets and income statements are. Then give an overview of the
statement of cash flows. Explain that some data (net income, depreciation, and dividends) come from the
income statement, while the other items reflect differences between balance sheet accounts and thus show
changes in those accounts between the two dates.
b. Financial ratios are used to get an idea about the future financial condition of a firm by determining how well
the company is being operated and where it needs improving. The ratio categories, and their purposes, are
as follows:
1. Liquidity: Can the company make required payments in the short run (defined as the next year)?
2. Asset management: Are the investments in assets about right in view of sales levels?
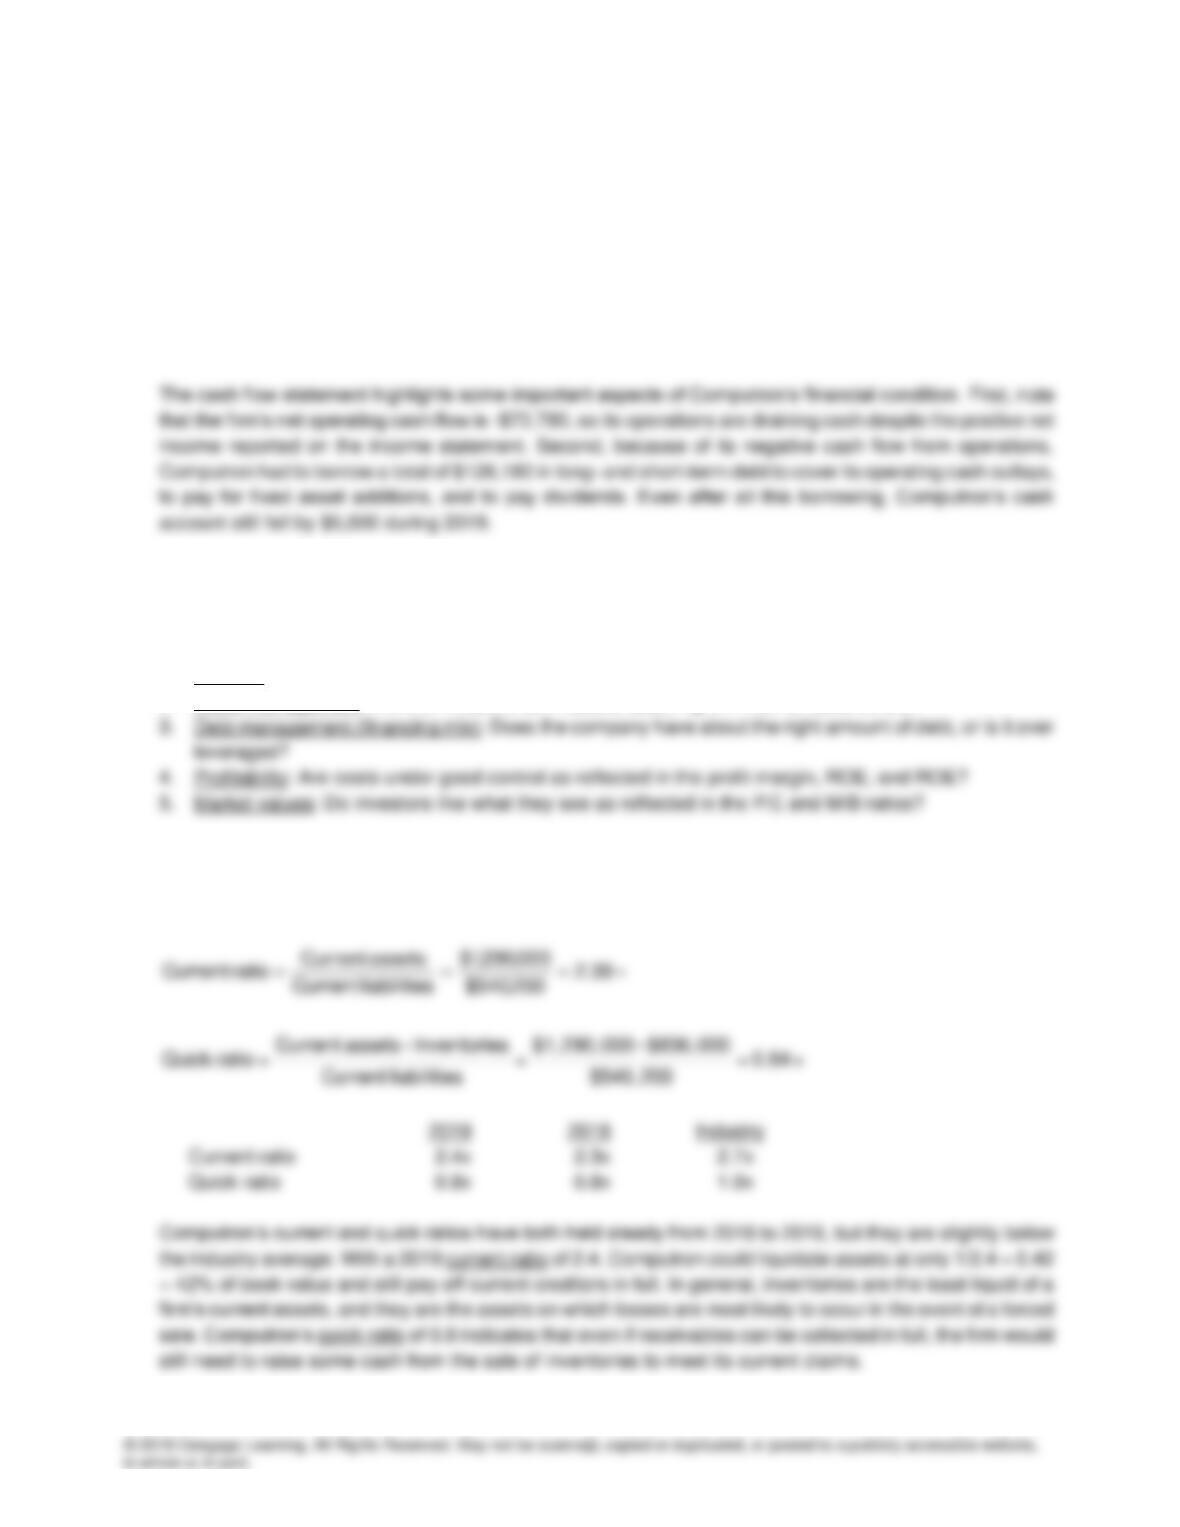
c. Computron has $540,200 in obligations that must be satisfied within the coming year. Will it have trouble
meeting its required payments? A full liquidity analysis requires a cash budget, but these two ratios provide
quick, easy-to-use measures of liquidity:
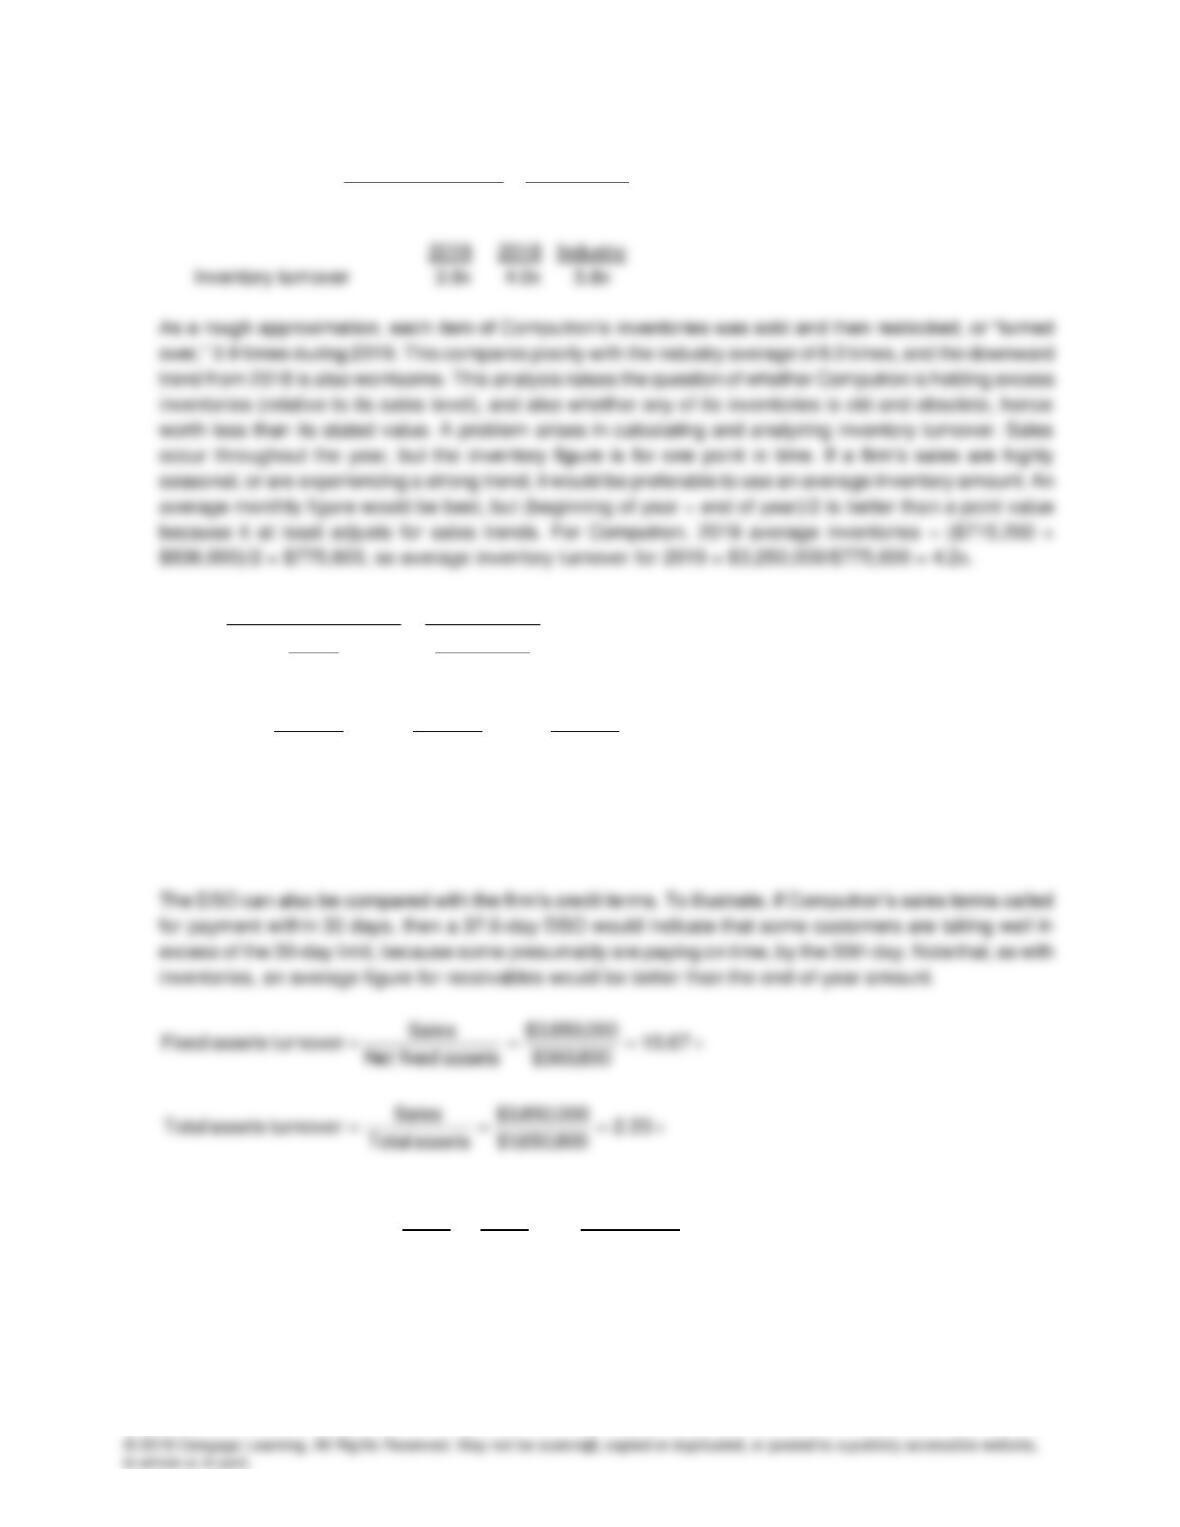
d.
Cost of goods sold $3,250,000
Inventory Turnover = = = 3.9×
Inventories $836,000
days 6.37
360
000,850,3$
000,402$
360
Sales
receivable Accounts
DSO =
=
=
2019 2018 Industry
DSO 37.6 days 36.8 days 32.0 days
The days sales outstanding (DSO) represents the average length of time that the firm must wait after making
a sale before it receives cash. Computron’s DSO is above the industry average and is trending higher, so it
looks bad.
2019 2018 INDUSTRY
Fixed assets turnover 10.7x 10.0x 10.7x
Total assets turnover 2.3x 2.3x 2.6x
Computron’s fixed assets turnover ratio has improved from 2018 to 2019 to reach the industry average, but
its total assets turnover ratio has remained relatively constant at a level just below the industry average.
Thus, the company is utilizing its fixed assets at the industry average level, but its total assets turnover is
below average. As indicated earlier, Computron might have excess inventories and receivables, and this
would lower the total assets turnover relative to the fixed assets turnover. (Note again that average values of
fixed and total assets would provide a better indication of the assets actually used to generate sales for the
year.)
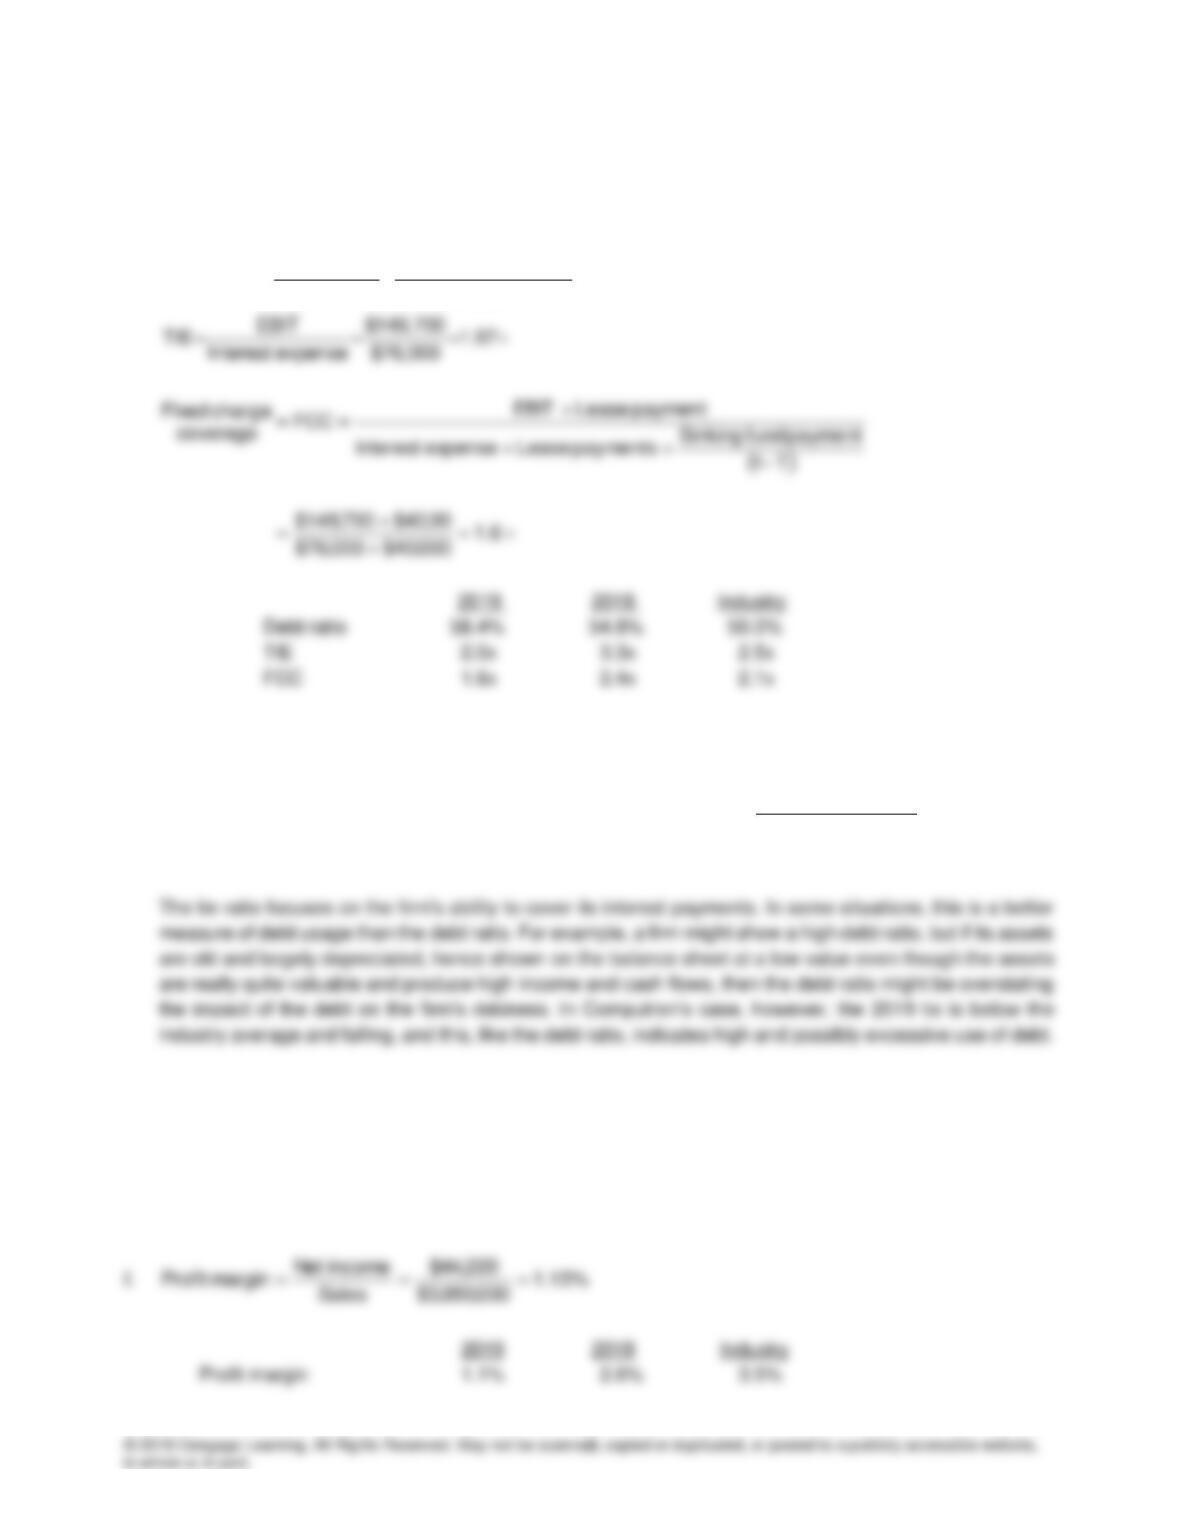
e.
Total debt $540,200 $424,600
Debt ratio 58.4%
Total assets $1,650,800
+
= = =
All three measures reflect the extent of debt usage, but they focus on different aspects. Computron’s debt
ratio is above the industry average, and the trend is up. Creditors have supplied over one–half the firm’s total
financing. Computron probably would find it difficult to borrow additional funds at a reasonable cost without
first raising more equity capital. Note that another leverage ratio, the debt–to-equity ratio, is also used in
practice. Computron’s debt–to-equity ratio for 2019 is 1.41, indicating that creditors have contributed $1.41 for
each dollar of equity capital.
The fixed charge coverage (FCC) ratio is similar to the tie ratio, but it is more inclusive in that it recognizes
that long-term lease contracts also represent fixed, contractual payments. Computron’s 2019 FCC ratio is
also below the industry average, and it is falling. Again, this points out that Computron uses substantially
more fixed charge financing than the average firm in the industry, so it probably would have trouble obtaining
additional debt or lease financing. Note also that there are many variations of the coverage ratios, depending
on the purpose of the analysis.
Computron’s profit margin is low and falling. This indicates that its sales prices are relatively low, that its
costs are relatively high, or both. Note that because we are primarily concerned with the profitability to
common stockholders, net income available to common stockholders after preferred dividends have been
paid is used to calculate profit margin.
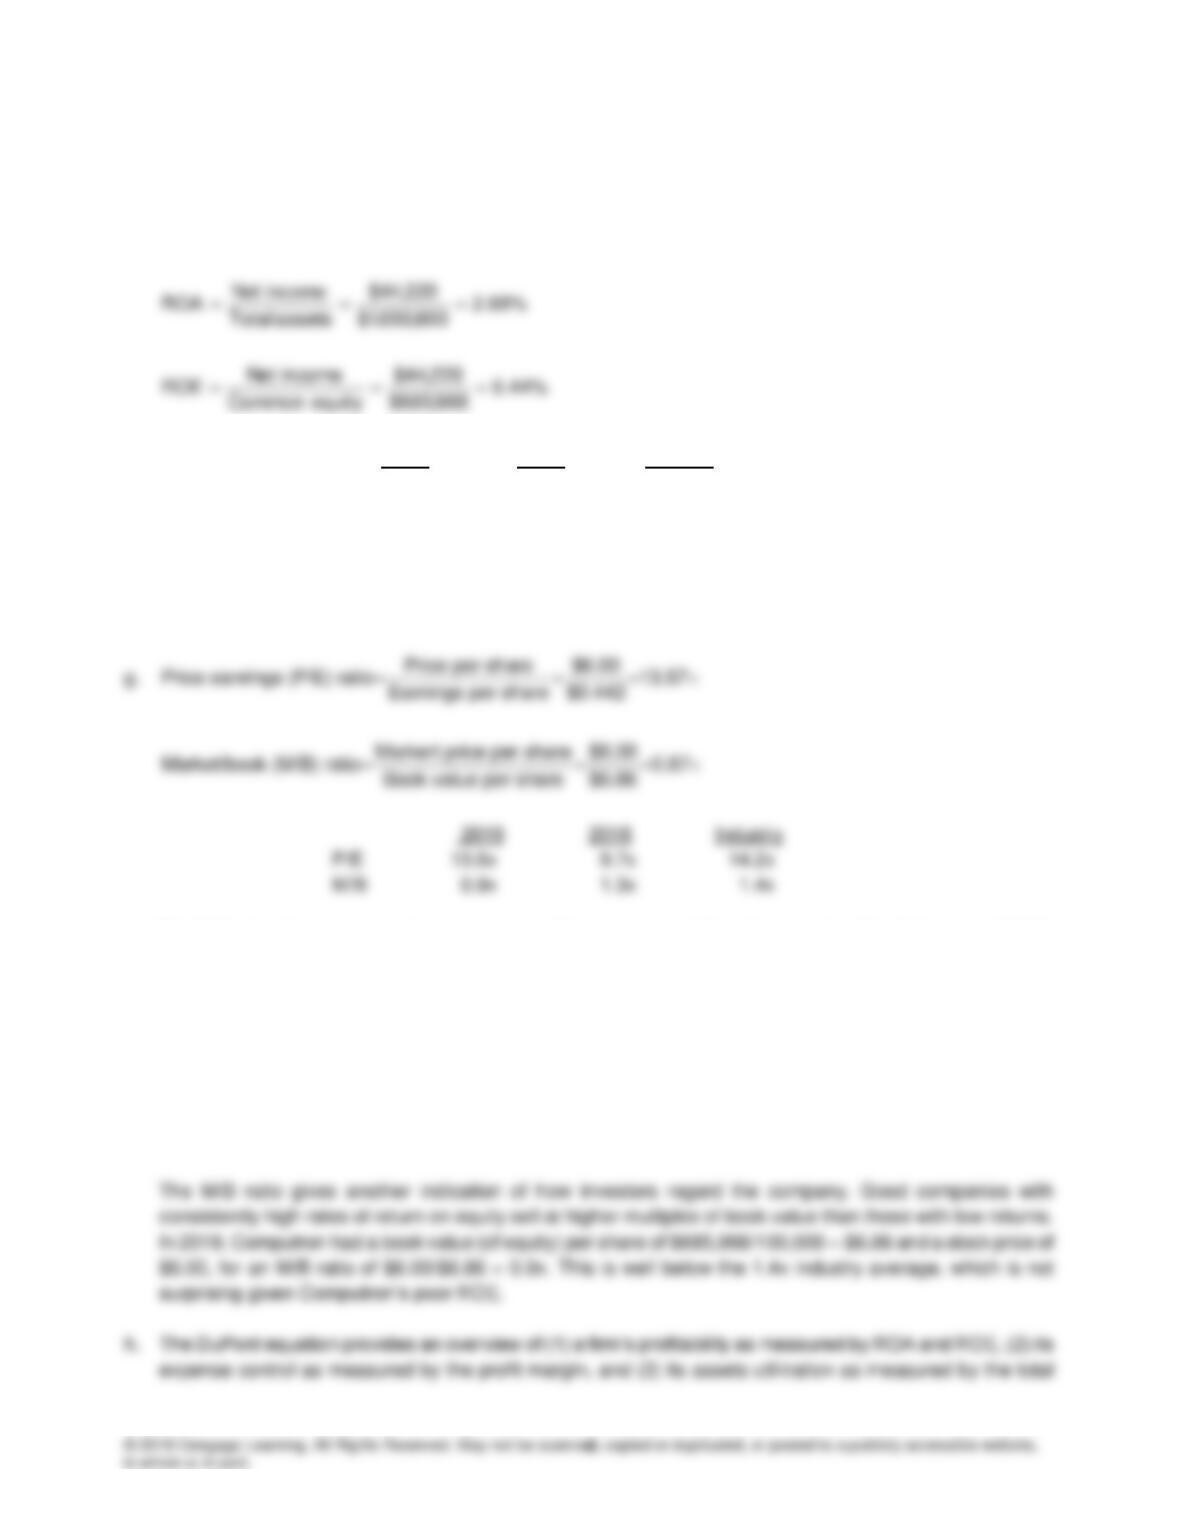
2019 2018 Industry
ROA 2.7% 6.0% 9.1%
ROE 6.4 13.3 18.2
Computron’s ROA and ROE are substantially below the industry average, and falling. These are “bottom line”
ratios, and because they are poor, one would anticipate that the company’s common stock has not been
doing very well.
The P/E ratio shows how much investors are willing to pay per dollar of reported profits. At the end of 2019,
Computron’s stock sold for $6.00 per share; its reported earnings were $44,220/100,000 = $0.44 per share;
and the result was a P/E ratio of $6.00/$0.44 = 13.6x. Note that the firm’s P/E ratio actually improved from
2018 to 2019, almost reaching the industry average. However, this was not caused by an increase in stock
price—the price fell by almost 30%, from $8.50 to $6.00. Rather, the P/E ratio rose because of the 2019
earnings decline—earnings fell by almost 50% from the 2018 level. With earnings normalized (averaged over
several years), Computron’s P/E ratio would be well below the industry average, indicating that investors
view Computron as being riskier and/or as having poorer growth prospects than the average firm in the
industry.
assets turnover, combining these items in the equation shows how the different factors interact to determine
ROA and ROE. The data for Computron and the industry are given below.
Total assets
DuPont Profit margin turnover
Equation: (profit/sales) x (Sales/TA) = ROA
i. Sales per day amount to $3,850,000/360 = $10,694. Accounts receivable are now $402,000, or 37.6
days’ sales. If A/R can be reduced to 27.6 days without affecting sales, then the balance sheet item A/R
would be $10,694 x 27.6 = $295,154, down $106,846 from the current level. That $106,846 could be
used (1) to reduce debt, which would lower interest charges and thus increase profits, (2) to buy back
stock, which would lower shares outstanding and thus raise EPS; or (3) to invest in productive assets,
which presumably would raise net income. In any event, EPS, hence DPS, should increase.
j. Some of the problems and limitations of financial statement analysis are discussed below.
(1) Many large firms operate a number of different divisions in quite different industries, and in such cases it
is difficult to develop a meaningful set of industry averages for comparative purposes. This tends to
make ratio analysis more useful for small, narrowly-focused firms than for large, multi-divisional ones.
(4) Seasonal factors can also distort ratio analysis. For example, the inventory turnover ratio for a food
processor will be radically different if the balance sheet figure used for inventories is the one just before
versus the one just after the canning season. This problem can be minimized by using monthly averages
for inventories when calculating ratios such as turnover.
(7) It is difficult to generalize about whether a particular ratio is “good” or “bad.” For example, a high current
ratio might indicate a strong liquidity position, which is good, or excessive cash, which is bad, because
excess cash in the bank is a non-earning asset. Similarly, a high fixed assets turnover ratio can occur
either because a firm uses its assets efficiently or because it is undercapitalized and simply cannot afford
to buy enough assets.
Conclusion: In this chapter, we looked at financial statements from a historical perspective, to see how well
the company has been run. Our real interest, though, is in the future. In the next chapter, we go on to
forecast financial statements to get an idea of where the firm will be going in the future.