
CFIN6
Spreadsheet Problem Solution
Chapter 2
a. Following are the data and the ratios for Cary:
INPUT DATA: KEY OUTPUT:
Cary Industry
Cash $ 72,000 Quick 0.85 1.00
ROA 5.90% 9.10%
Accts & Notes Pay. $ 432,000 ROE 13.07% 18.20%
Accruals 170,000 TD/TA 54.81% 50.00%
Long-term debt 404,290 PM 2.53% 3.50%
Income statement
Sales $ 4,290,000
Cost of G.S. 3,580,000
Adm. & sales exp. 236,320
CFIN6
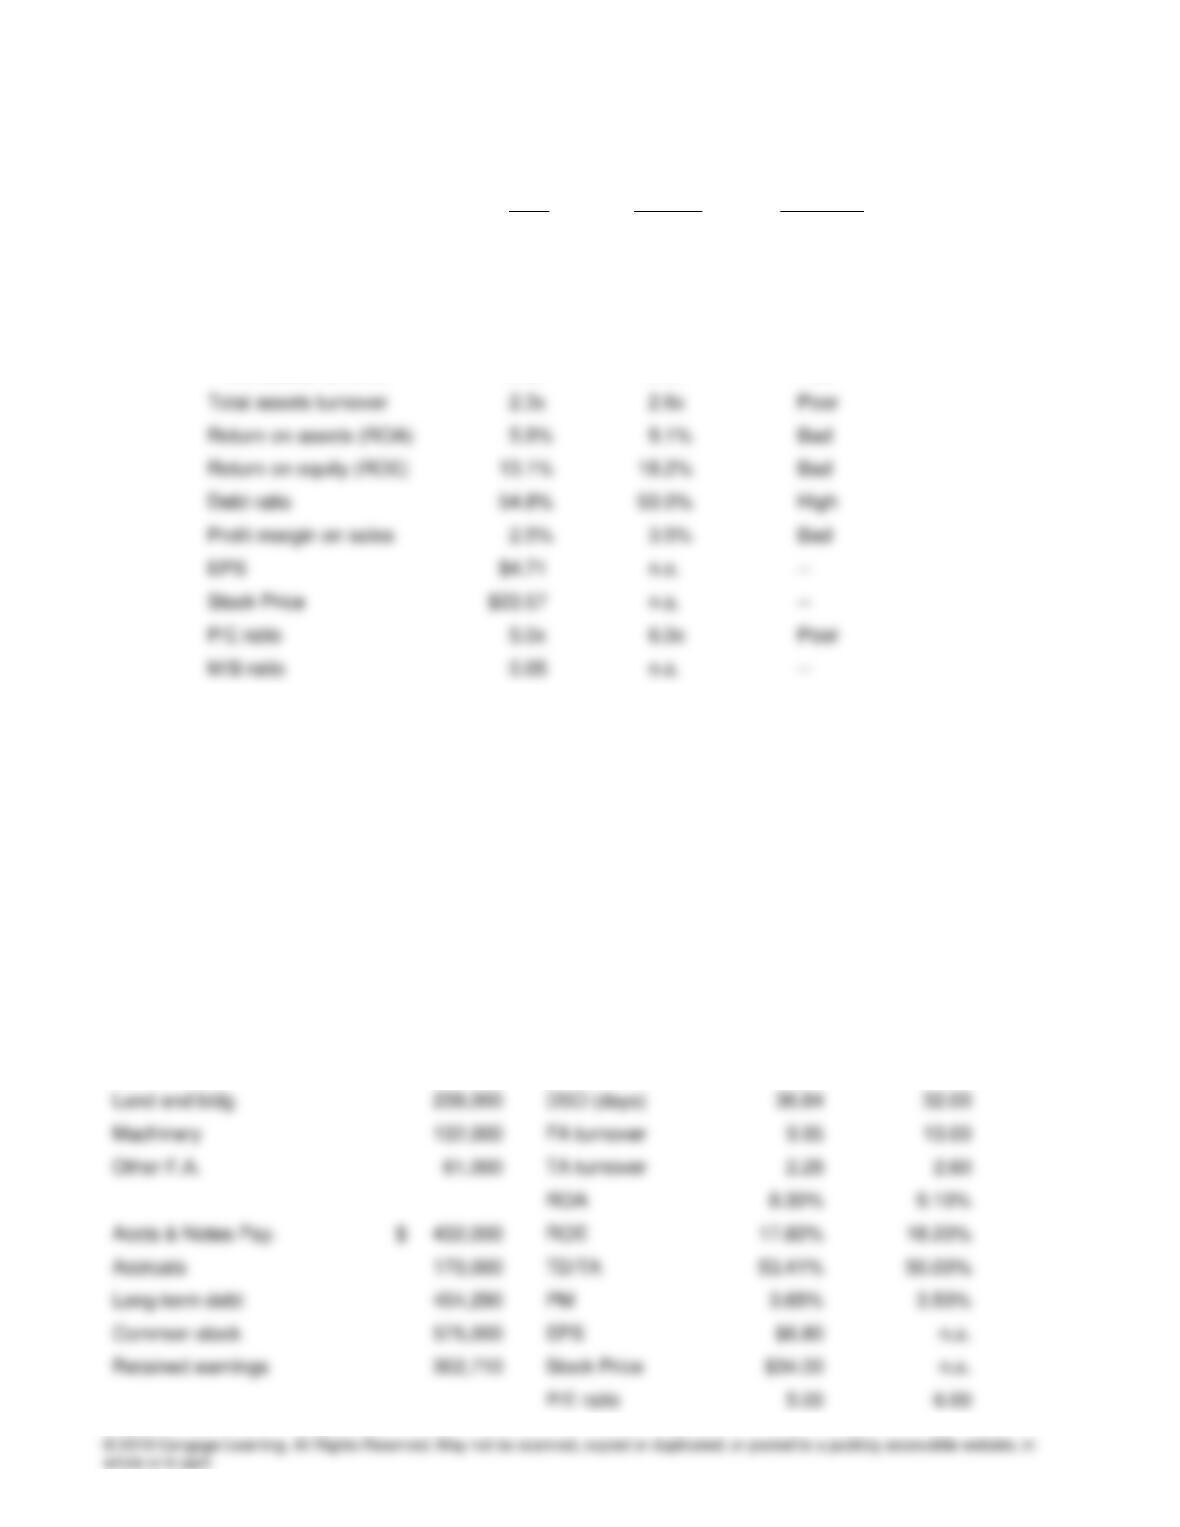
Here are Cary’s base-case ratios and other data as compared to the industry:
Cary Industry Comment
Quick 0.85x 1.0x Weak
Current 2.33x 2.7x Weak
Inventory turnover 4.0x 5.8x Poor
Days sales outstanding 36.8 days 32.0 days Poor
Fixed assets turnover 10.0x 13.0x Poor
Cary appears to be poorly managed—all of its ratios are worse than the industry averages, and the result is
low earnings, a low P/E, a low stock price, and a low M/B ratio. The company needs to do something to
improve.
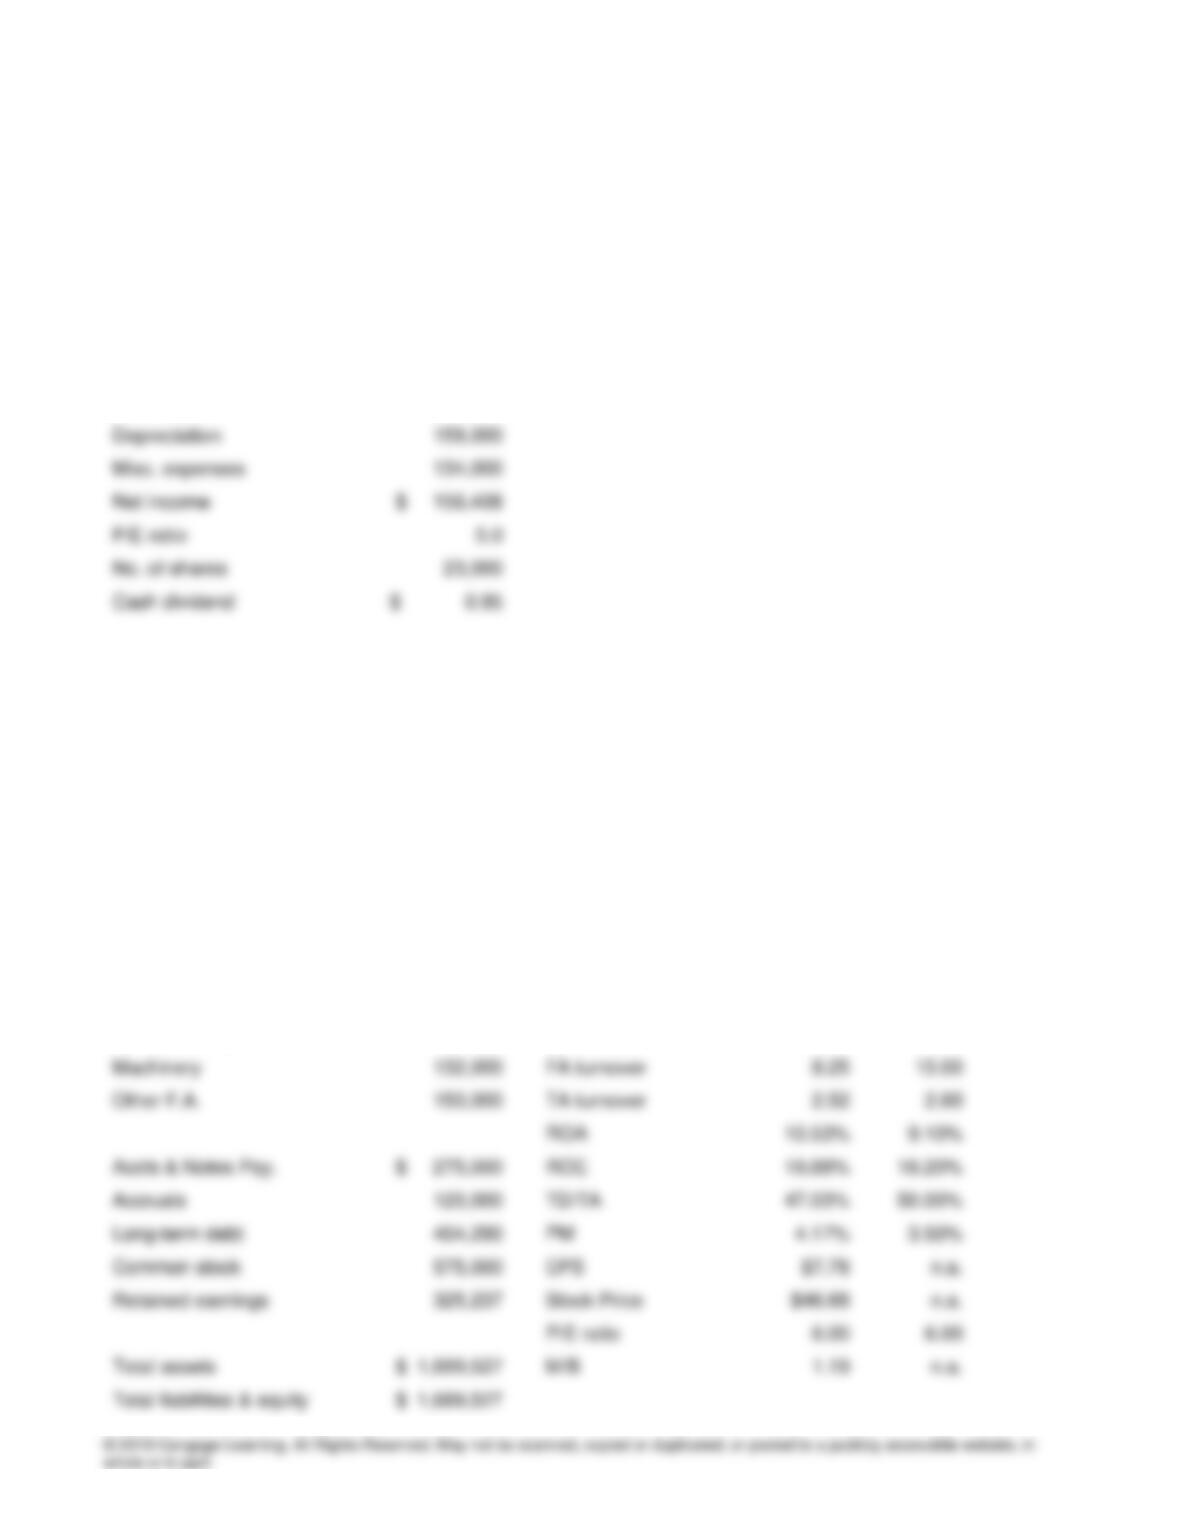
b. The revised data and ratios are shown below:
INPUT DATA: KEY OUTPUT:
Cary Industry
Cash $ 314,000 Quick 1.25 1.00
A/R 439,000 Current 2.41 2.70
Inventories 700,000 Inv. turn. 5.00 5.80
CFIN6
Total assets $ 1,884,000 M/B 0.89 n.a.
Total liabilities & equity $ 1,884,000
RE last year 146,302
Income statement
Sales $ 4,290,000
Cost of G.S. 3,500,000
Adm. & sales exp. 236,320
Cary’s liquidity position has improved. In addition, ROA and ROE are better than in the previous scenario,
and the profit margin now is higher than the industry average. Although the stock price has increased more
than $10 per share, there is room for more improvements.
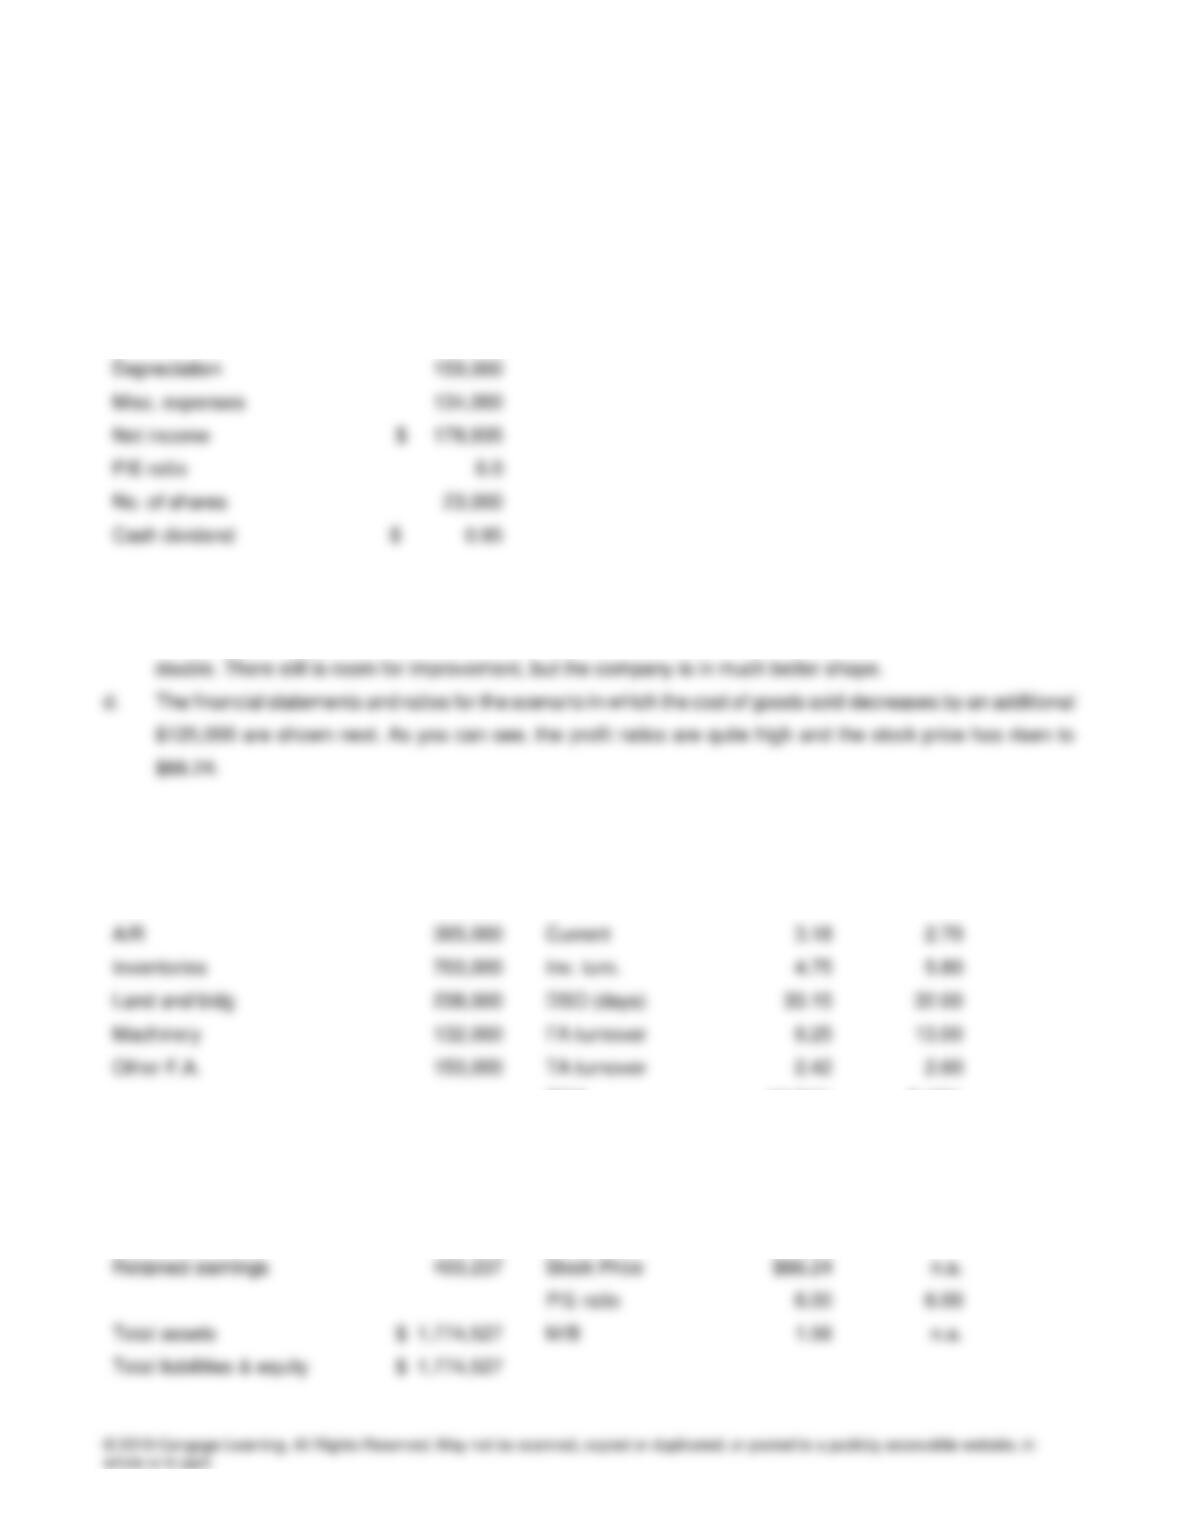
c. The revised data and ratios are shown below:
INPUT DATA: KEY OUTPUT:
Cary Industry
Cash $ 84,527 Quick 1.21 1.00
A/R 395,000 Current 2.99 2.70
Inventories 700,000 Inv. turn. 4.93 5.80
Land and bldg 238,000 DSO (days) 33.15 32.00
CFIN6
RE last year 146,302
Income statement
Sales $ 4,290,000
Cost of G.S. 3,450,000
Adm. & sales exp. 248,775
Under these new conditions, Cary Corporation looks much better. Its turnover ratios are still low, but its ROA
and ROE are above the industry average, its estimated P/E ratio is better, and its stock price is anticipated to
INPUT DATA: KEY OUTPUT:
Cary Industry
Cash $ 159,527 Quick 1.40 1.00
ROA 14.31% 9.10%
Accts & Notes Pay. $ 275,000 ROE 26.04% 18.20%
Accruals 120,000 TD/TA 45.04% 50.00%
Long-term debt 404,290 PM 5.92% 3.50%
Common stock 575,000 EPS $11.04 n.a.
CFIN6
RE last year 146,302
Income statement
Sales $ 4,290,000
Net income $ 253,935
P/E ratio 6.0
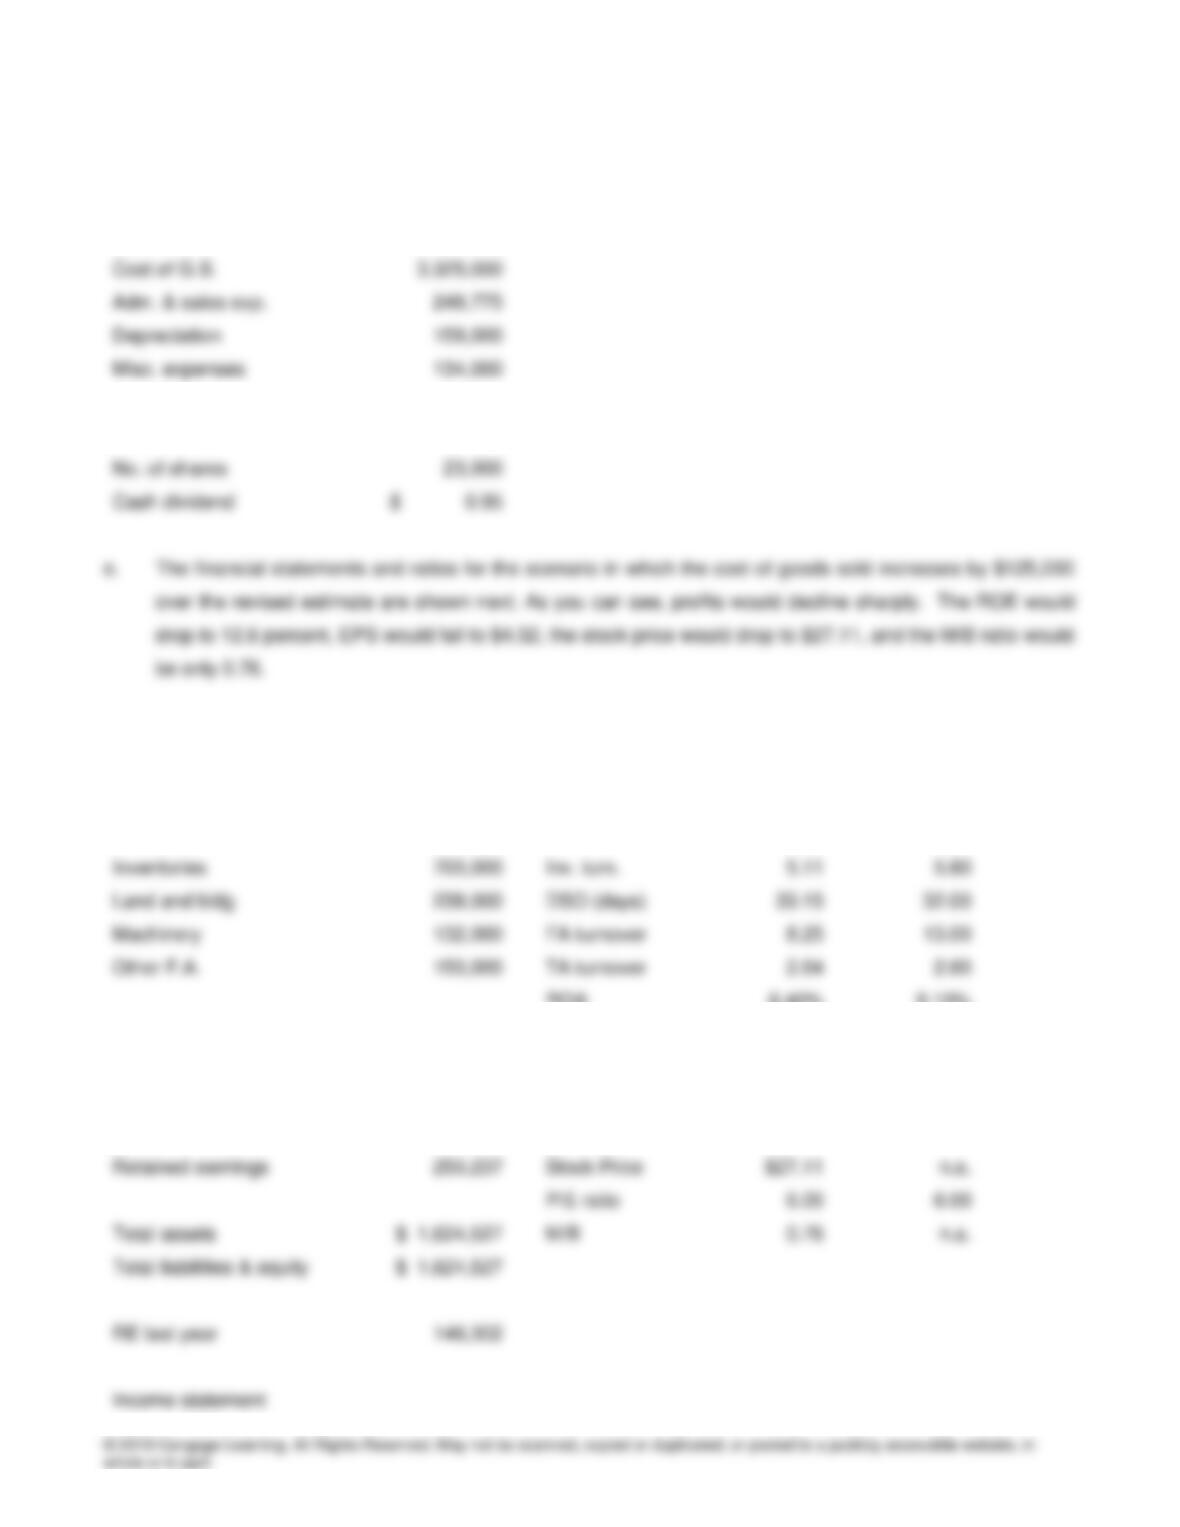
INPUT DATA: KEY OUTPUT:
Cary Industry
Cash $ 9,527 Quick 1.02 1.00
A/R 395,000 Current 2.80 2.70
ROA 6.40% 9.10%
Accts & Notes Pay. $ 275,000 ROE 12.59% 18.20%
Accruals 120,000 TD/TA 49.20% 50.00%
Long-term debt 404,290 PM 2.42% 3.50%
Common stock 575,000 EPS $4.52 n.a.
CFIN6
Sales $ 4,290,000
Cost of G.S. 3,575,000
Adm. & sales exp. 248,775
f. Computer models allow us to analyze quickly the impact of operating and financial decisions on the firm’s
overall performance. A firm can analyze its financial ratios under different scenarios to see what might happen
if a decision, such as the purchase of a new asset, did not produce the expected results. This gives the
managers some idea about what might happen under the best and worst cases and helps them to make
better decisions.