Chapter 2 Financial Statement and Cash Flow Analysis 47
P2-3. Classify each of the following items as an inflow (I) or an outflow (O) of cash, or as nei-
ther (N).
Item
Change ($)
Item
Change ($)
Cash
+600
Accounts receivable
−900
Accounts payable
−1,200
Net profits
+700
Notes payable
+800
Depreciation
+200
Long-term debt
−2,500
Repurchase of stock
+500
Inventory
+400
Cash dividends
+300
Fixed assets
+600
Sale of stock
A2-3. Cash + 600 (O) Accounts receivable –900 (I)
Accounts payable –1,200 (O) Net profits +700 (I)
Analyzing Financial Performance Using Ratio Analysis
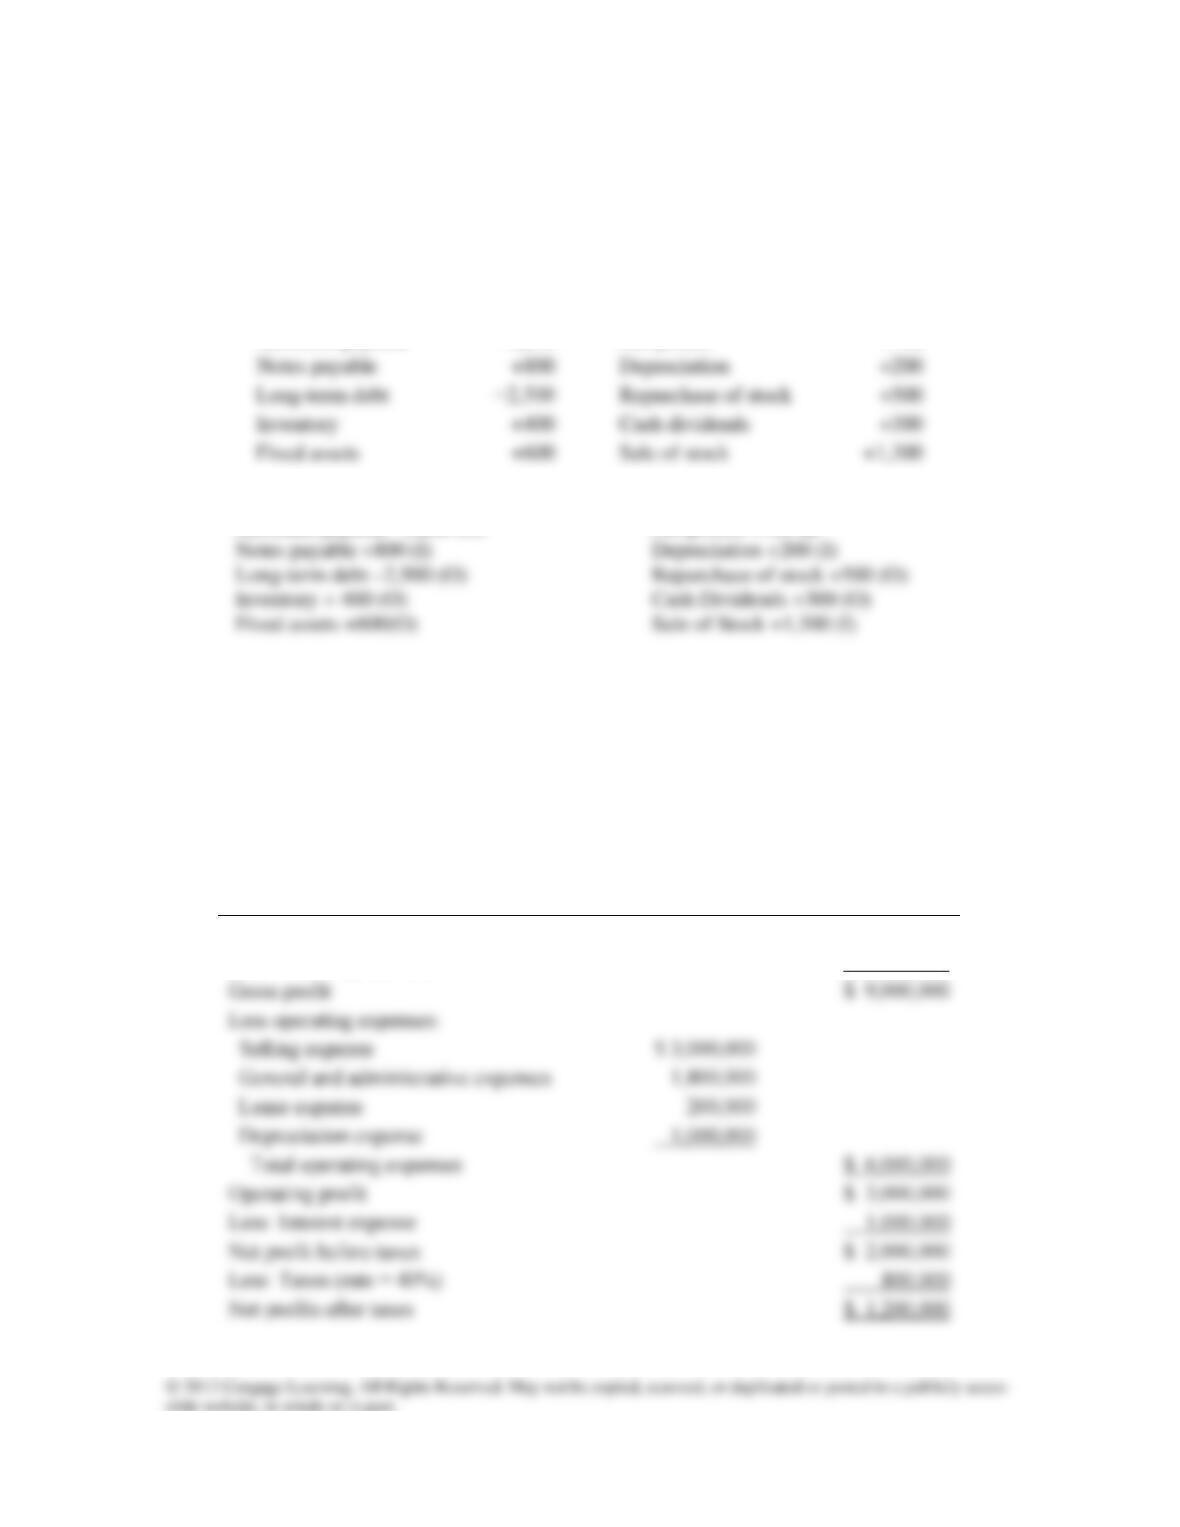
P2-4. Manufacturers Bank is evaluating Aluminum Industries, Inc., which has requested
a $3 million loan. On the basis of the debt ratios for Aluminum, along with the industry av-
erages and Aluminum’s recent financial statements (which follow), evaluate and recom-
mend appropriate action on the loan request.
Aluminum Industries, Inc.
Income Statement
For the Year Ended December 31, 2012
Sales revenue
$30,000,000
Less: Cost of goods sold
21,000,000
Gross profit
$ 9,000,000
Less operating expenses:
Selling expense
General and administrative expenses
Lease expense
Depreciation expense
Total operating expenses
$ 6,000,000
Operating profit
$ 3,000,000
Less: Interest expense
1,000,000
Net profit before taxes
$ 2,000,000
Less: Taxes (rate = 40%)
800,000
Net profits after taxes
$ 1,200,000
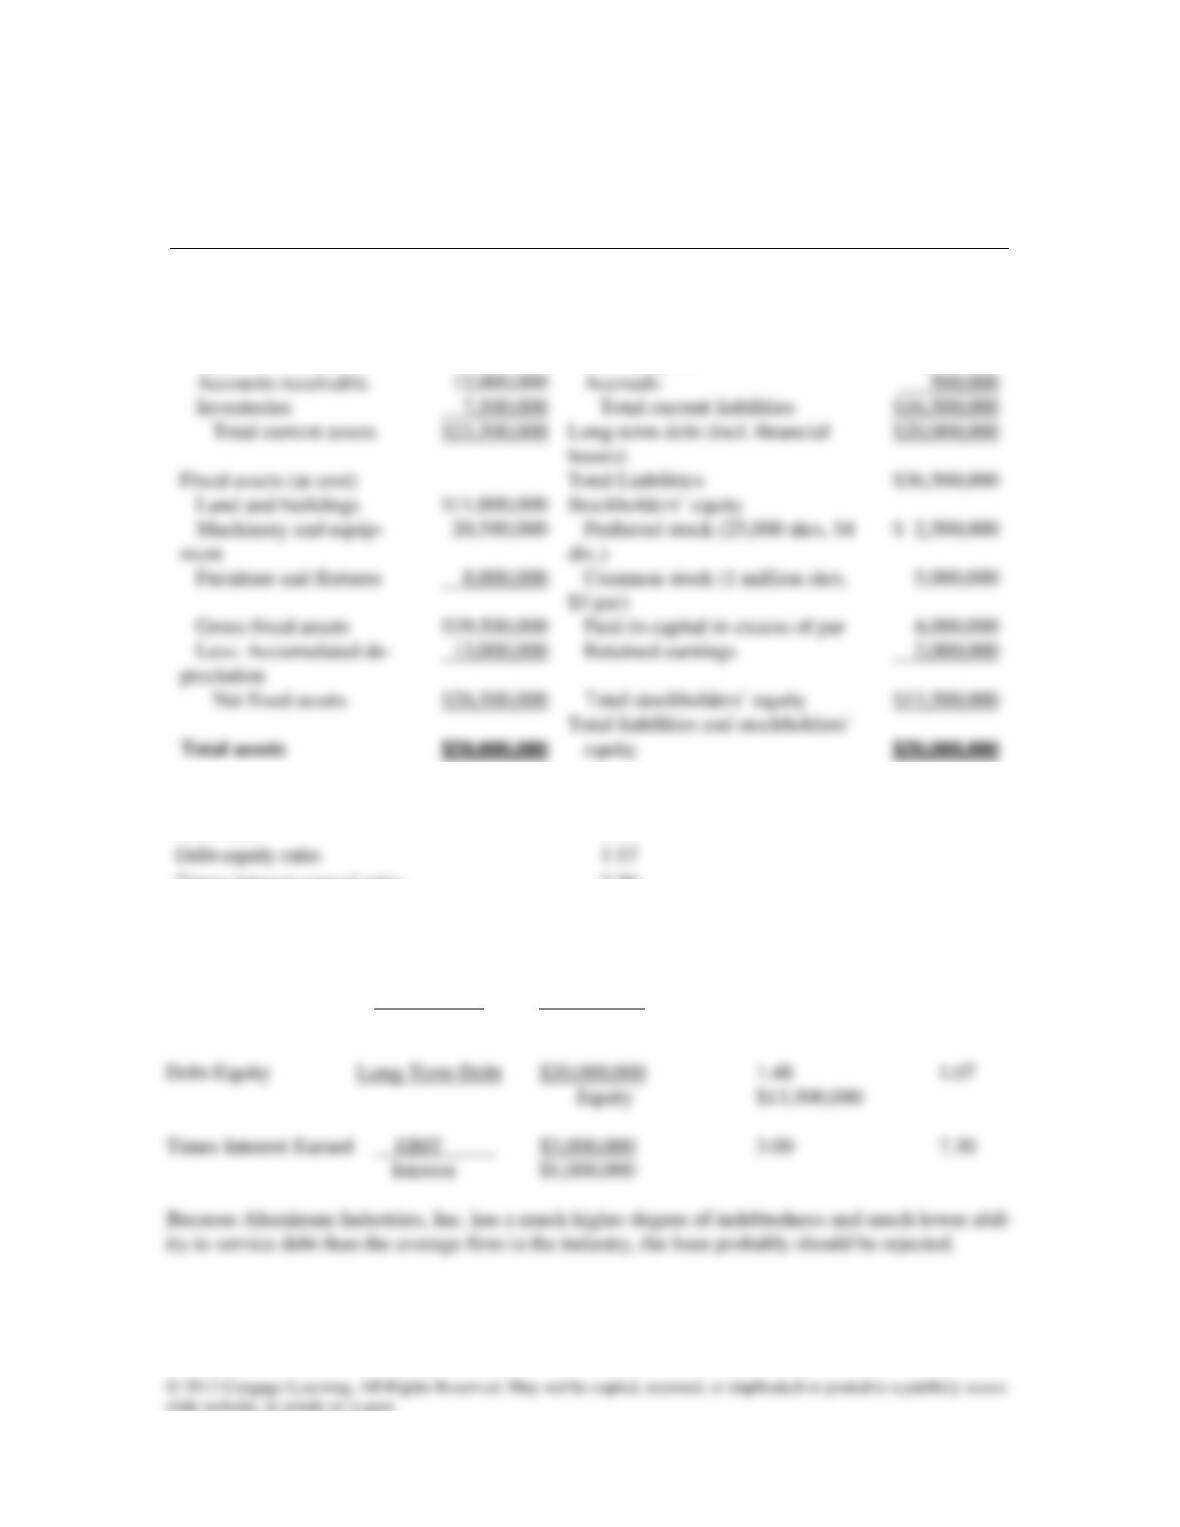
48 Instructor’s Manual
Aluminum Industries, Inc.
Balance Sheet
December 31, 2012
Assets
Liabilities and Stockholders’ Equity
Current assets
Current liabilities
Cash
$ 1,000,000
Accounts payable
$ 8,000,000
Marketable securities
3,000,000
Notes payable
8,000,000
Accounts receivable
Accruals
Inventories
7,500,000
Total current liabilities
$16,500,000
leases)
Fixed assets (at cost)
Total Liabilities
$36,500,000
Land and buildings
Gross fixed assets
Paid-in capital in excess of par
4,000,000
Net fixed assets
$26,500,000
Total stockholders’ equity
$13,500,000
Total liabilities and stockholders’
equity
Industry Averages
Debt ratio
0.51
Debt-equity ratio
1.07
Times interest earned ratio
7.30
A2-4.
Ratio Definition Calculation Aluminum Industry Avg.
Debt Debt $36,500,000 .73 .51
Total Assets $50,000,000
Chapter 2 Financial Statement and Cash Flow Analysis 49
P2-5. Use the following information to answer the questions that follow.
Income Statements
For the Year Ended December 31, 2012
Heavy Metal
Manufacturing
(HMM)
Metallic Stamp-
ing Inc. (MS)
High-Tech Software
Co. (HTS)
Sales
$75,000,000
$50,000,000
$100,000,000
65,000,000
40,000,000
60,000,000
Operating profit
$10,000,000
$10,000,000
$ 40,000,000
3,000,000
3,000,000
0
Earnings before taxes
$ 7,000,000
$ 7,000,000
$ 40,000,000
2,800,000
2,800,000
16,000,000
Net income
$ 4,200,000
$ 4,200,000
$ 24,000,000
Balance Sheet
As of December 31, 2012
Heavy Metal
Manufacturing (HMM)
Metallic Stamping
Inc. (MS)
High-Tech Soft-
ware Co. (HTS)
Current assets
$ 10,000,000
$ 5,000,000
$ 20,000,000
Net fixed assets
90,000,000
75,000,000
80,000,000
Total assets
$100,000,000
$80,000,000
$100,000,000
Current liabilities
$ 20,000,000
$10,000,000
$ 10,000,000
Long-term debt
40,000,000
40,000,000
Total liabilities
$ 60,000,000
$50,000,000
$ 10,000,000
Common stock
$ 15,000,000
$10,000,000
$ 25,000,000
Retained earnings
25,000,000
20,000,000
65,000,000
Total common equity
$ 40,000,000
$30,000,000
$ 90,000,000
$100,000,000
$80,000,000
$100,000,000
a. Use the DuPont system to compare the two heavy metal companies shown above
(HMM and MS) during 2012. Which of the two has a higher return on common equi-
ty? What is the cause of the difference between the two?
b. Calculate the return on common equity of the software company, HTS. Why is this
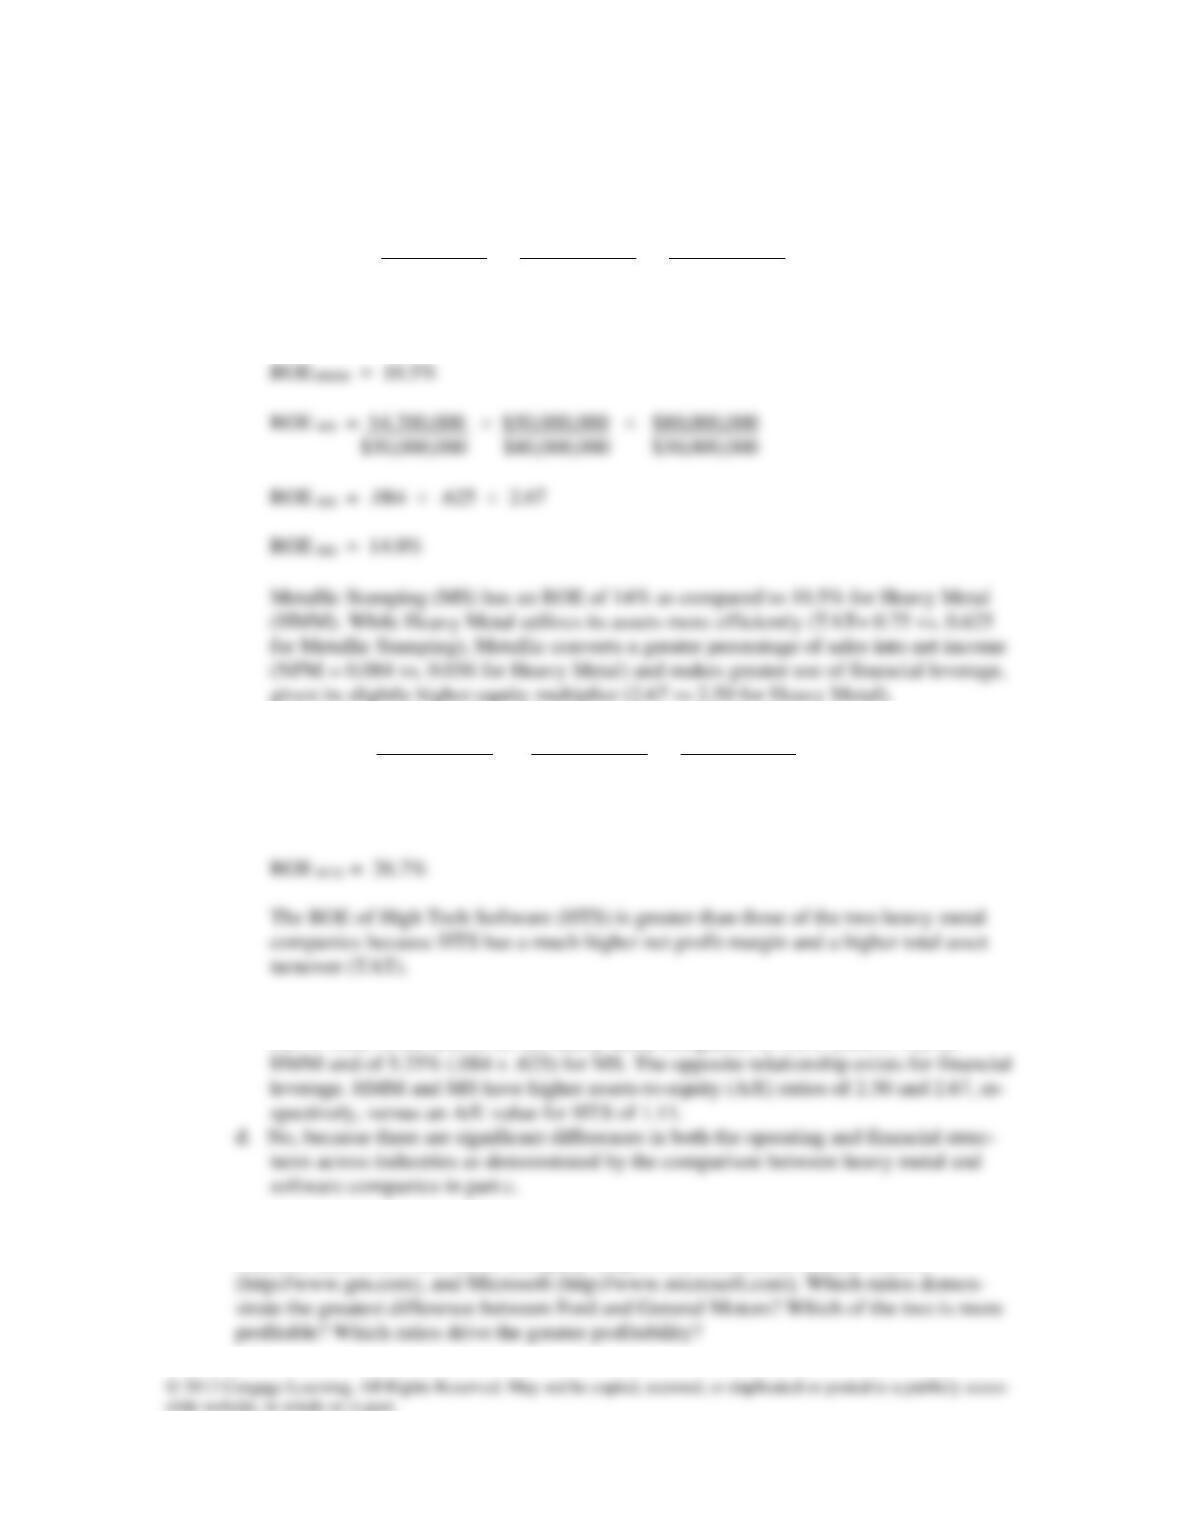
50 Instructor’s Manual
A2-5. a. ROE = Net Profit Margin (NPM) Total Asset Turnover (TAT) Financial
leverage multiplier (A/E)
ROE HMM = $4,200,000 $75,000,000 $100,000,000
$75,000,000 $100,000,000 $40,000,000
ROE HMM = .056 .75 2.50
b. ROE HTS = $24,000,000 $100,000,000 $100,000,000
$100,000,000 $100,000,000 $90,000,000
ROE HTS = .24 1 1.11
c. The software company generates much higher returns on total assets (ROAs) of 24%
(.24 x 1.00) versus ROAs for the heavy metal companies of 4.2% (.056 x .75) for
P2-6. Refer to Problem 2-5 and perform the same analysis with real data. Download last year’s
financial data from Ford Motor Company (http://www.ford.com), General Motors
Chapter 2 Financial Statement and Cash Flow Analysis 51
A2-6. Internet exercise – answers will vary.
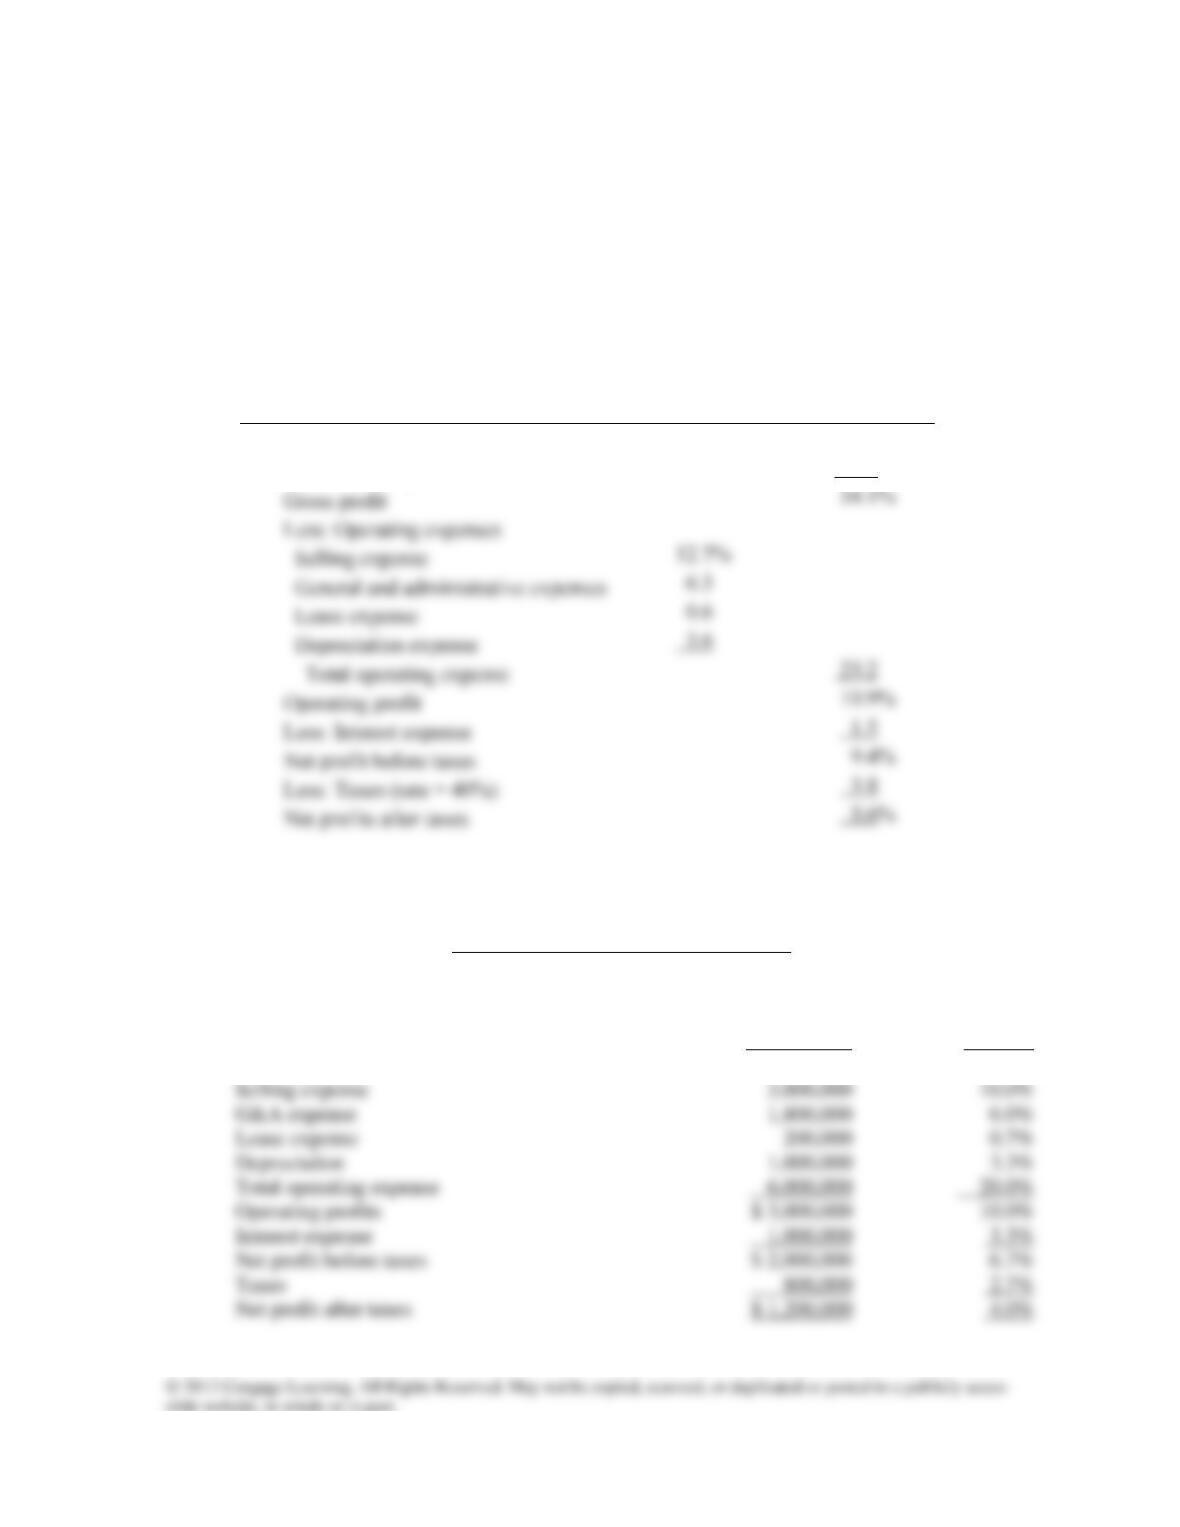
P2-7. A common-size income statement for Aluminum Industries’ 2011 operations follows. Us-
ing the firm’s 2012 income statement presented in Problem 2-4, develop the 2012 com-
mon-size income statement (see footnote 2) and compare it to the 2011 statement. Which
areas require further analysis and investigation?
Aluminum Industries, Inc.
Common-Size Income Statement
For the Year Ended December 31, 2011 .
Sales revenue ($35,000,000)
100.0%
Less: Cost of goods sold
65.9%
Gross profit
Less: Operating expenses
Selling expense
General and administrative expenses
Lease expense
Depreciation expense
Total operating expense
23.2%
Operating profit
Less: Interest expense
Net profit before taxes
Less: Taxes (rate = 40%)
Net profits after taxes
A2-7.
Aluminum Industries
Income Statement
For the Year Ended December 31, 2012.
Common
Size %
Sales $30,000,000 100.0%
Cost of goods sold 21,000,000 70.0%
Gross profit $ 9,000,000 30.0%
52 Instructor’s Manual
Sales have declined from $35 million to $30 million and cost of goods sold has increased
as a percentage of sales (from 65.9% in 2011 to 70% in 2012), probably due to a loss of
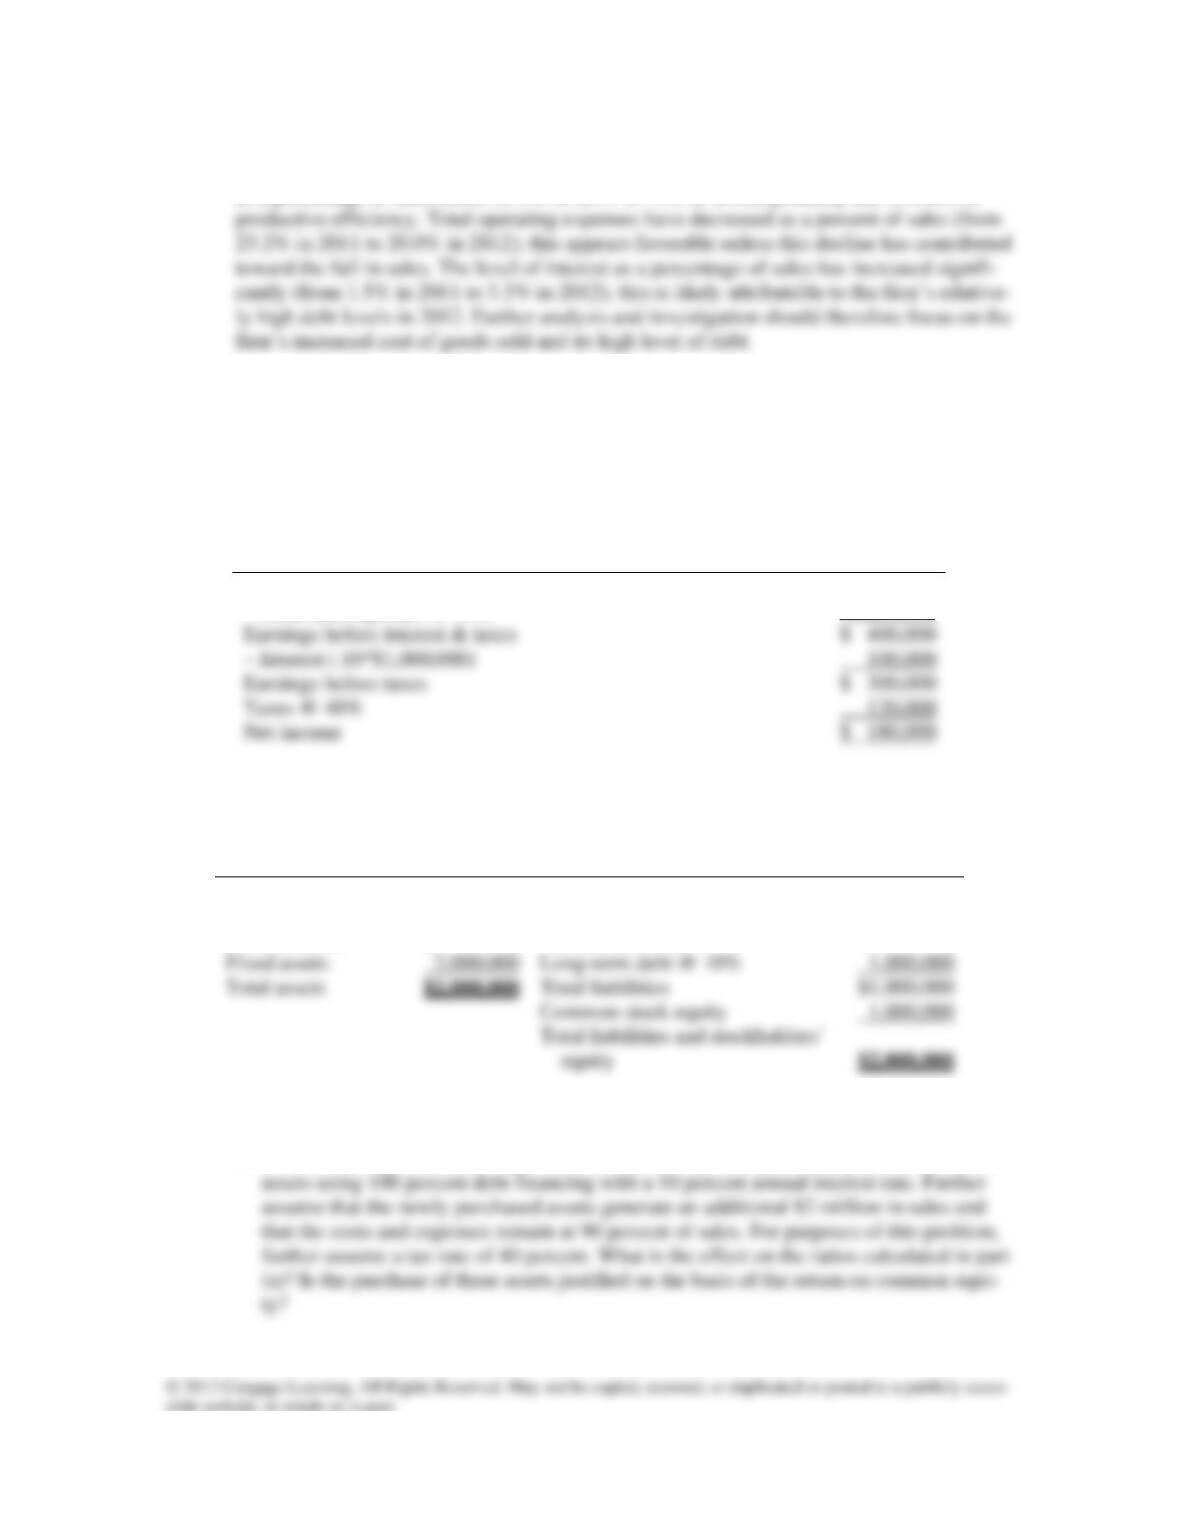
P2-8. Use the following financial data for Greta’s Gadgets, Inc., to determine the impact of using
additional debt financing to purchase additional assets. Assume that an additional $1 mil-
lion of assets is purchased with 100 percent debt financing with a 10 percent annual inter-
est rate.
Greta’s Gadgets, Inc.
Income Statement
For the Year Ended December 31, 2012
Sales
$4,000,000
– Costs and expenses @ 90%
3,600,000
Earnings before interest & taxes
$ 400,000
– Interest (.10*$1,000,000)
100,000
Earnings before taxes
$ 300,000
Taxes @ 40%
120,000
Net income
$ 180,000
Greta’s Gadgets, Inc.
Balance Sheet
As of December 31, 2012
Assets
Liabilities and Stockholders’ Equity
Current assets
$ 0
Current liabilities
$ 0
Fixed assets
Long-term debt @ 10%
Total assets
Total liabilities
Common stock equity
a. Calculate the current (2012) net profit margin, total asset turnover, assets-to-equity ra-
tio, return on total assets, and return on common equity for Greta’s Gadgets.
b. Now, assuming no other changes, determine the impact of purchasing the $1 million in
Chapter 2 Financial Statement and Cash Flow Analysis 53
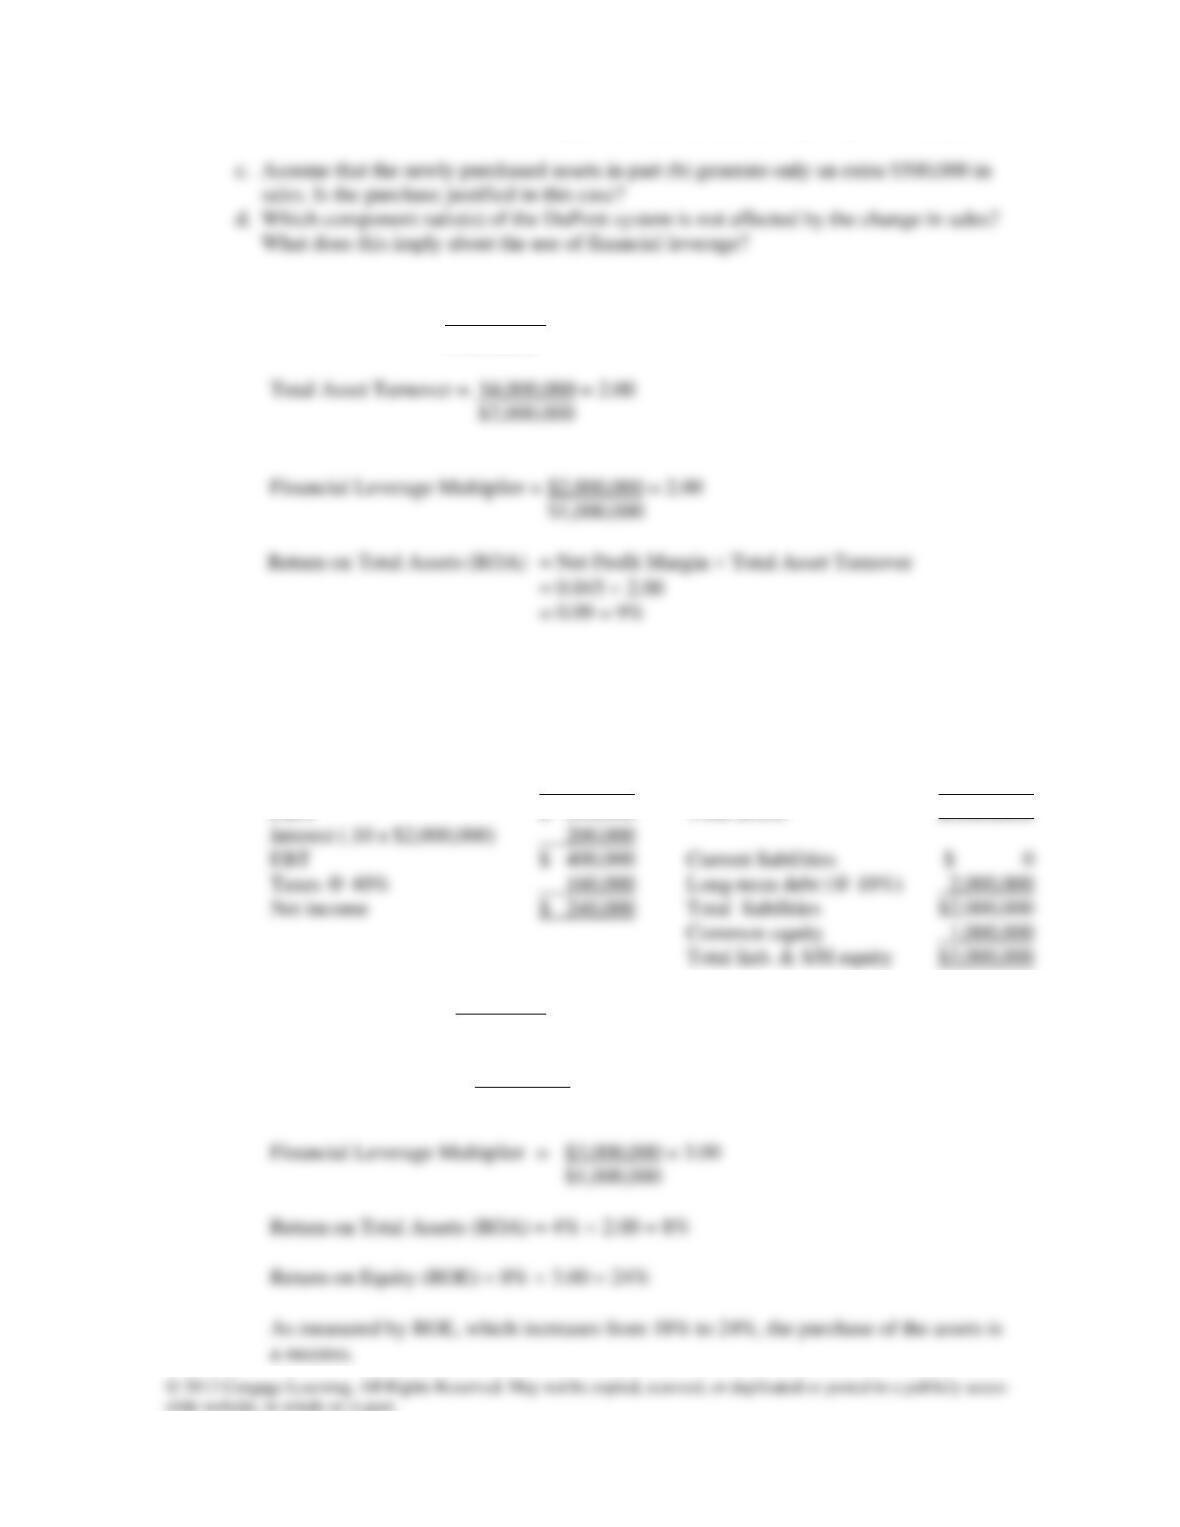
A2-8. a. Net Profit Margin = $180,000 = .045 = 4.5%
$4,000,000
Return on Equity (ROE) = Return on Total Assets Financial Leverage Multiplier
= 0.09 2.00
= .18 = 18%
b. Sales $6,000,000 Current assets $ 0
Expenses (.90 x $6,000,000) 5,400,000 Fixed assets 3,000,000
EBIT $ 600,000 Total assets $3,000,000
Net Profit Margin = $240,000 = .04 = 4%
$6,000,000
Total Asset Turnover = $6,000,000 = 2.00
$3,000,000
54 Instructor’s Manual
c. Sales $4,500,000 Current assets $ 0
Expenses (.90 x $4,500,000) 4,050,000 Fixed assets 3,000,000
Net Profit Margin = $150,000 = .0333 = 3.33%
$4,500,000
Total Asset Turnover = $4,500,000 = 1.50
$3,000,000
d. The equity multiplier is affected only by the financing decision – not by changes in
P2-9. Tracey White, the owner of the Buzz Coffee Shop chain, has decided to expand her opera-
tions. Her 2012 financial statements follow. Tracey can buy two additional coffeehouses
for $3 million, and she has the choice of completely financing these new coffeehouses with
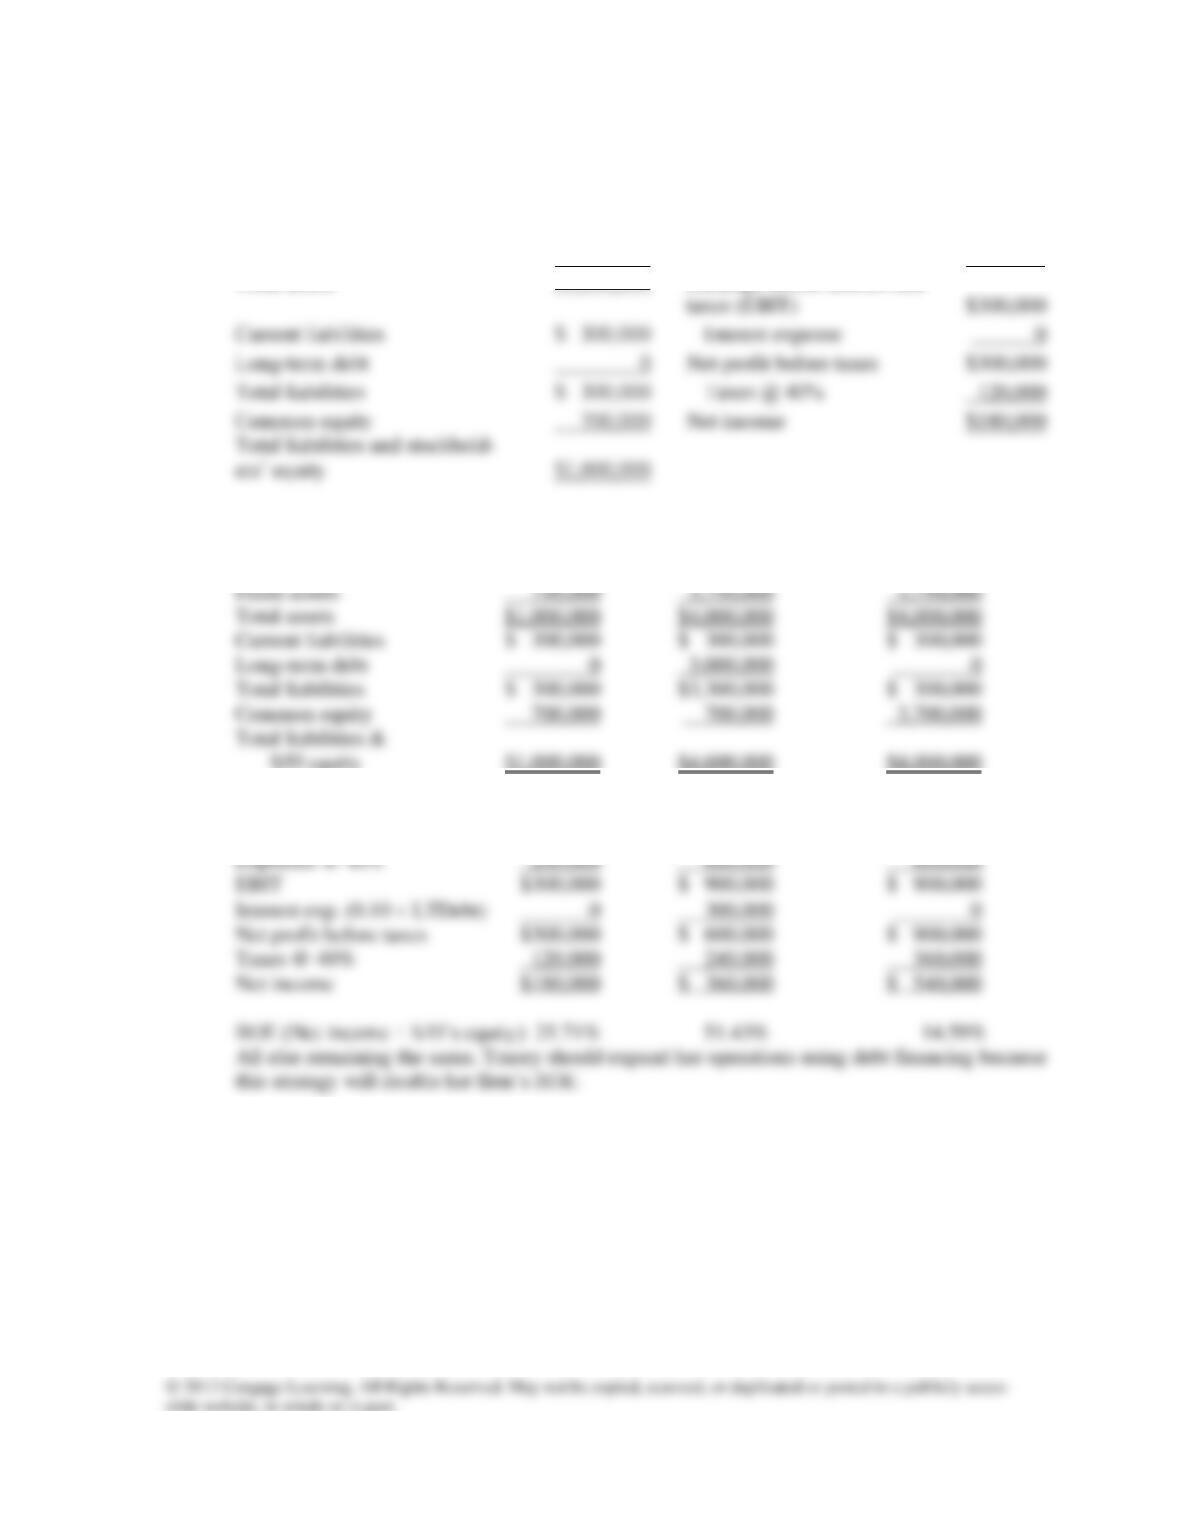
Chapter 2 Financial Statement and Cash Flow Analysis 55
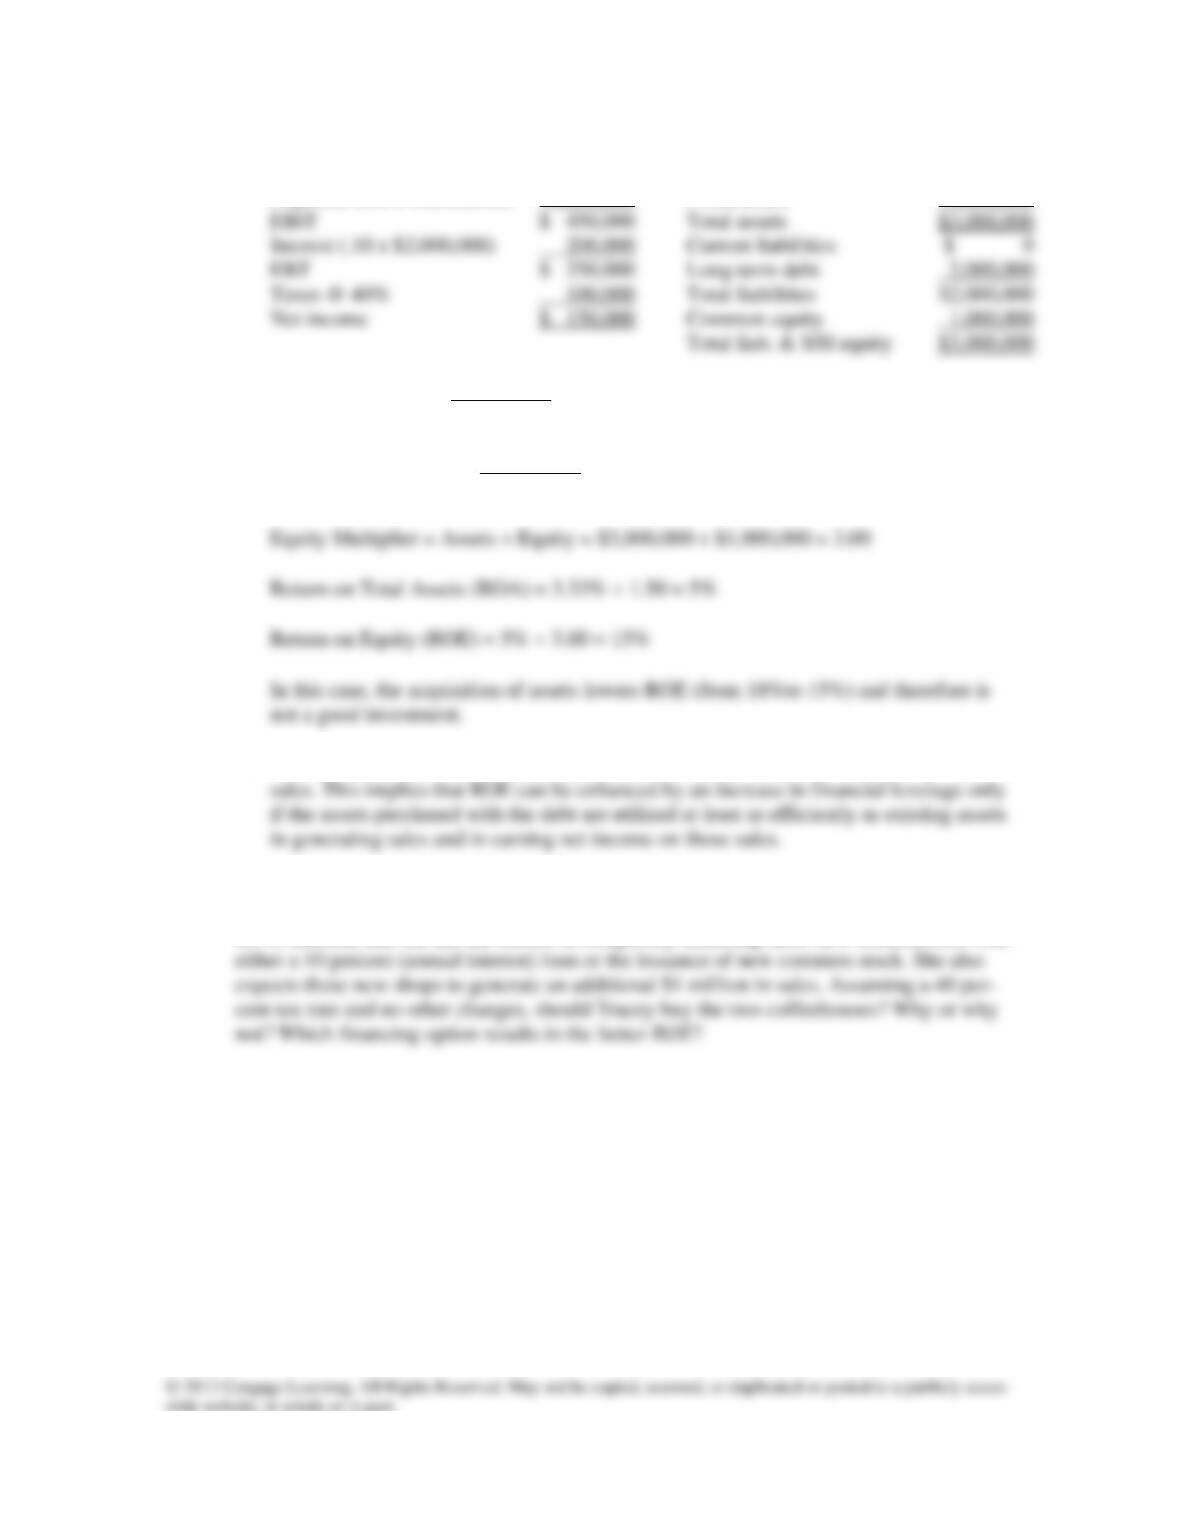
Buzz Coffee Shops, Inc. 2012 Financial Statements
Balance Sheet
Income Statement
Current assets
$ 250,000
Sales
$500,000
Fixed assets
750,000
− Costs and expenses @ 40%
200,000
Total assets
$1,000,000
$300,000
Current liabilities
$ 300,000
− Interest expense
Long-term debt
0
$300,000
Total liabilities
$ 300,000
− Taxes @ 40%
120,000
Common equity
700,000
$180,000
$1,000,000
Earnings before interest and
A2-9.
Balance Sheet Items Currently Debt Financing Stock Financing
Current assets $ 250,000 $ 250,000 $ 250,000
S/H equity $1,000,000 $4,000,000 $4,000,000
Income Statement Items Currently Debt Financing Stock Financing
Sales $500,000 $1,500,000 $1,500,000
56 Instructor’s Manual
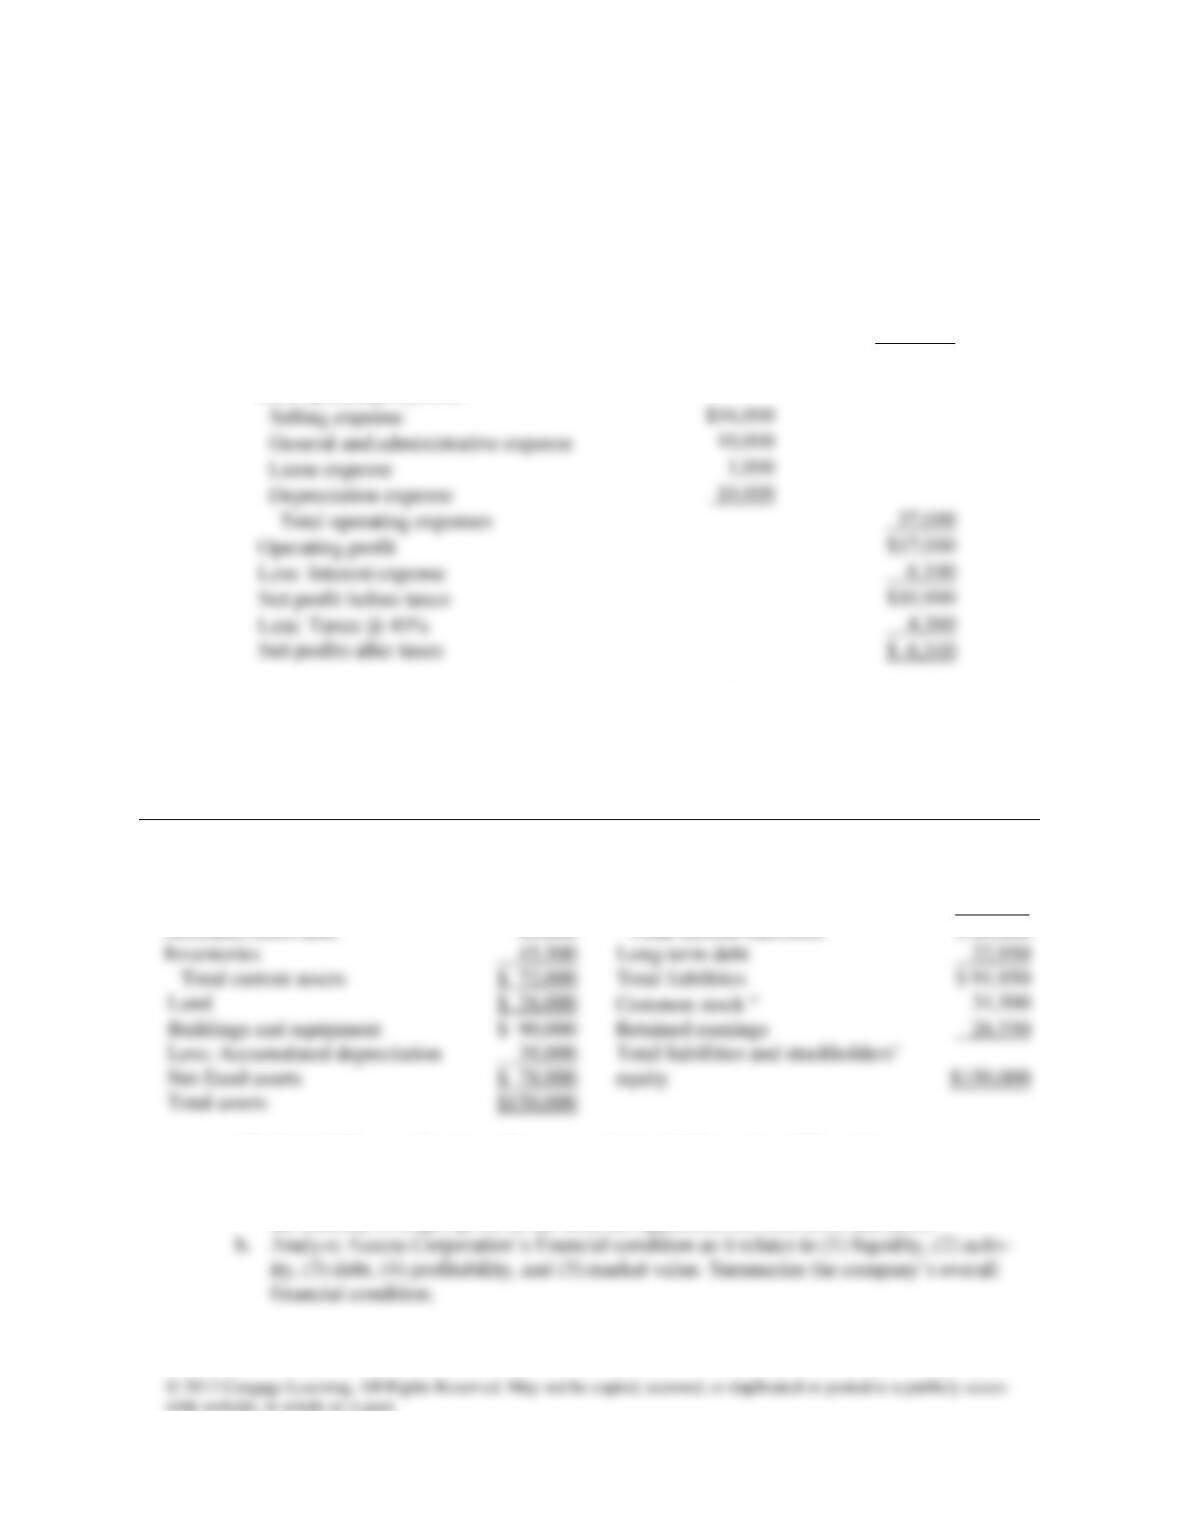
P2-10. The financial statements of Access Corporation for the year ended December 31, 2012,
follow.
Access Corporation
Income Statement
For the Year Ended December 31, 2012
__________________________________________________________________________________________________________ .
Sales revenue
$160,000
Less: Cost of goods solda
106,000
Gross profit
$ 54,000
Less operating expenses:
Selling expense
General and administrative expense
Lease expense
Depreciation expense
Total operating expenses
Operating profit
Net profit before taxes
Less: Taxes @ 40%
Net profits after taxes
aAccess Corporation’s annual purchases are estimated to equal 75 percent of cost of goods sold.
Access Corporation
Balance Sheet
As of December 31, 2012
Assets
Liabilities and Stockholders’ Equity
Cash
$ 500
Accounts payable
$ 22,000
Marketable securities
1,000
Notes payable
47,000
Accounts receivable
Total current liabilities
$ 69,000
Inventories
22,950
Total current assets
$ 91,950
26,550
$150,000
a The firm’s 3,000 outstanding shares of common stock closed 2012 at a price of $25 per share.
a. Use the preceding financial statements to complete the following table. Assume that
the industry averages given in the table are applicable for both 2011 and 2012.
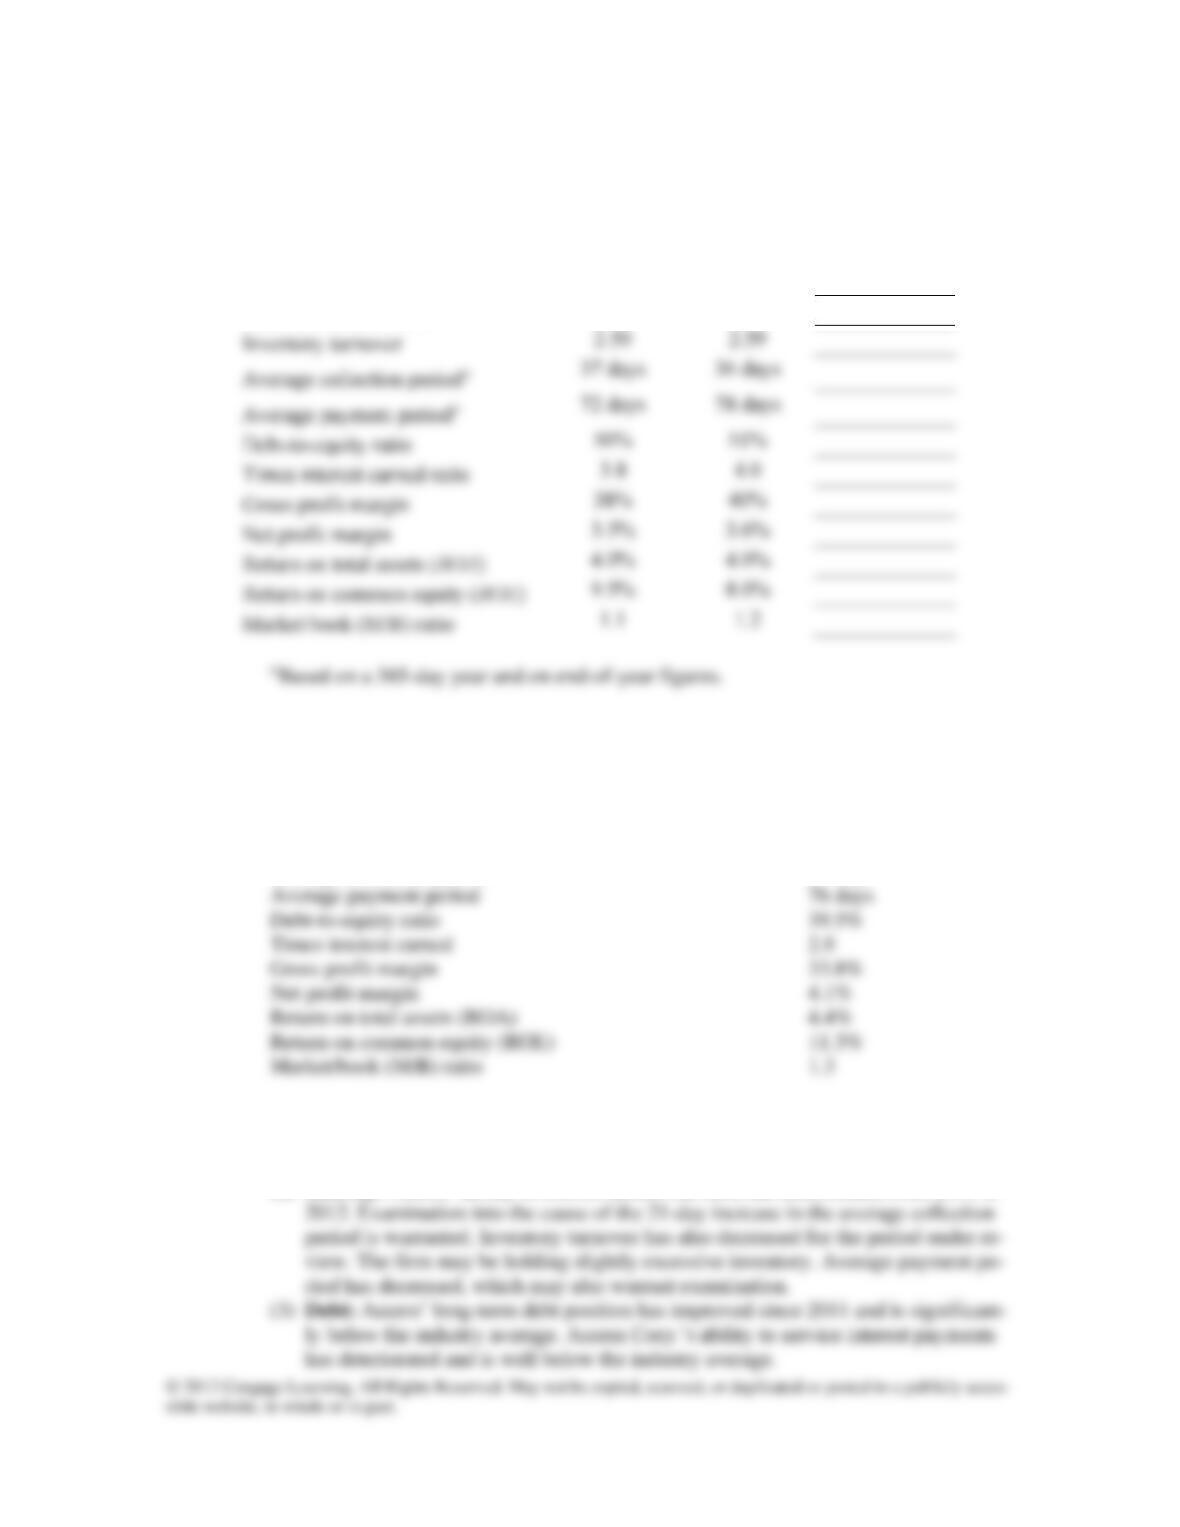
Chapter 2 Financial Statement and Cash Flow Analysis 57
Access Corporation’s Financial Ratios
Industry
Average
Actual
Ratio 2011
Actual
Ratio 2012
Current ratio
1.80
1.84
Quick (acid-test) ratio
.70
.78
Inventory turnover
2.50
2.59
50%
Times interest earned ratio
3.8
4.0
Gross profit margin
38%
Net profit margin
3.6%
Return on total assets (ROA)
4.0%
Return on common equity (ROE)
8.0%
Market/book (M/B) ratio
1.1
1.2
A2-10. a. Access Corporation – Ratio Analysis
Actual
2012
Current ratio 1.04
Quick ratio 0.38
Inventory turnover 2.33
Average collection period 57 days
b. (1) Liquidity: Access Corporation’s liquidity position has deteriorated from 2011 to
2012 and is inferior to the industry average. The firm may not be able to satisfy
short-term obligations as they come due.
(2) Activity: Access’ ability to convert assets into cash has deteriorated from 2011 to