58 Instructor’s Manual
(4) Profitability: Although the company’s gross profit margin is below its industry
average, indicating high cost of goods sold, the firm has a superior net profit mar-
(5) Market: The firm’s increasing and above-industry-average market/book ratio in-
dicates that investors are willing to pay an increasing and above-industry-average
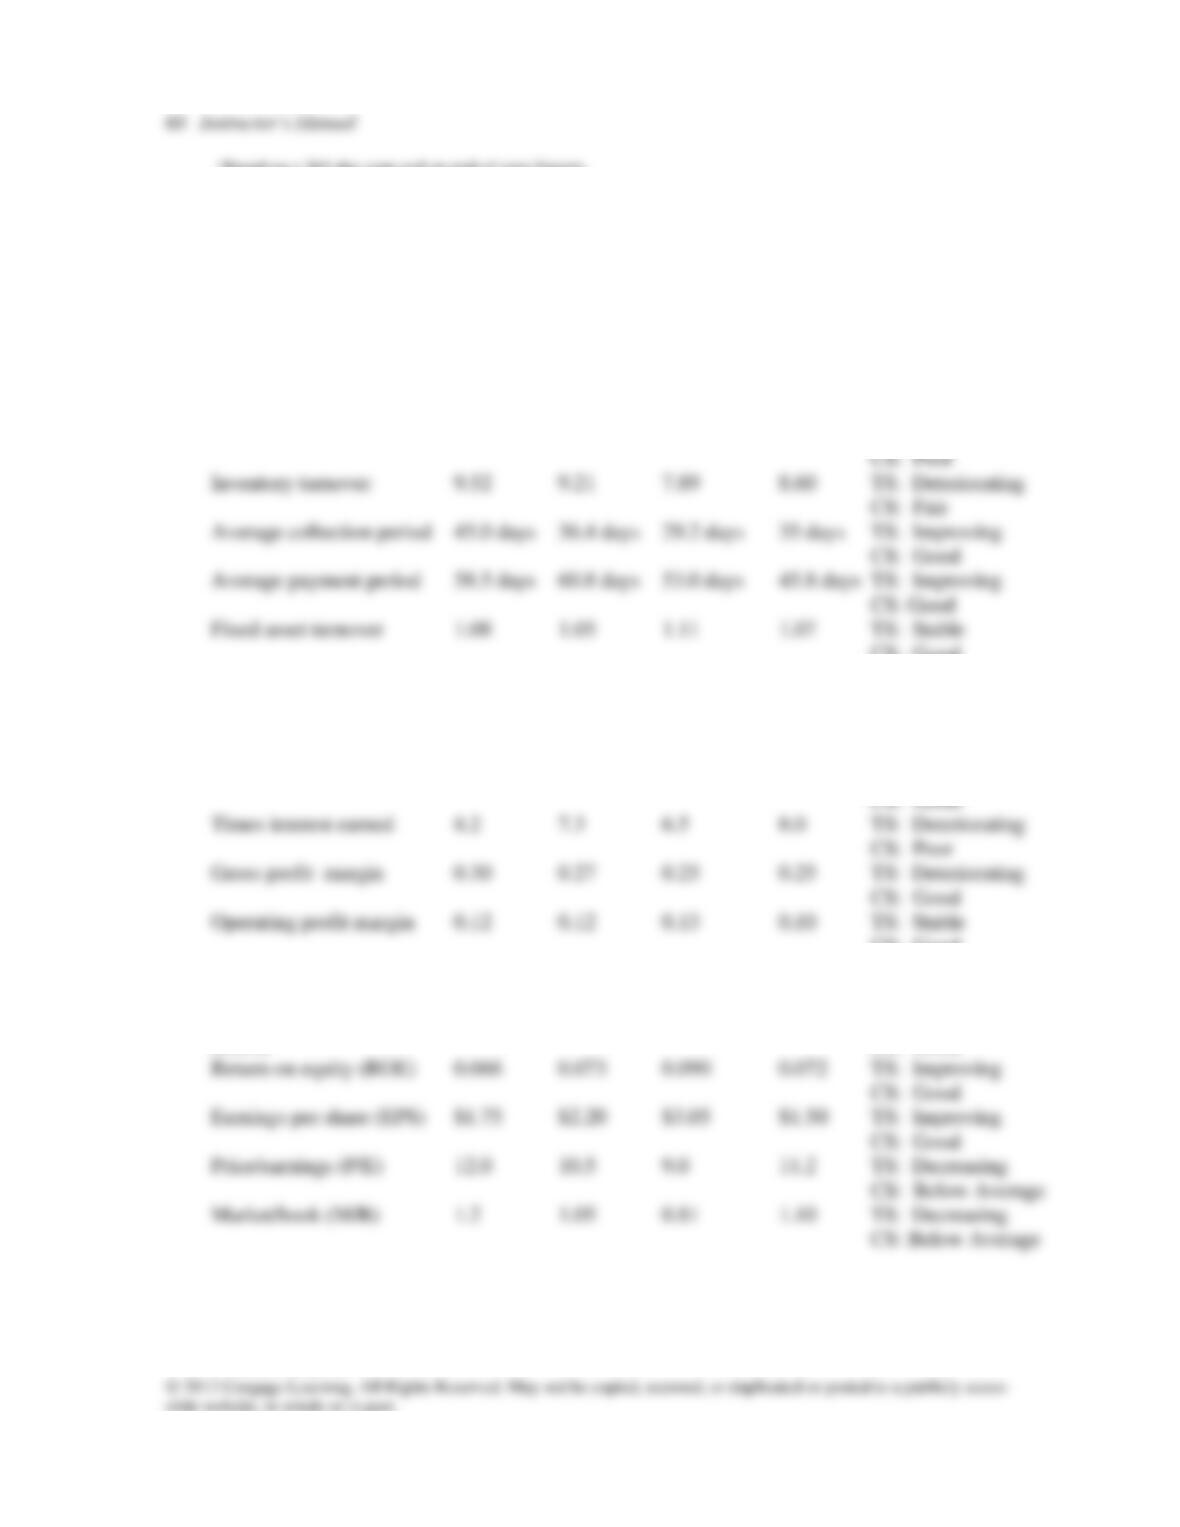
P2-11. Given the following financial statements, historical ratios, and industry averages, calculate
the UG Company’s financial ratios for 2012. Analyze its overall financial situation both in
comparison to industry averages and over the period 2010–2012. Break your analysis into
an evaluation of the firm’s liquidity, activity, debt, profitability, and market value.
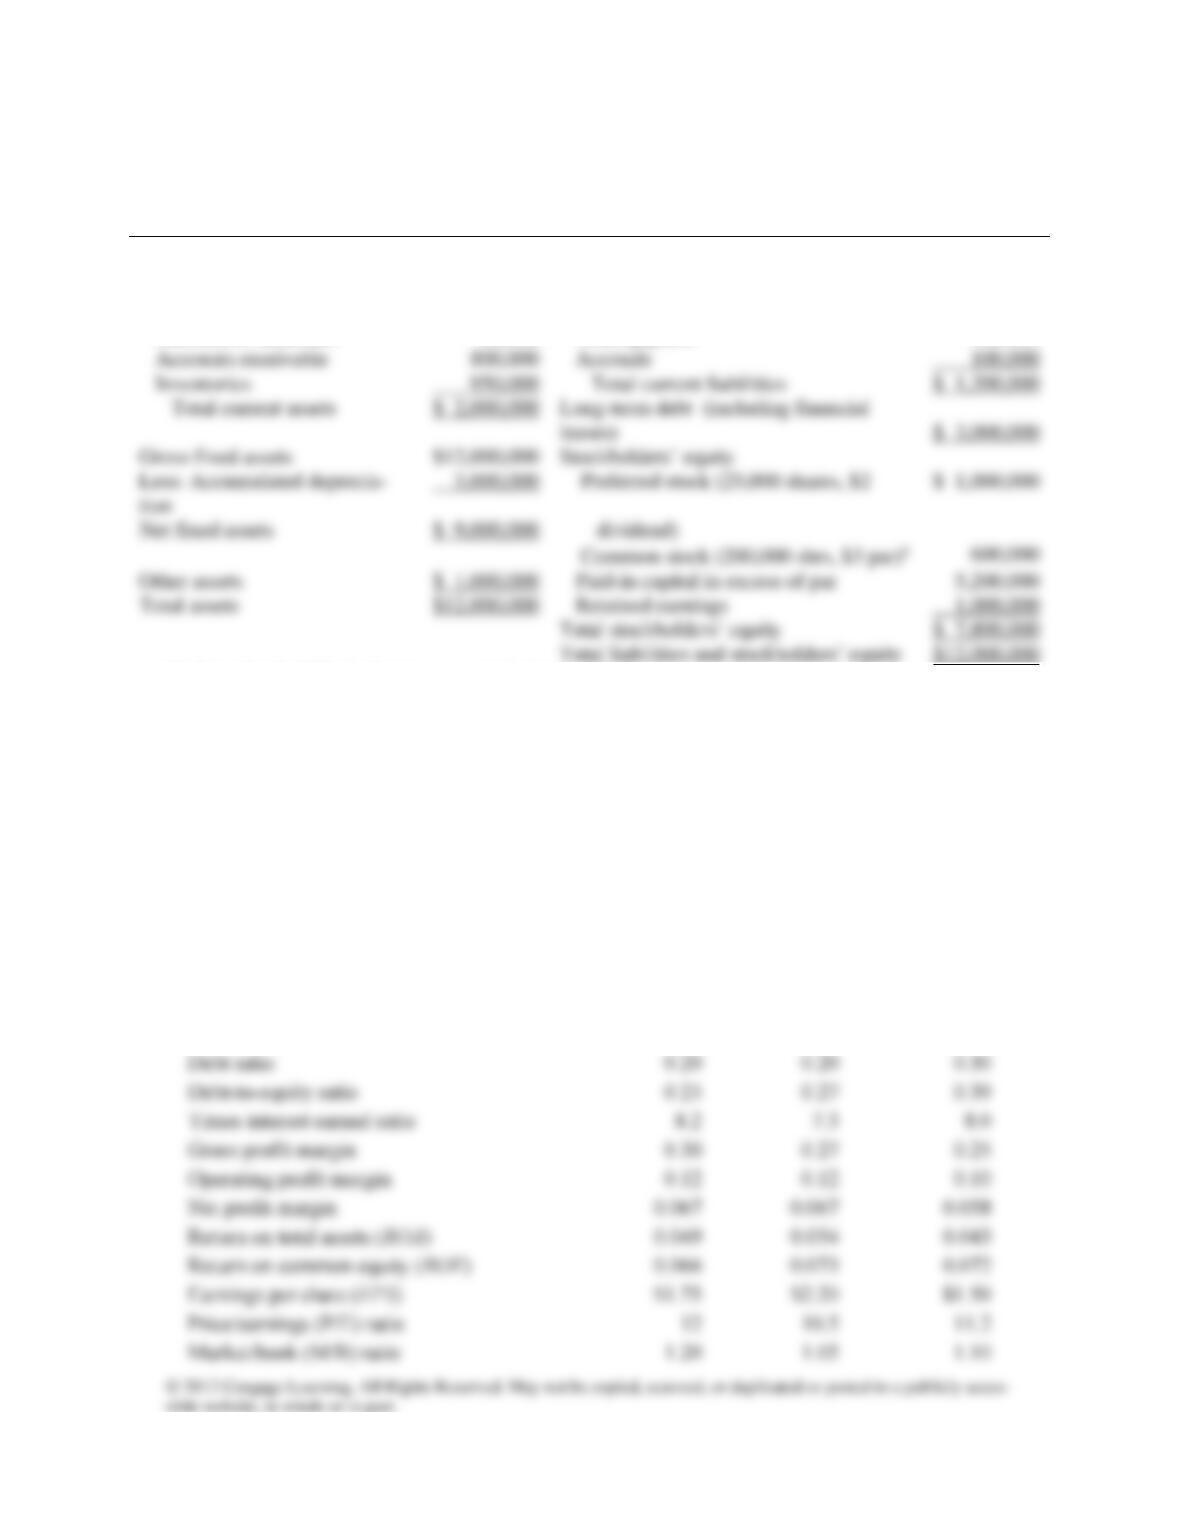
UG Company
Income Statement
For the Year Ended December 31, 2012
_______________________________________________________________________________
Sales revenue
$10,000,000
Less: Cost of goods solda
7,500,000
Gross profit
$ 2,500,000
Less operating expenses:
Selling expense
General and administrative expense
Lease expense
Depreciation expense
Total operating expense
1,200,000
Operating profit (EBIT)
$1,300,000
Less: Interest expense
200,000
Net profits before taxes
$1,100,000
Less: Taxes (rate = 40%)
440,000
Less: Preferred stock dividends
50,000
Earnings available for common stockholders
$ 610,000
Earnings per share (EPS)
Chapter 2 Financial Statement and Cash Flow Analysis 59
UG Company
Balance Sheet
As of December 31, 2012
Assets
Liabilities and Stockholders’ Equity
Current assets
Current liabilities
Cash
$ 200,000
Accounts payable
$ 900,000
Marketable securities
50,000
Notes payable
200,000
Accounts receivable
Accruals
100,000
Inventories
Total current liabilities
$ 1,200,000
leases)
$ 3,000,000
Gross fixed assets
Net fixed assets
$ 9,000,000
dividend)
Other assets
Paid-in capital in excess of par
Total assets
Retained earnings
1,000,000
$ 7,800,000
$12,000,000
aOn December 31, 2009, the firm’s common stock closed at $27.50.
UG Company
Historical and Industry Average Ratios
Industry Ratio
Actual 2010
Actual 2011
Industry
Average
2012
Current ratio
1.4
1.55
1.85
Quick (acid-test) ratio
1.00
0.92
1.05
Inventory turnover
9.52
9.21
8.60
Average collection perioda
45.0 days
36.4 days
35.0 days
Average payment perioda
58.5 days
60.8 days
45.8 days
Fixed asset turnover
1.08
1.05
1.07
Total asset turnover
0.74
0.80
0.74
Debt ratio
0.20
0.20
0.30
0.25
0.27
0.39
Times interest earned ratio
8.2
Gross profit margin
0.30
0.27
0.25
Operating profit margin
0.12
0.12
0.10
Net profit margin
Return on total assets (ROA)
Return on common equity (ROE)
Earnings per share (EPS)
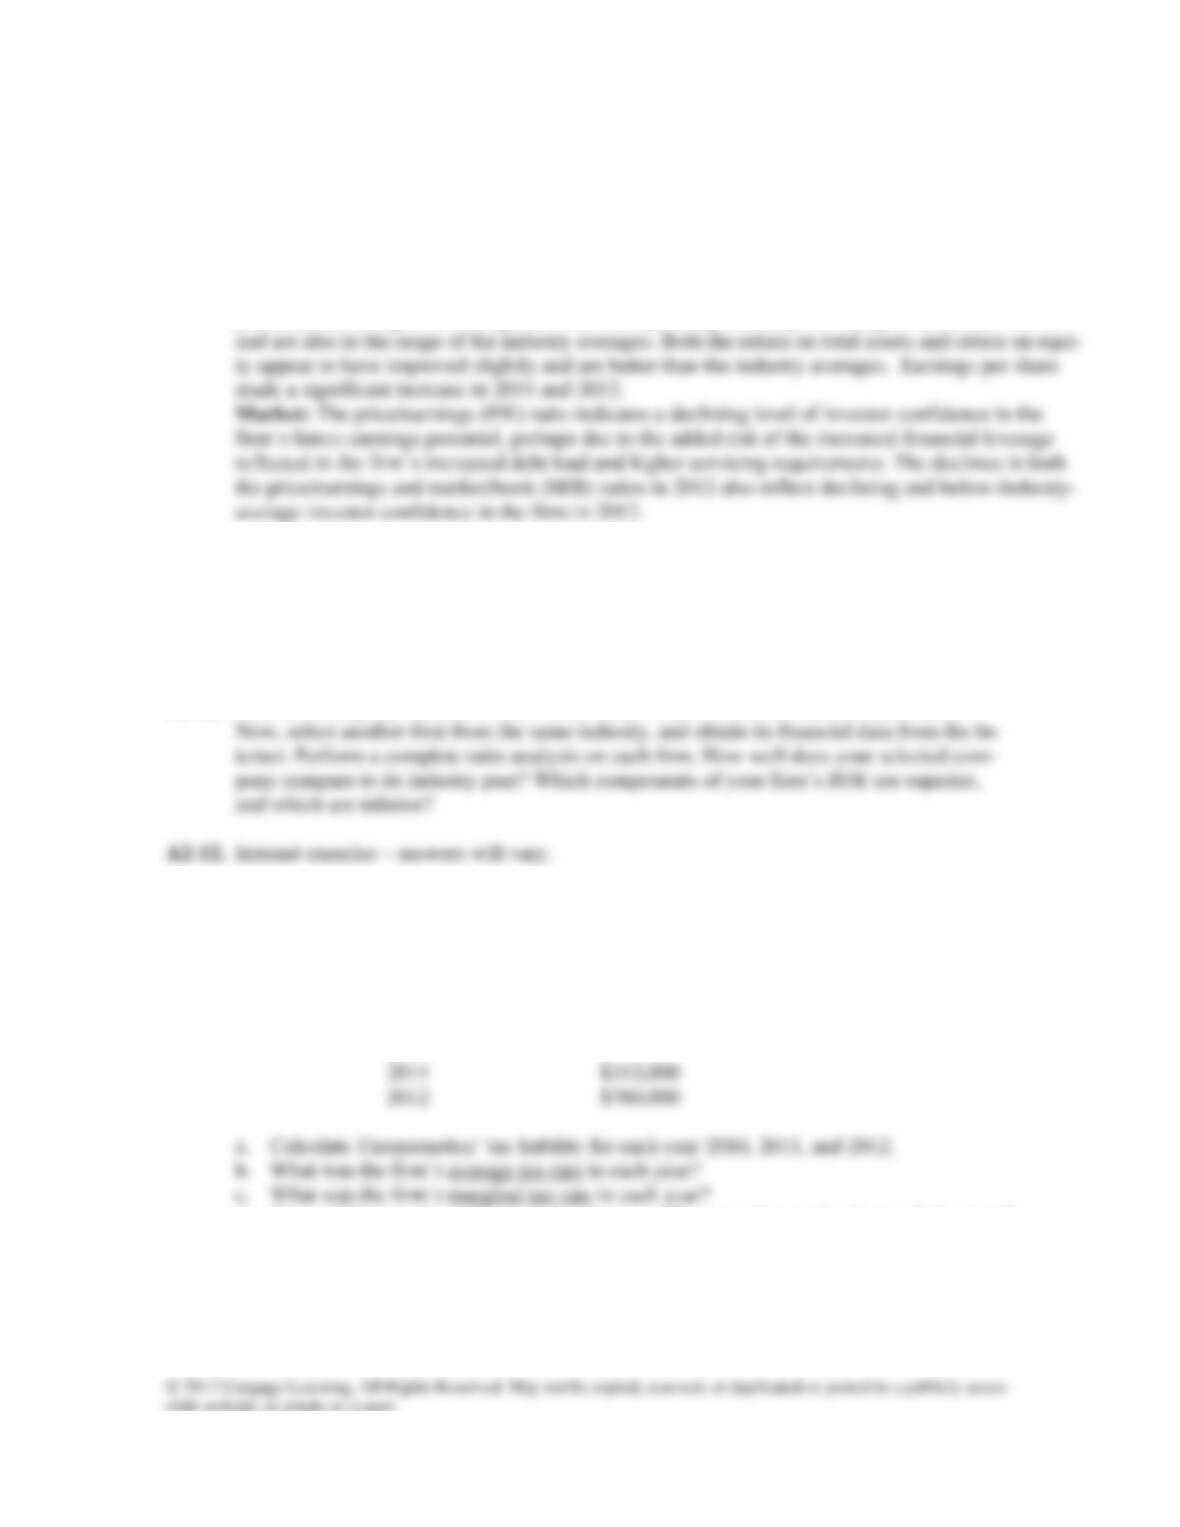
A2-11. Complete Ratio Analysis:
UG Company
Ratio Analysis
Liquidity: UG Company’s overall liquidity as reflected by the current ratio and quick ratio appears
to have remained relatively stable but both are below the industry average. The quick ratio is par-
ticularly poor.
Actual
Actual
Actual
Industry
Time Series (TS)
Ratio
2010
2011
2012
2012
Cross-Sectional (CS)
Current ratio
1.40
1.55
1.67
1.85
TS: Improving
CS: Fair
Quick ratio
1.00
0.92
0.88
1.05
Inventory turnover
9.52
9.21
7.89
8.60
TS: Deteriorating
CS: Fair
Average payment period
58.5 days
60.8 days
53.0 days
45.8 days
TS: Improving
CS: Good
Fixed asset turnover
1.08
1.05
1.11
1.07
TS: Stable
TS: Deteriorating
CS: Good
Total asset turnover
0.74
0.80
0.83
0.74
TS: Improving
CS: Good
Debt ratio
0.20
0.20
0.35
0.30
TS: Increasing
CS: Fair
Debt-to-equity ratio
0.25
0.27
0.38
0.39
Gross profit margin
0.30
0.27
0.25
0.25
TS: Deteriorating
CS: Good
Operating profit margin
0.12
0.12
0.13
0.10
TS: Stable
TS: Increasing
CS: Good
Net profit margin
0.067
0.067
0.061
0.058
TS: Stable
CS: Good
Return on total assets
(ROA)
0.049
0.054
0.051
0.043
TS: Improving
CS: Good
Earnings per share (EPS)
$1.75
$2.20
$3.05
$1.50
TS: Improving
CS: Good
Price/earnings (P/E)
12.0
10.5
9.0
11.2
TS: Decreasing
CS: Below Average
Market/book (M/B)
1.2
1.05
0.81
1.10
TS: Decreasing
CS: Below Average
Chapter 2 Financial Statement and Cash Flow Analysis 61
Activity: The activity of accounts receivable has improved, but inventory turnover has deteriorated
and is currently below the industry average. It has brought its long payables down to below the in-
dustry average.
Debt: The firm’s debt ratios have increased from 2010 and are very close to the industry averages,
indicating currently acceptable values but an undesirable trend.
Profitability: The firm’s gross profit margin, while in line with the industry average, has declined,
probably due to higher cost of goods sold. The operating and net profit margins have been stable
In summary, the firm needs to attend to inventory and should not incur added debts un-
til their leverage and interest coverage ratios are improved. Other than these indicators, the
firm appears to be doing well operationally— particularly in generating return on sales. UG
Company is out-performing the industry average values in terms of profitability, but it is
under-performing in terms of the market valuation ratios (P/E and M/B).
P2-12. Choose a company that you would like to analyze, and obtain its financial statements.
Corporate Taxes
P2-13. Thomsonetics, Inc., a rapidly growing early stage technology company, had the pretax in-
come noted below for calendar years 2010-2012. The firm was subject to corporate taxes
consistent with the rates shown in Table 2.6 of the text.
Year
Pretax Income
2010
$ 87,000
2012
$760,000
d. If in addition to its ordinary pretax income, Thomsonetics realized a capital gain of
$80,000 during calendar year 2011, what effect would this have on its tax liability, av-
erage tax rate, and marginal tax rate in 2011?
e. Which tax rate – average or marginal – should Thomsonetics use in decision-making?
Why?
62 Instructor’s Manual
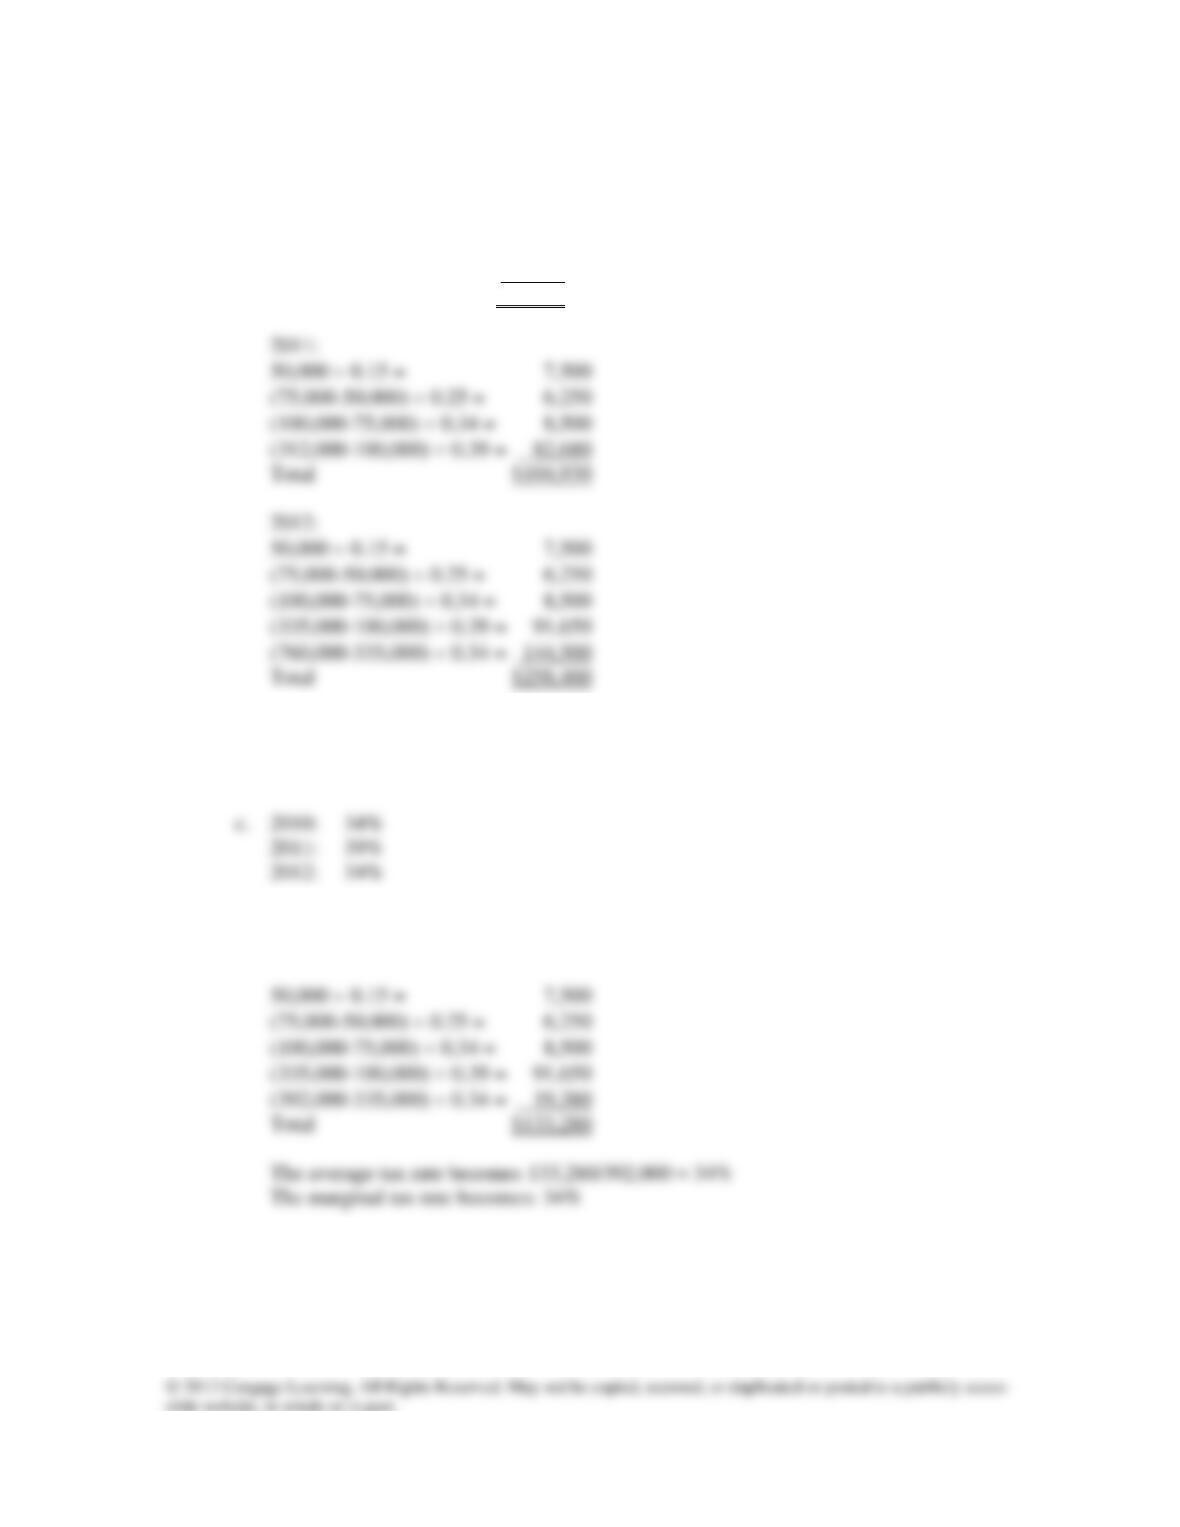
A2-13. a. 2010:
50,000 0.15 = 7,500
(75,000-50,000) 0.25 = 6,250
(87,000-75,000) 0.34 = 4,080
Total $17,830
b. 2010: 17,830/87,000 = 20.49%
2011: 104,930/312,000 = 33.63%
2012: 258,400/760,000 = 34%
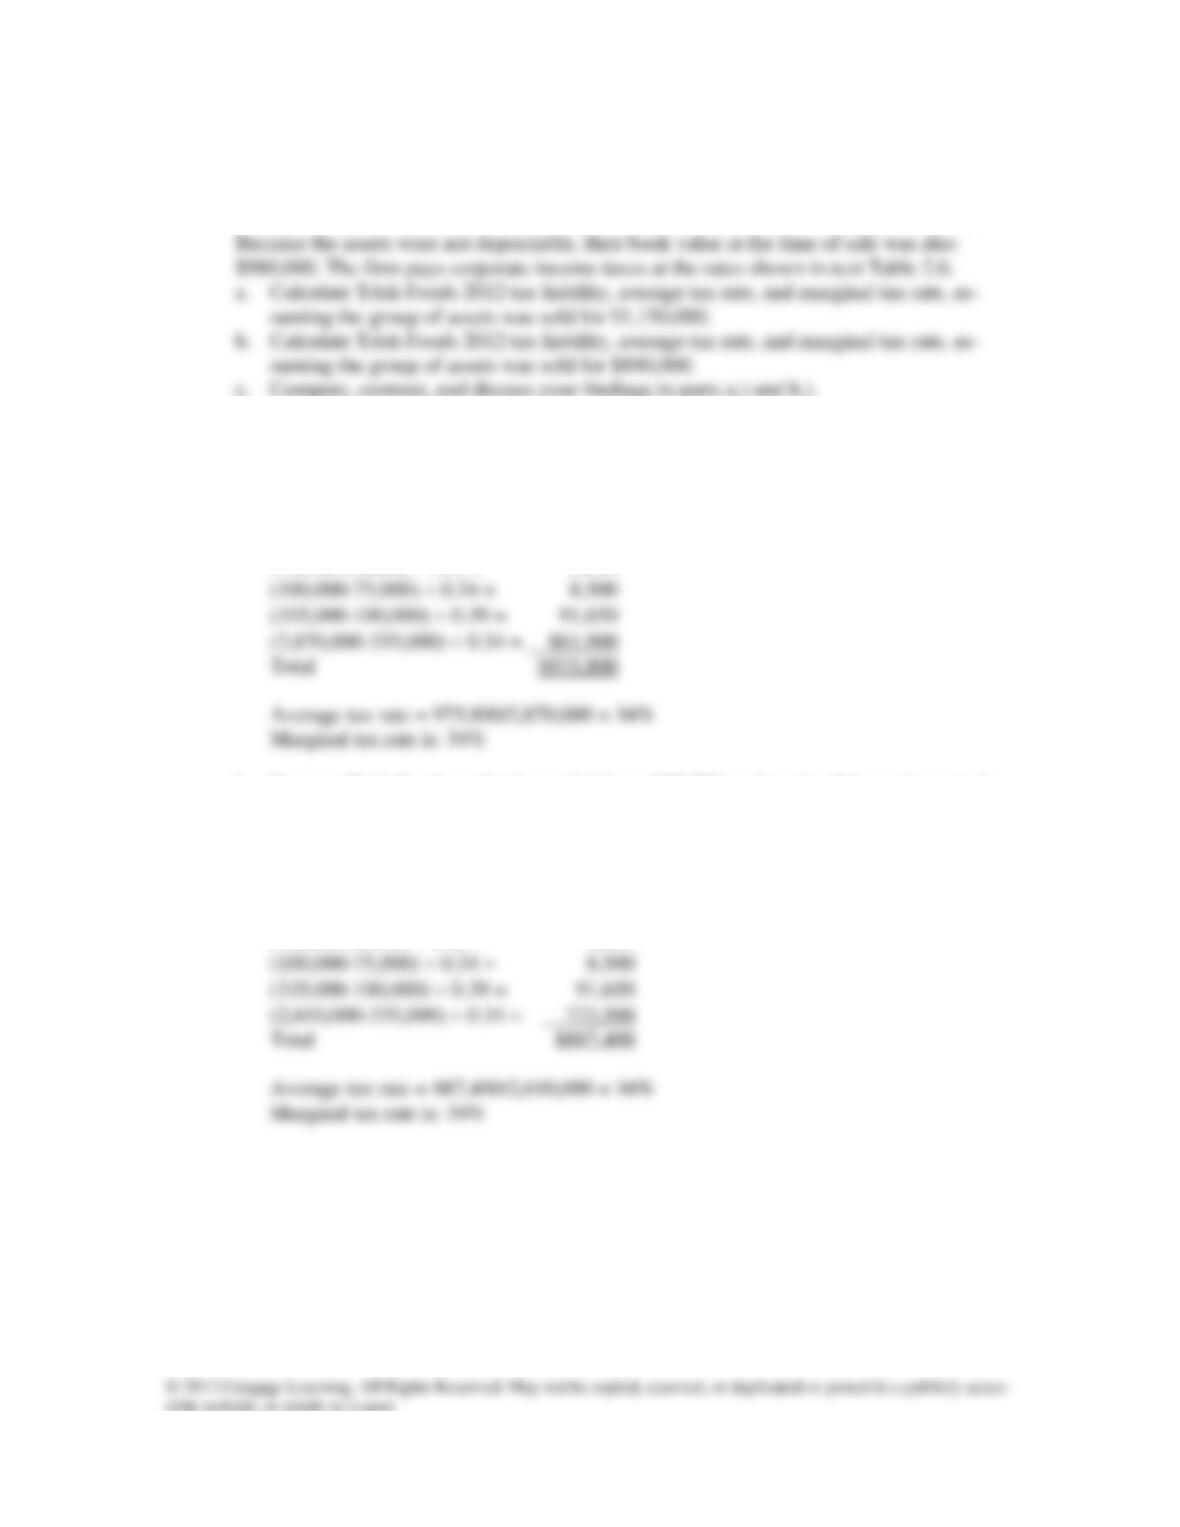
d. Total income in 2011 would be 312,000 + 80,000 = 392,000. Consequently, tax liabil-
ity would become:
e. Thomsonetics should use their marginal tax rate in decision making. It is the important
tax rate as it shows what the company will have to pay if it generates new cash flows in
the future.
Chapter 2 Financial Statement and Cash Flow Analysis 63
P2-14. Trish Foods, Inc. had pretax ordinary corporate income during 2012 of $2.7 million. In
addition during the year, Trish Foods sold a group of non-depreciable business assets (in
the 5-year depreciation class) that it had purchased new for $980,000 three years earlier.
A2-14. a. Because Trish Foods realized a capital gain of 1,150,000 – 980,000 = 170,000 from the
sale of the equipment, its total income is 2,700,000 +170,000 = 2,870,000 and its tax liabil-
ity is:
50,000 0.15 = 7,500
(75,000-50,000) 0.25 = 6,250
b. Because Trish Foods realized a capital loss of 90,000 on the sale of the equipment, its
total income is 2,700,000 – 90,000 = 2,610,000.
The tax liability is:
50,000 0.15 = 7,500
(75,000-50,000) 0.25 = 6,250
c. The average and marginal tax rates are 34% in both a.) and b.). While capital gains and
losses affect taxable income, the marginal tax rate remains the same in both cases be-
cause the gains/losses are not substantial enough to move the company into a different
tax bracket.
THOMSON ONE Business School Edition:
Access financial information from the Thomson ONE – Business School Edition Web site for the
following problem(s). Go to http://tobsefin.swlearning.com/. If you have already registered your
64 Instructor’s Manual
access serial number and have a username and password, click Enter. Otherwise, click Register
and follow the instructions to create a username and password. Register your access serial number
P2-15. Compare the profitability of Delta Air Lines (ticker: U:DAL) and United Airlines (U:UAL) for the
P2-16. Analyze the financial condition of Carter’s, Inc., (ticker: CRI) over the last five years. Use financial
ratios that relate to its liquidity, activity, debt, profitability, and market value. In which areas has
the company improved, and in which areas has the company’s financial position worsened?
Answer to MiniCase
Financial Statement and Cash Flow Analysis
You have been hired by First Citizens Bank as a financial analyst. One of your first job a s-
signments is to analyze the present financial condition of Bradley Stores, Incorporated. You
are provided with the following 2012 balance sheet and income statement information for
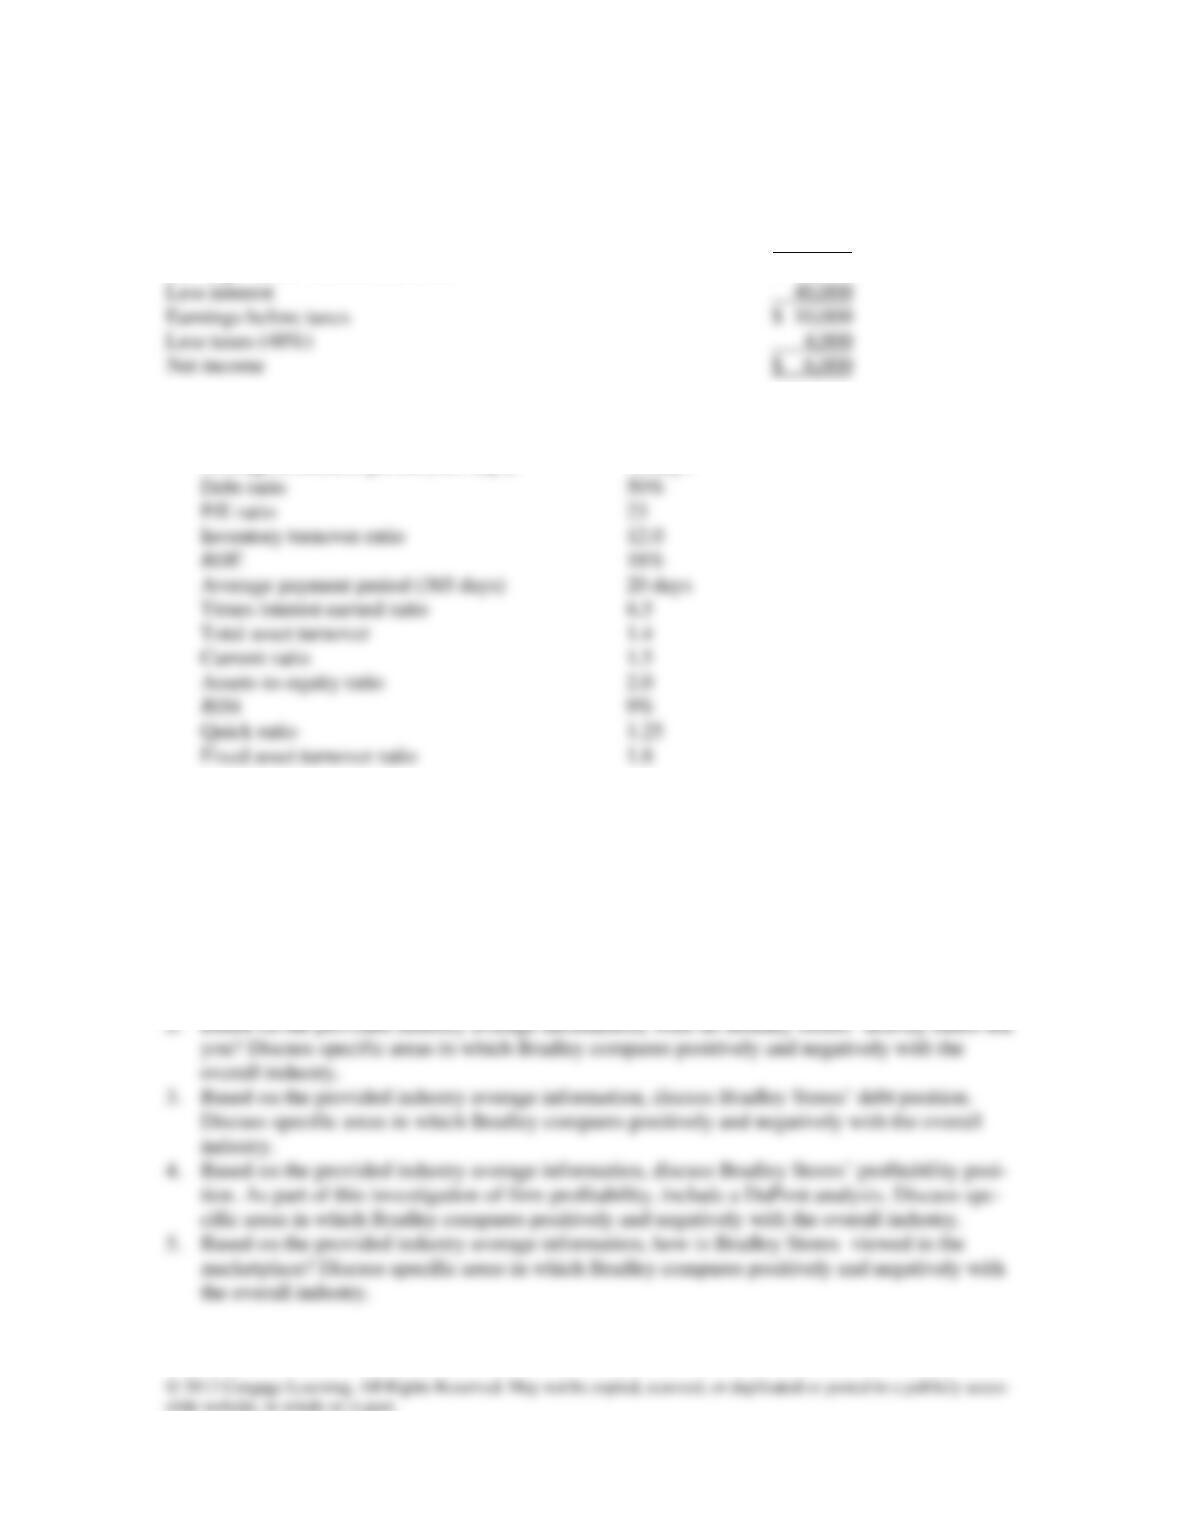
Balance Sheet (in 000s)
______________________________________________________________
Cash $ 5,000 Accounts payable $ 15,000
Accounts receivable 20,000 Notes payable 20,000
Chapter 2 Financial Statement and Cash Flow Analysis 65
Income Statement (in 000s)
____________________________________________________________
Net sales (all credit) $300,000
Less cost of goods sold 250,000
Earnings before interest and taxes $ 50,000
Industry Averages for Key Ratios:
Net profit margin 6.4%
Average collection period (365 days) 30 days
Assignment
Use the following guidelines to complete this job assignment. First, identify which ratios you need
to use to evaluate Bradley Stores in terms of its (a) liquidity position, (b) business activity, (c) debt
position, (d) profitability, and (e) market comparability. Next, calculate these ratios. Finally, com-
pare these ratios to the industry average ratios provided in the problem and answer the following
questions.
1. Based on the provided industry average information, discuss Bradley Stores’ liquidity position.
Discuss specific areas in which Bradley compares positively and negatively with the overall
industry.
66 Instructor’s Manual
6. Overall, what are Bradley’s strong and weak points? Knowing that your boss will approve new
loans only to companies in a better-than-average financial position, what is your final recom-
mendation (approval or denial of loan)?
Answers
Ratios to calculate:
Industry Averages Bradley
Net profit margin 6.4% 2.0%
Average collection period (365 days) 30 days 24.33 days
1. Relative to the industry Bradley Stores has a strong current ratio indicating a better-than-
average ability to meet cash obligations over the next year. However, Bradley Stores quick ra-
2. The inventory turnover ratio confirms that Bradley Stores is carrying much greater levels of
inventory than the industry average. Collections are good compared to the industry. However,
3. Bradley Stores has greater debt levels than the industry on average, indicating greater financial
risk. Compounding this concern is a low times-interest-earned ratio. Bradley Stores buffer in
4. Profitability is low compared to the industry. These ratios highlight that Bradley Stores needs
to either increase revenues or reduce costs. A DuPont Analysis provides additional insight.
Chapter 2 Financial Statement and Cash Flow Analysis 67
Industry Bradley Stores
NPM TAT A/E = ROE NPM TAT A/E = ROE
6.4% 1.4 2.0 = 18.0% 2.0% 1.5 3.08 = 9.0%
As seen in the DuPont Analysis, Bradley Stores’ ROE is much lower due to a low net profit
5. The PE ratio shows that investors value Bradley Stores at a lower multiple than they do other
6. The concerns with Bradley Stores include high inventory levels, slow payments to vendors,