27
Chapter 2 Financial Statement and Cash Flow Analysis
Chapter Overview
Financial statements document a firm’s performance during a fiscal year period for a firm. But
how can firm know if a recovering economy is affecting the bottom line of the firm – its revenues?
The opening segment of this chapter discusses one of the most widely used ratios – the DSO or
Opening Focus Discussion Questions:
1. Have the recent reduction in Days Sales Outstanding told us anything about the changes in
credit policies of companies? Could the change in credit policies change the DSO?
2. What other ratios might be a good indicator of an improving or declining economy?
This chapter reviews:
1-1. Financial Statements
1-4. Corporate Taxes
Technology
1. Smart Practices Video. This video interviews Jon Olson, vice president of finance for Intel
2. Smart Ethics Video. This video quotes Frank Popoff, retired chairman of the board of Dow
Chemical, that “Overstating or understating the performance of the enterprise is anathema…it’s
3. Smart Ideas Video. This video interviews John Graham of Duke University about whether
companies manage their earnings.
28 Instructor’s Manual
4. Smart Concepts. This video illustrates a DuPont analysis of Microsoft, Wal-mart and Kroger.
5. Smart Solutions. Step-by-step solution to Problems 2-2 and 2-12, calculating cash flow from
operations, operating cash flow, and free cash flow.
Lecture Guide
Accounting is the language of business. This means there are a lot of terms in this chapter,
and the more familiar students are with the language, the easier this chapter will be. Accounting
looks at historical numbers and paints a picture of a company’s financial situation at a given point
in time. Finance is more dynamic and forward-looking, trying to determine what impact decisions
Another area of interest is the rapid acceptance of International Financial and Reporting
Standards (IFRS, formerly called International Accounting Standards). IFRS have been adopted
by most of the world outside the U.S. and there is a good chance that the U.S. will abandon GAAP
2-1 Financial Statements
Regular financial statements:
• Make it easier to predict the future and make decisions
Many interested parties, including shareholders, the government, and creditors, want to
know if the firm is doing better or worse than it has in the past, how fast the business is growing
and whether the firm will survive.
While accounting is primarily concerned with historical statements, in finance it may be
useful to create pro forma statements, predictions about how the firm’s statements will look in the
future. These are used in valuation – to project the numbers used in multiples and cash flow valua-
Chapter 2 Financial Statement and Cash Flow Analysis 29
Four Key Financial Statements
The three basic financial statements, the balance sheet, income statement and statement of
2-1a Balance Sheet
Note that a firm’s assets are everything the firm owns. Current assets are those that are easy to
sell and turn into cash, while fixed assets are physical assets like buildings and equipments. A
company may also have intangible assets that may not appear on the balance sheet, like patents,
copyrights or franchises. Assets include everything that can be used to benefit the business or give
2-1b Income Statement
The income statement, or profit and loss statement shows what money a company has taken
and spent during a specified time period. It is getting harder to accurately account for financial
numbers with some new economy companies. For example, Priceline.com acts as a broker for cus-
tomers wanting airline tickets and hotel rooms. Yet it claims as revenue the full price of the ticket
or room. Priceline’s justification for this is that it does own the tickets, even if only for a nanosec-
ond. This practice means the company could be seen as overstating its revenues. On the other
30 Instructor’s Manual
A company’s expenses are decreases in assets or increases in liabilities resulting from revenue
–producing activities. They include costs of goods sold, how much inventory was used during the
2-1c Statement of Retained Earnings
This statement is primarily used to see how the firm has made its investment/consumption decision.
Is the firm reinvesting its earnings? If so, how much? Is the firm paying out its earnings as divi-
dends? These decisions are recorded in the statement of retained earnings.
2-1d Statement of Cash Flows
Note that a statement of cash flows is an easy to see the cash flow – the lifeblood of a business –
2-2 Cash Flows Analysis
Cash is the lifeblood of a company, and the company’s statement of cash flows records
what money has gone into and out of a firm because of its operations, investments and financing
activities. A past statement of cash flows shows where the firm’s money came from and how it
was used. Where these good sources and uses? In other words, did sources include substantial net
profits, or did the firm need to borrow heavily because its profits were low? Are there any sources
or uses that stand out? For example, did the firm greatly increase its cash? If so why? Does it not
have any more productive use for its profits other than adding to its cash account? Did inventories
increase? Why? Was there a production bottleneck that caused a buildup of inventories, or is this
a reasonable increase given the firm’s sales increases?
In general, finance is more concerned with cash flows than with accounting earnings. While
Chapter 2 Financial Statement and Cash Flow Analysis 31
Point out the differences between cash flow from operations and free cash flow. Cash flow
from operations refers to revenues minus operating costs, depreciation and taxes, with depreciation
added back in. Free cash flow takes cash flow from operations and subtracts (adds) incremental
working capital or capital expenditure needs.
A statement of cash flows can be historical or forward looking. In other words, it can show
how the company has spent money and where it has received money in the past, or it can be used to
predict what funds will be needed in the future. A past sources and uses of funds statement will
2-3 Types of Financial Ratios
The instructor should note the main types of ratio and which groups are interested in which
ratios. For example, creditors are primarily interested in liquidity ratios to assess a company’s cur-
2-3a Financial Ratios
Financial ratio analysis is the use of ratios to analyze financial statements. They can be used
2-3b Liquidity Ratios
Point out to students that it is difficult to tell if a ratio is bad or good without additional infor-
mation. For example, a lender would prefer high current and quick ratios, but when are these ratios
“too high”?
2-3c Activity Ratios
In general, a higher inventory turnover is an indication of greater efficiency, which is good for
a company. When can a high inventory turnover ratio be negative for a company? (Answer: when
32 Instructor’s Manual
2-3d Debt Ratios
When discussing debt ratios, relate debt to risk. More debt makes a company riskier. Why?
What difference does variability in cash flows make? (Answer: if a company has very stable cash
2-3e Profitability Ratios
The term “profits” is very vague. “Profits” may mean:
• Gross profits, sales minus cost of goods sold
• Operating profits, sales minus cost of goods sold minus operating expenses
• Pre-tax profit, operating profit plus non-operating income and minus non-operating expenses
giving him royalties from the hit movie starring Robert Redford and Demi Moore. In spite of the
fact that the movie’s world-wide gross was $250 million, the studio is showing losses on the movie
and refusing to pay the author more than the $120,000 he received upfront. Robert Redford report-
edly earned $20 million for his role in the movie.
Note the relationship between return on assets and return on equity. ROA decreases if a com-
50,000/10,000 or 500%. Using leverage has greatly increased your profits. This is a very simpli-
fied example, ignoring transactions costs and taxes.
To improve ROA a firm needs to improve its cost control, for example, reducing labor costs,
purchases and overhead. Or, the company needs to increase its revenue, say through higher pric-
ing, changing its product mix or volumes. The firm might also be able to improve its capacity uti-
Chapter 2 Financial Statement and Cash Flow Analysis 33
2-3f Market Ratios
When discussing market ratios, note that price/earnings ratio is one of the most talked about
ratios. It would be difficult to pick up a Wall Street Journal without seeing price-earnings ratio
mentioned. Ask students what they think high or low P/E ratios would mean. Is a high (or low)
P/E ratio good or bad? Note that in general low P/E ratio firms are considered to be lower growth
2-4 Corporate Taxes
Point out that average tax rate may not be representative of a firm’s overall tax rate; it could
reflect temporary tax credits and may not be representative of the future. Marginal tax rate is gen-
erally more important to the financial analyst. One of the major decision made by managers is the
capital budgeting decision – what projects should be accepted. Any profits resulting from these
Financial Statements and Financial Ratios Summary
Point out that market values and not accounting numbers are what count, even though the two
can be related. As recent headlines have shown, accounting numbers can be manipulated. Ac-
counting numbers, however, can provide information used in making wealth-increasing decisions.
Accounting numbers serve as a proxy for cash flow, for example, net income. An accounting num-
ber is an important part of the cash flow equation.
answer to your questions about a firm’s financial health. Ratio analysis tells you what questions to
34 Instructor’s Manual
Chapter 2 Resource Articles:
“Cash Flow Hocus Pocus”, Business Week, July 15, 2002. Finance says that the focus should be on
a firm’s cash flows, not necessarily its accounting statements. This article points out ways that a
firm can manipulate its cash flows, for example, through selling accounts receivable, classifying
outstanding checks as accounts payable, trading securities and capitalizing certain expenses.
Enrichment Exercises
1. Chapter 2 raises questions about accounting standards – GAAP standards vs. IAS standards.
Ask students to find an article in their local newspapers, on the internet or on the Wall Street
Journal or its web site, and ask them to:
article, and reaching a group consensus.
2. Have students, either individually or in a group choose a company for which to perform a fi-
nancial statement analysis. It’s best to choose a company that is primarily operating in one in-
dustry. Bank and financial service company accounting also can be very different and
Chapter 2 Financial Statement and Cash Flow Analysis 35
• Include a page with calculations of ratios for your company for one year. You should go
through Ch. 2 of the textbook, list the ratios from the textbook on your spreadsheet, enter
time? How does your company compare to the industry average?
3. Have students each download financial statements from different companies. In a round table
4. Have students perform a two-minute ratio analysis. The article “Financial Statement Analysis
– A Two-Minute Drill” by William L. Stone, Journal of Commercial Bank Lending, November
Answers to Concept Review Questions
1. The FASB is a nongovernmental, professional-standards body that examines controversial ac-
counting topics and then issues “rulings” that have almost the force of law, at least in terms of
their impact on accounting practices. In the U.S., the FASB has developed the GAAP (Gener-
2. Companies prepare both balance sheets and income statements for the purpose of providing
financial information about a company at a point in time, but they are used for slightly different
3. Creditors would most likely be interested in the balance sheet, which states how much the
company holds in liabilities, but they also would want to see an income statement, which indi-
36 Instructor’s Manual
4. Depreciation and other non-cash charges are sources of cash to the firm. These charges are sub-
tracted from the firm’s revenues, decreasing cash flow in order to get a correct estimate of tax-
es owed. They need to be added back to compute an accurate cash flow. These charges are not
5. Operating cash flow (OCF) is earnings before interest and taxes (EBIT) less actual taxes plus
depreciation. OCF is related to NOPAT because OCF can also be calculated as NOPAT plus
6. Financial managers must concern themselves very much with the statement of cash flows, be-
ue.
7. a. Existing and prospective lenders would be most interested in liquidity ratios (how much in
liquid assets the firm has to pay its bills) and debt ratios (how much of a commitment the
8. Cash inflow and outflow data can be used to improve the accuracy of liquidity and debt cover-
age ratios over the previously presented methods because we would be using direct data rather
9. a. Cash outflow
b. Cash inflow—decrease in inventory
Chapter 2 Financial Statement and Cash Flow Analysis 37
10. The DuPont system evaluates the impact of the different ratios on the company’s ROE, we
need to decompose the ROE by means of the DuPont system. ROE = Profit margin * Asset
11. Investors may not get excited about a stock with an above-average M/B ratio and a below-
average P/E ratio, especially if the firm is an older one. Since the M/B ratio compares market
and book values, it is possible that the ratio is high not so much due to high market price as due
12. Ordinary corporate income is income resulting from the sale of the firm’s goods and services.
Under current tax laws, the applicable tax rates are subject to progressive tax rate schedule
13. Capital gains occur when companies sell capital assets, such as equipment or stock held as an
investment, for more than the asset’s original purchase price. The amount of the capital gain
would be equal to the difference between the sale price and initial purchase price. If the sale
price is less than the initial purchase price, the difference is called capital loss. Under current
Answers to Self-Test Problems
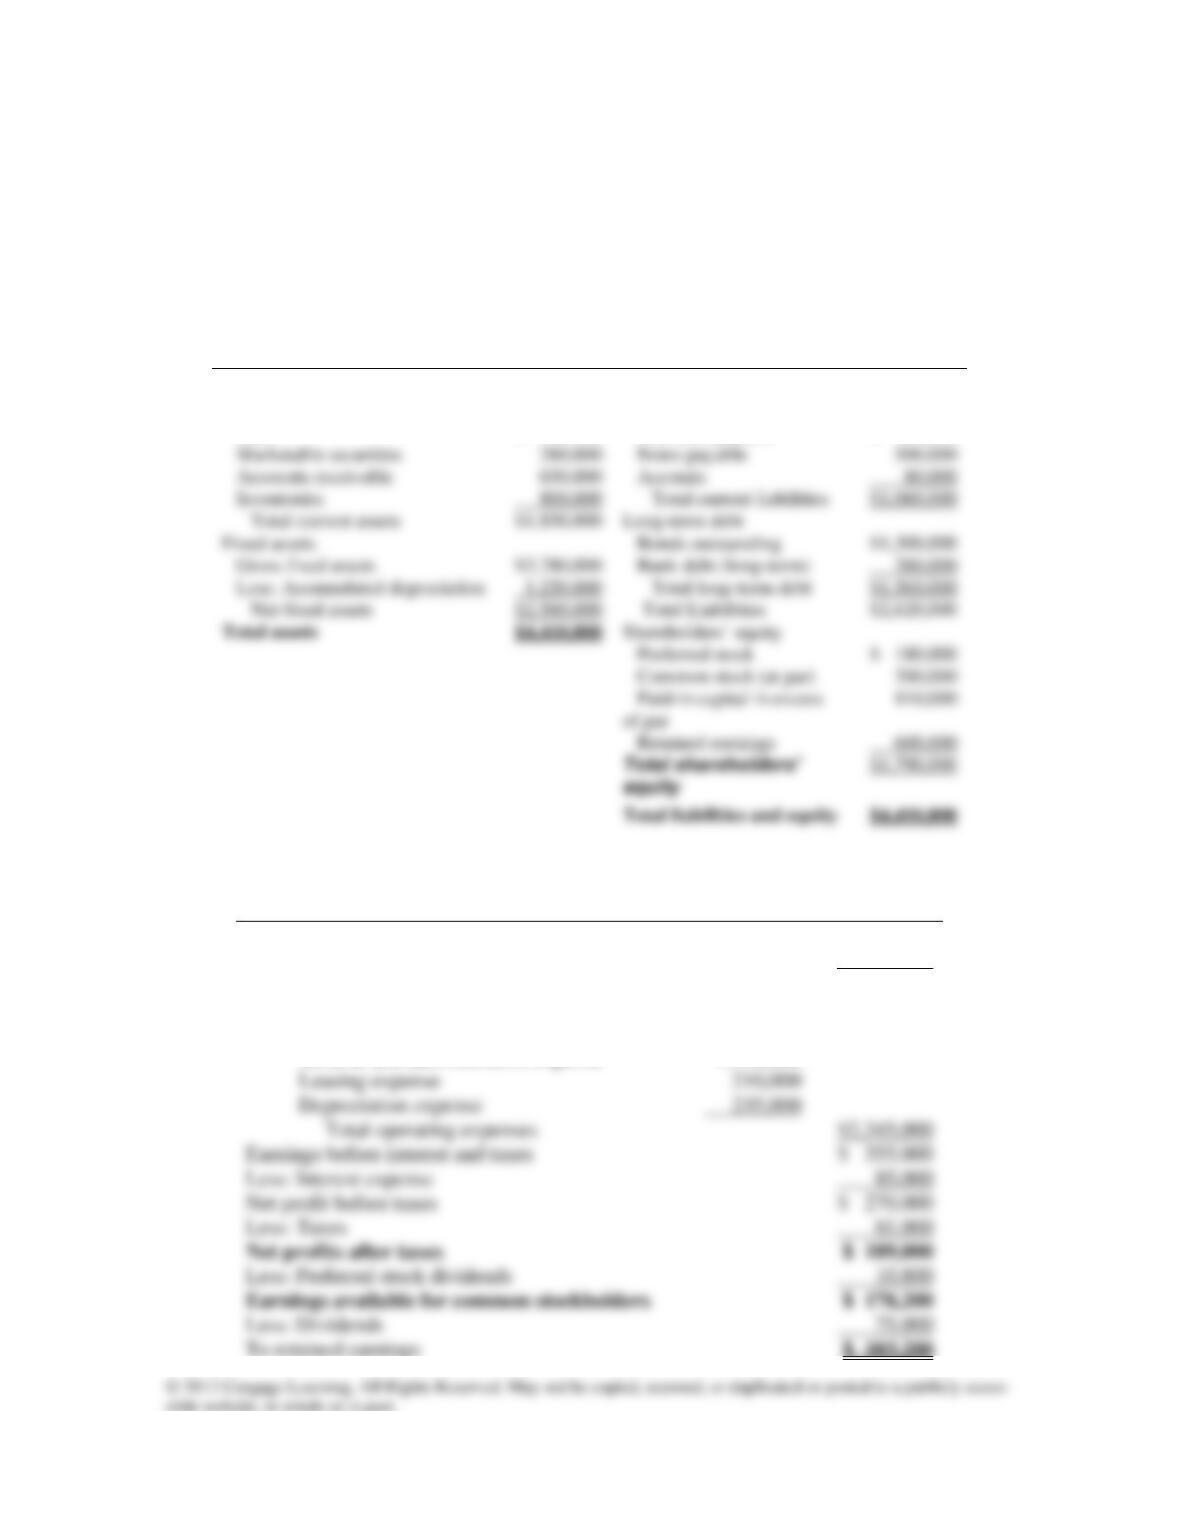
ST2-1. Use the financial statements below to answer the questions concerning M&M Manufactur-
ing’s financial position at the end of the calendar year 2012.
a. How much cash and near cash does M&M have at year-end 2012?
b. What was the original cost of all of the firm’s real property that is currently owned?
c. How much in total liabilities did the firms have at year-end 2012?
d. How much did M&M owe for credit purchases at year-end 2012?
e. How much did the firm sell during 2012?
f. How much equity did the common stockholders have in the firm at year-end 2012?
38 Instructor’s Manual
g. What is the cumulative total of earnings reinvested in the firm from its inception
through the end of 2012?
h. How much operating profit did the firm earn during 2012?
i. What is the total amount of dividends paid out by the firm during the year 2012?
j. How many shares of common stock did M&M have outstanding at year-end 2012?
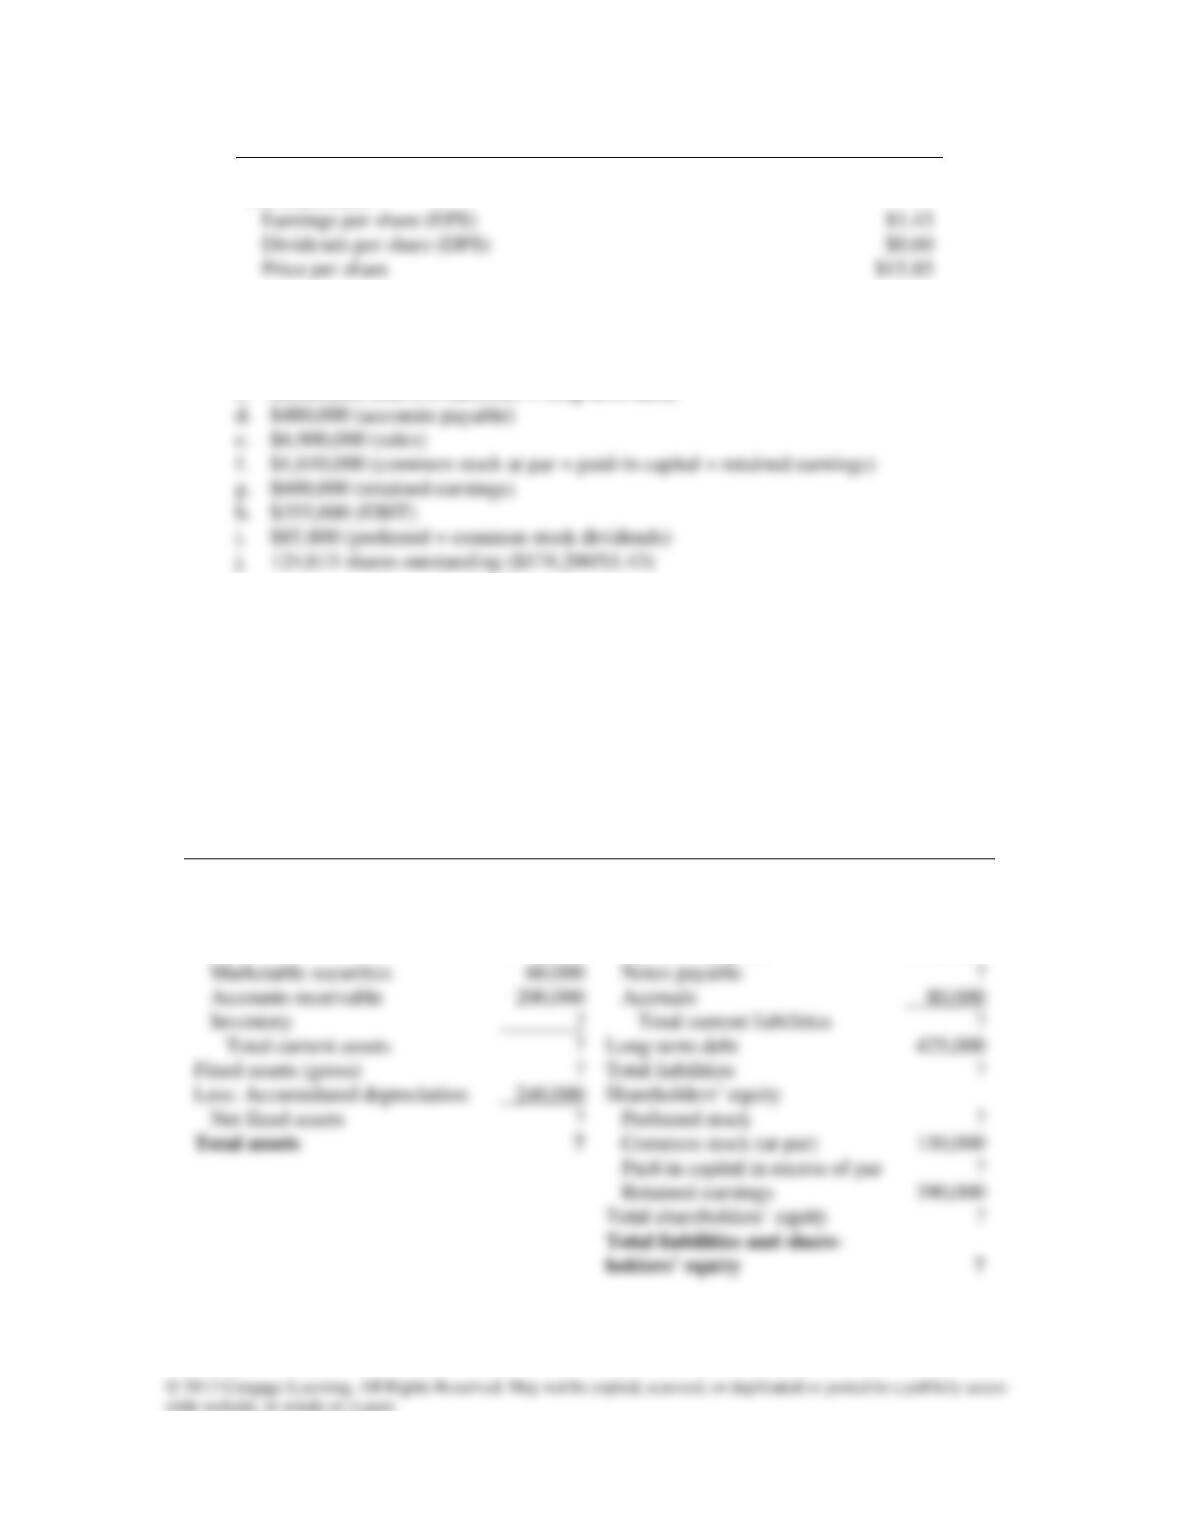
M&M Manufacturing, Inc.
Balance Sheet
At December 31, 2012 ($000)
Assets
Liabilities and Equity
Current assets
Current liabilities
Cash
$ 140,000
Accounts payable
$ 480,000
Marketable securities
Notes payable
Accounts receivable
Accruals
Inventories
Total current liabilities
Total current assets
$1,850,000
Long-term debt
Fixed assets
$1,300,000
Gross fixed assets
$3,780,000
Bank debt (long-term)
Less: Accumulated depreciation
Total long-term debt
$1,560,000
Net fixed assets
$2,560,000
Total Liabilities
$2,620,000
Preferred stock
$ 180,000
Common stock (at par)
Retained earnings
M&M Manufacturing, Inc.
Income Statement for year ended December 31, 2012 ($000)
Sales revenue
$6,900,000
Less: Cost of goods sold
4,200,000
Gross profits
$2,700,000
Less: Operating expenses
Sales expense
$ 750,000
General and administrative expense
1,150,000
Leasing expense
Depreciation expense
Total operating expenses
$2,345,000
Earnings before interest and taxes
$ 355,000
Less: Interest expense
85,000
Net profit before taxes
$ 270,000
Less: Taxes
81,000
Less: Preferred stock dividends
10,800
To retained earnings
Chapter 2 Financial Statement and Cash Flow Analysis 39
Per share data:
Earnings per share (EPS)
Dividends per share (DPS)
Price per share
A: a. $400,000 (only cash and marketable securities should be included $140,000 +
$260,000)
b. $3,780,000 (net asset position + depreciation)
c. $2,620,000 (current liabilities + long-term debt)
ST2-2. The partially complete 2012 balance sheet and income statement for Challenge Industries
are given below, followed by selected ratio values for the firm based on its completed 2012
financial statements. Use the ratios along with the partial statements to complete the finan-
cial statements. Hint: Use the ratios in the order listed to calculate the missing statement
values that need to be installed in the partial statements.
Challenge Industries, Inc.
Balance Sheet
At December 31, 2012
(in $ thousands)
Assets
Liabilities and Equity
Current assets
Current liabilities
Cash
$ 52,000
Accounts payable
$150,000
Marketable securities
Notes payable
Accounts receivable
Accruals
80,000
Inventory
Total current liabilities
Total current assets
Long-term debt
Fixed assets (gross)
Total liabilities
Less: Accumulated depreciation
Net fixed assets
Preferred stock
Common stock (at par)
Paid-in capital in excess of par
Retained earnings
40 Instructor’s Manual
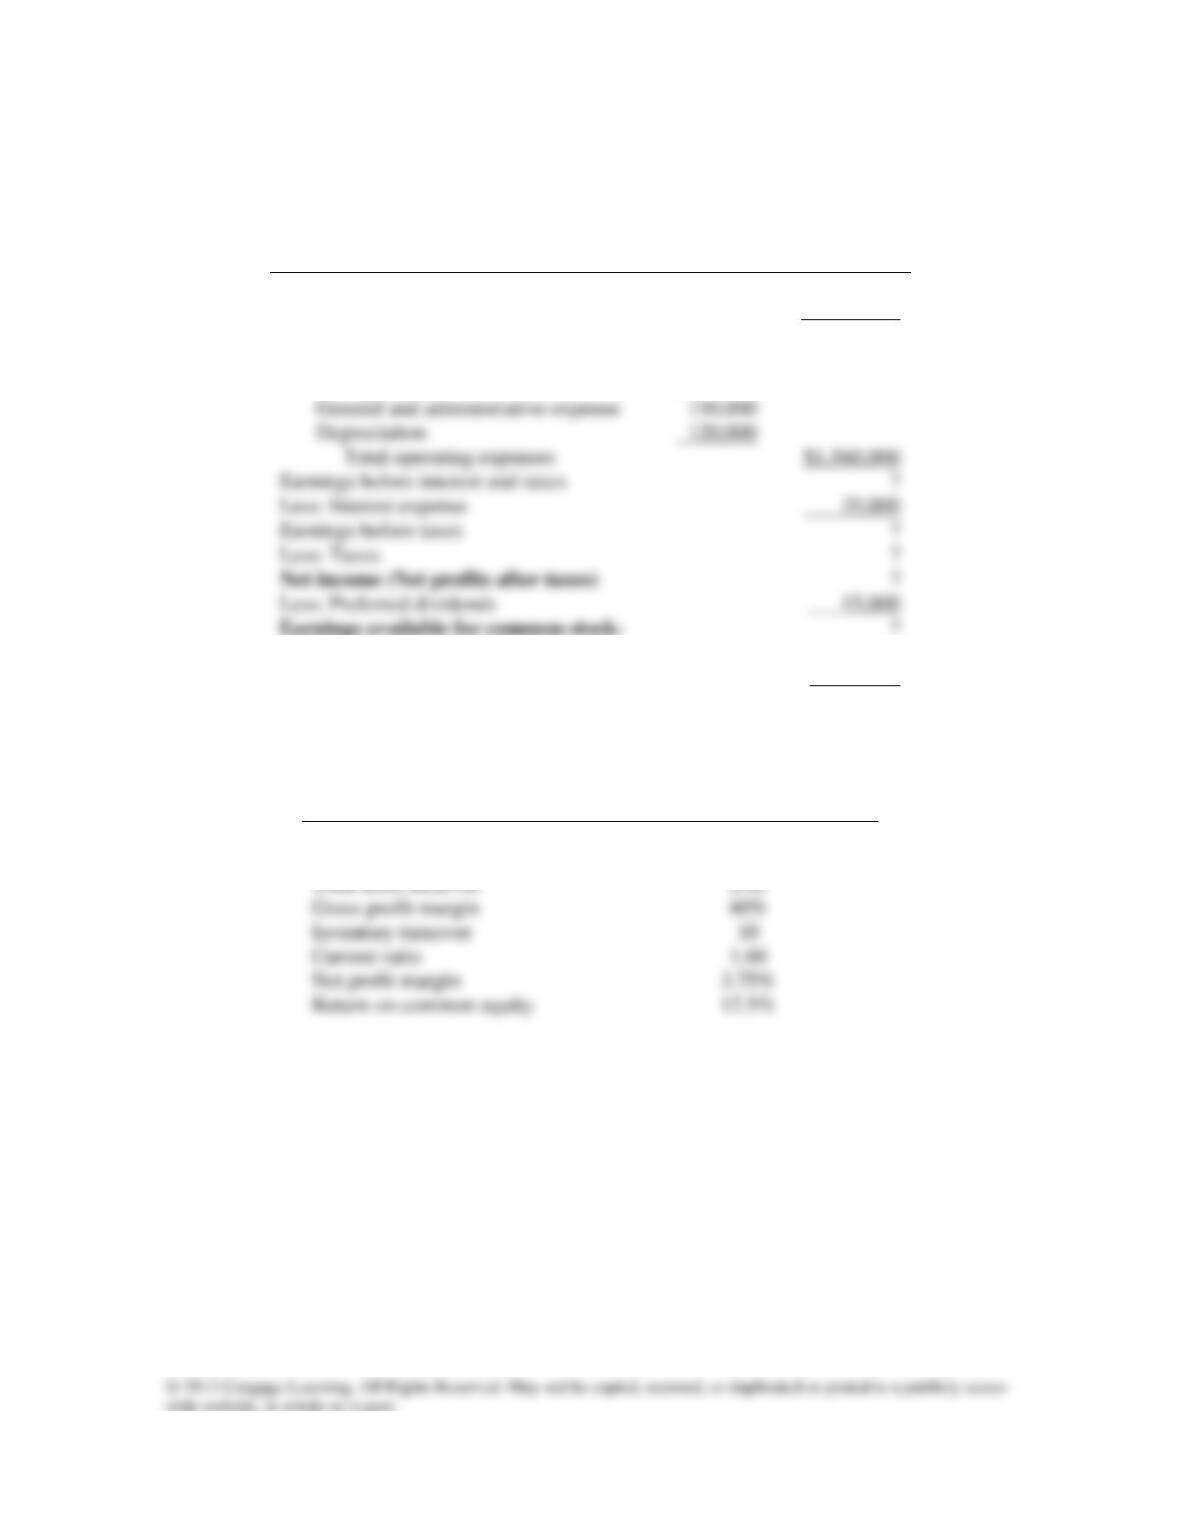
Challenge Industries, Inc.
Income Statement
For the Year Ended December 31, 2012
(in $ thousands)
Sales revenue
$ 4,800,000
Less: Cost of goods sold
?
Gross profits
?
Less operating expenses:
Selling expense
$690,000
General and administrative expense
Depreciation
120,000
Total operating expenses
Earnings before interest and taxes
?
Less: Interest expense
35,000
Earnings before taxes
?
Less: Taxes
?
Less: Preferred dividends
holders
Less: Dividends
60,000
To retained earnings
?
Challenge Industries, Inc.
Ratios for the Year Ended December 31, 2012
Ratio
Value
Total asset turnover
Gross profit margin
Inventory turnover
Net profit margin
Return on common equity
Chapter 2 Financial Statement and Cash Flow Analysis 41
A:
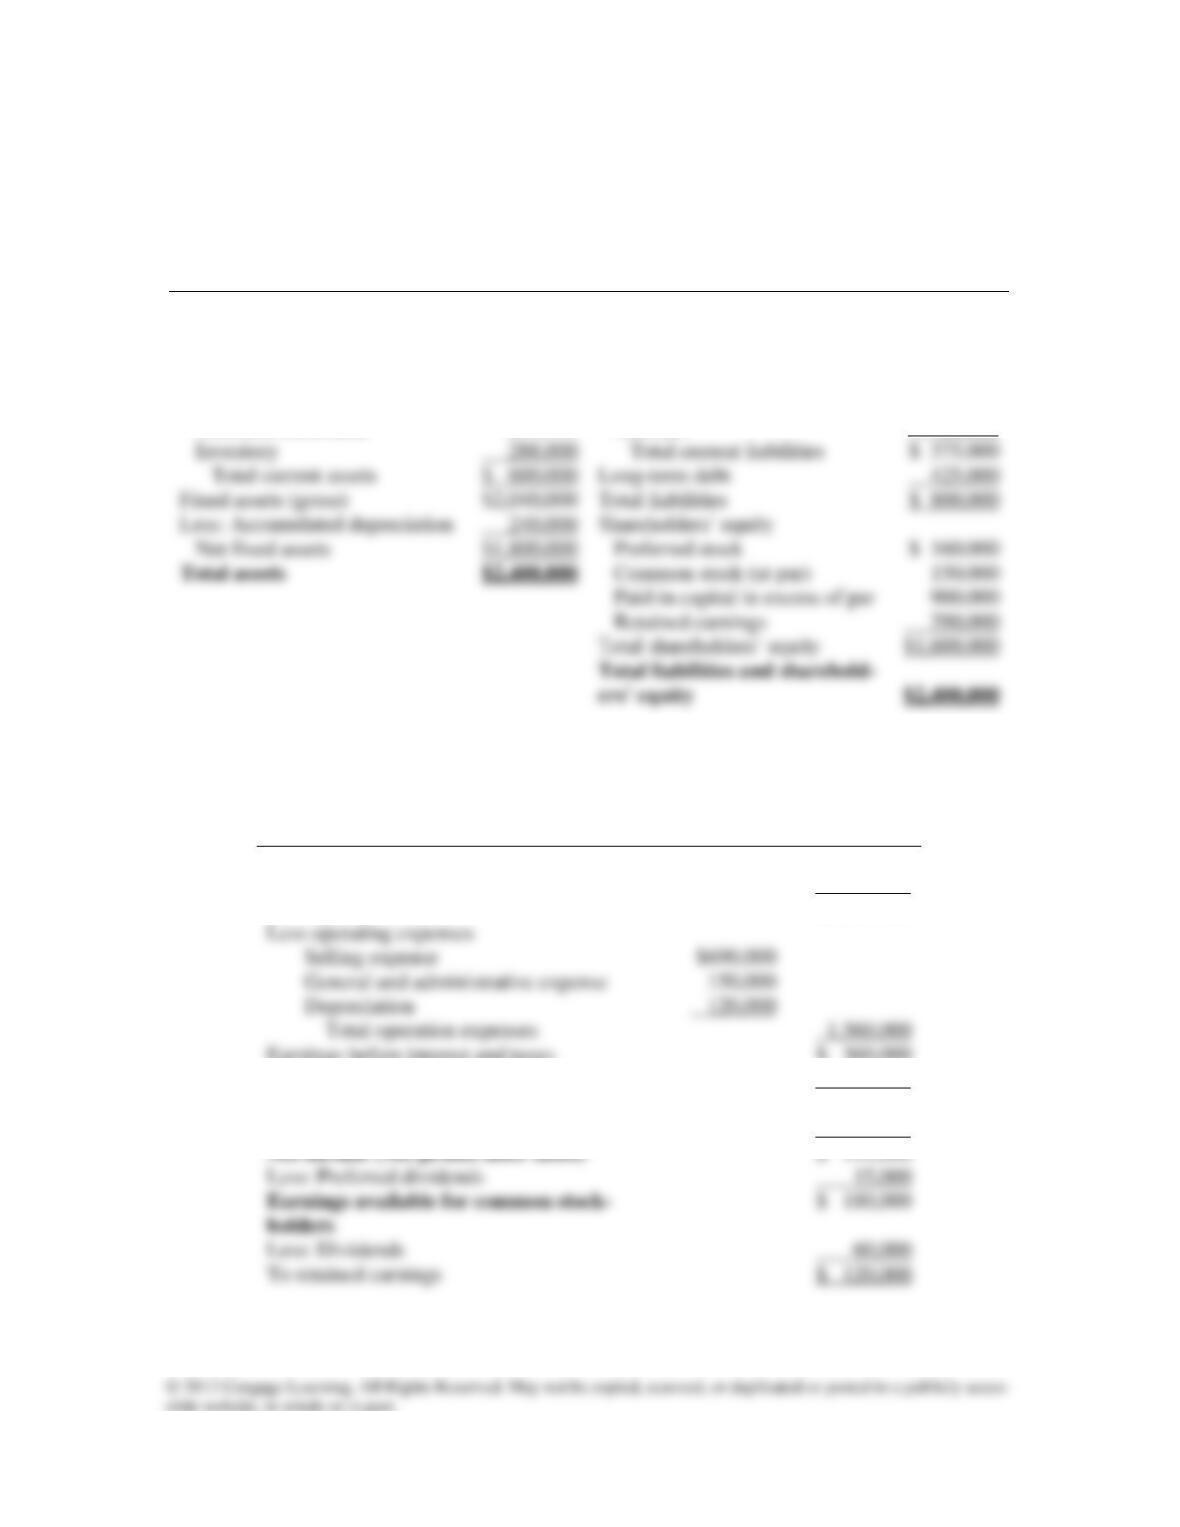
Challenge Industries, Inc.
Balance Sheet
At December 31, 2012
(in $ thousands)
Assets
Liabilities and Equity
Current assets
Current liabilities
Cash
$ 52,000
Accounts payable
$ 150,000
Marketable securities
60,000
Notes payable
145,000
Accounts receivable
200,000
Accruals
80,000
Inventory
288,000
Total current liabilities
Total current assets
$ 600,000
Long-term debt
425,000
Fixed assets (gross)
$2,040,000
Total liabilities
Less: Accumulated depreciation
240,000
Net fixed assets
$1,800,000
Preferred stock
Common stock (at par)
150,000
Paid-in capital in excess of par
900,000
Retained earnings
390,000
$1,600,000
Challenge Industries, Inc.
Income Statement
For the year ended December 31, 2012
(in $ thousands)
Sales revenue
$4,800,000
Less: Cost of goods sold
2,880,000
Gross profits
$1,920,000
Less operating expenses
Selling expense
General and administrative expense
Depreciation
120,000
Total operation expenses
1,560,000
Earnings before interest and taxes
$ 360,000
Less: Interest expense
35,000
Earnings before taxes
$ 325,000
Less: Taxes
130,000
$ 195,000
Less: Preferred dividends
15,000
Less: Dividends
60,000
To retained earnings
$ 120,000
ST2-3. Use the corporate income tax rate schedule in Table 2.6 of the chapter to calculate the tax
liability for each of the following firms with the amounts of 2012 pretax income noted.
42 Instructor’s Manual
Firm
2012 Pretax Income
Tax Liability
A
$12,500,000
B
200,000
C
80,000
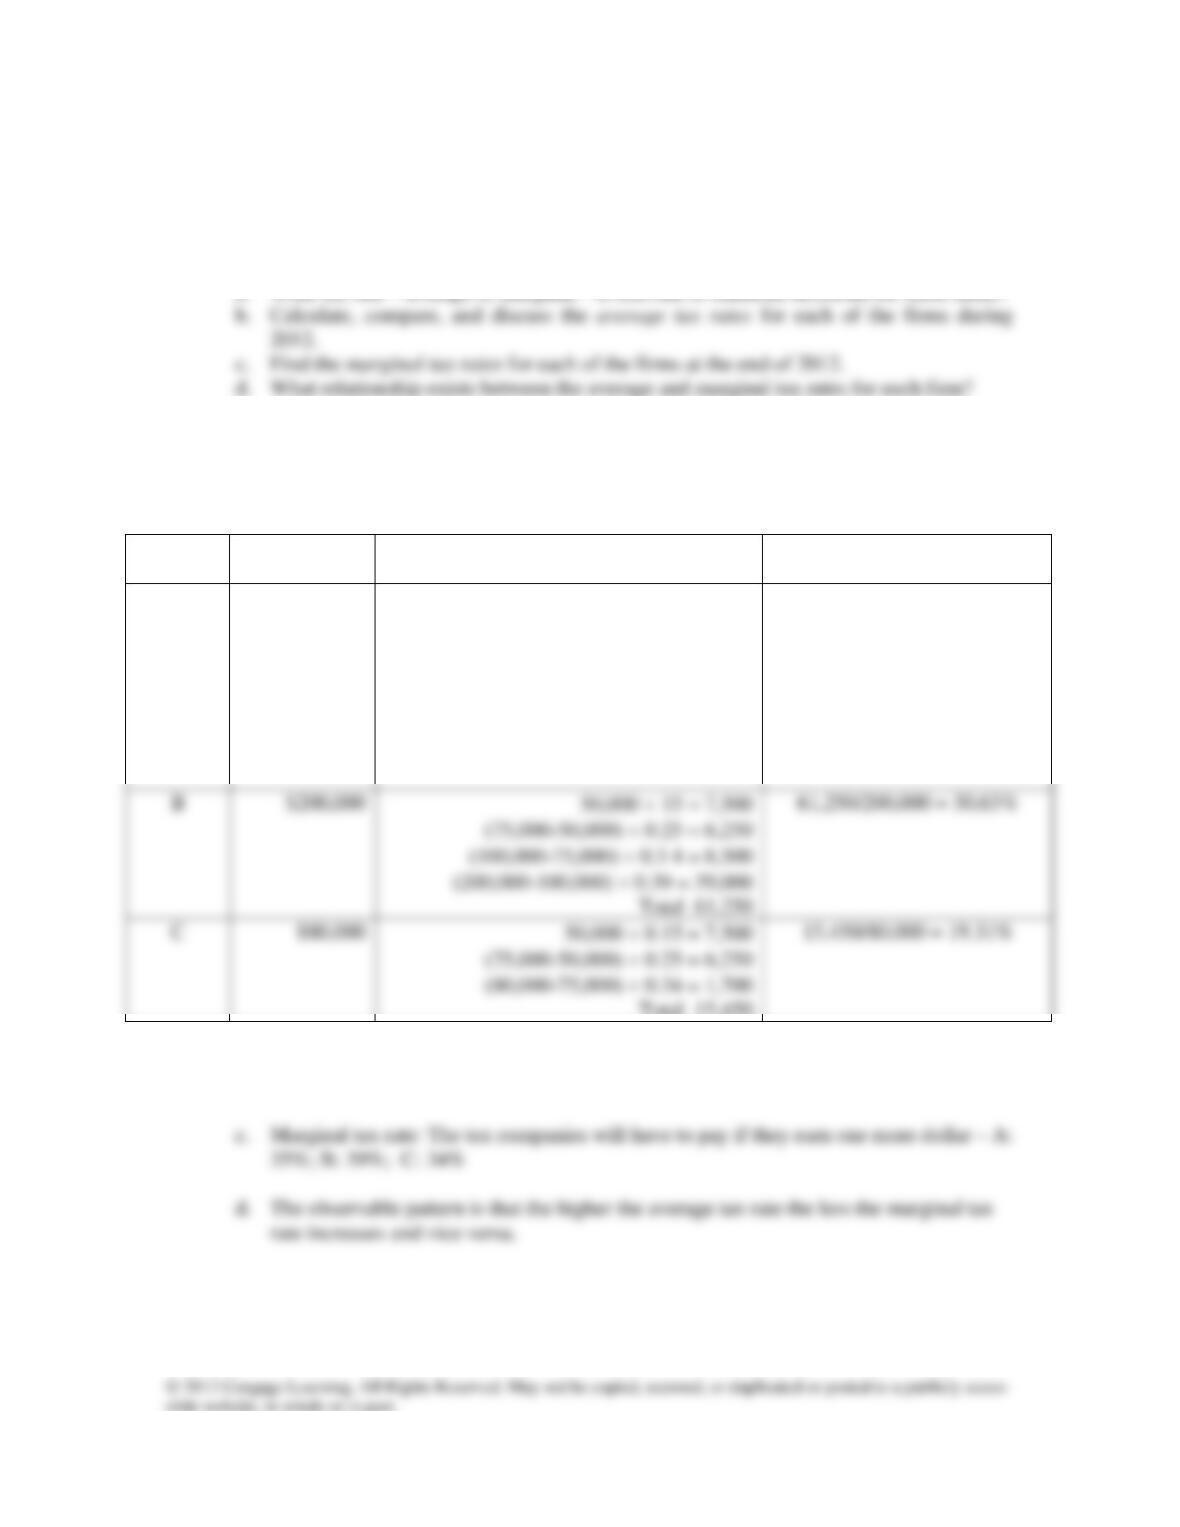
a. What tax rate – average or marginal – is relevant to financial decisions for these firms?
A: a. The marginal tax rate is relevant to financial decisions for these firms, because it reflects
the rate at which the next dollar of the firm’s income will be taxed.
b.
Firm
2012 Pretax
Income
Tax Liability
Average Tax Rate
A
$12,500,000
50,000 0.15 = 7,500
(75,000-50,000) 0.25 = 6,250
(100,000-75,000) 0.34 = 8,500
(335,000-100,000) 0.39 = 91,650
(10,000,000-335,000) 0.34 = 3,286,100
(12,500,000-10,000,000) 0.35 = 875,000
Total 4,275,000
4,275,000/12,500,000 = 34.2%
Total 15,450
Companies A, B and C pay on average 34.2, 30.63 and 19.31 cents respectively on
each dollar of pretax income earned.
Answers to End-of-Chapter Questions
Chapter 2 Financial Statement and Cash Flow Analysis 43
Q2–1. What information (explicit and implicit) can be derived from financial statement analysis?
A2-1. Financial statement analysis provides information about the company’s financial health,
and its strengths and weaknesses. Using standardized GAAP rules does add validity by
Q2–2. Distinguish between the types of financial information contained in the various financial
statements. Which statements provide information on a company’s performance over a re-
porting period, and which present data on a company’s current position? What sorts of val-
uable information may be found in the notes to financial statements? Describe a situation
A2-2. Data on a company’s performance over a reporting period: income statement, statement of
cash flows, statement of retained earnings (how much additional retained earnings will be
added to existing retained earnings)
Data on a company’s performance about the company’s current position: balance sheet
Q2–3. If you were a commercial credit analyst charged with the responsibility of making an ac-
cept/reject decision on a company’s loan request, with which financial statement would
you be most concerned? Which financial statement is most likely to provide pertinent in-
formation about a company’s ability to repay its debt?
A2-3. An analyst looking at granting a loan request would be most interested in the company’s
balance sheet, which she could use to compute liquidity ratios (current and quick ratios)
44 Instructor’s Manual
Q2–4. What is operating cash flow (OCF)? How is it calculated? What is free cash flow (FCF)?
How is it calculated from operating cash flow (OCF)? Why do financial managers focus at-
tention on the value of FCF?
A2-4. Operating cash flow is earnings before interest and taxes minus taxes plus depreciation.
Financial analysts like this measure because it uses only operating flows, with no financing
Q2–5. Describe the common definitions of “inflows of cash” and “outflows of cash” used by ana-
lysts to classify certain balance sheet changes and income statement values. What three
categories of cash flow are used in the statement of cash flows? To what value should the
net value in the statement of cash flows reconcile?
A2-5. A cash inflow is an increase in liabilities or a decrease in assets. A cash outflow occurs
when there is a decrease in liabilities or an increase in assets. A statement of cash flows is
Q2–6. What precautions must one take when using ratio analysis to make financial decisions?
Which ratios would be most useful for a financial manager’s internal financial analysis?
For an analyst trying to decide on which stocks are most attractive within an industry?
A2-6. With ratio analysis it is important to know the reliability of the data and the methods of
accounting used to provide data for the analysis. A manager interested in internal control
Q2–7. How do analysts use ratios to analyze a firm’s financial leverage? Which ratios convey
A2-7. Analysts use debt ratios to determine the firm’s financial leverage—its use of debt financ-
ing. A credit analyst is going to be concerned with a firm’s ability to repay its obligations.
She will care about times interest earned which demonstrates the firm’s ability to pay its
Chapter 2 Financial Statement and Cash Flow Analysis 45
Q2–8. How is the DuPont system useful in analyzing a firm’s ROA and ROE? What information
can be inferred from the decomposition of ROE into contributing ratios? What is the math-
A2-8. The DuPont system is useful in breaking down ROE and ROA into its component parts. If
ROE is increasing (decreasing), a manager can see if the cause is a higher (lower) profit
Q2–9. Provide a general description of the tax rates applicable to U.S. corporations. What is the
difference between the average tax rate and the marginal tax rate? Which rate is relevant
to financial decision making? Why? How do capital gains differ from ordinary corporate
income?
A2-9. Under current tax laws the applicable tax rates to U.S corporations are progressive. The
average tax rate is calculated by dividing the company’ tax liability by its pretax income.
Solutions to End-of-Chapter Problems
Financial Statements
P2-1. Obtain financial statements for Microsoft for the last five years either from its web site
ecutive stock options. Do you have a different perspective after analyzing these notes?
A2-1. Internet exercise – answers will vary.
Cash Flow Analysis
P2-2. Given the balance sheets and selected data from the income statement of SMG Industries
that follow, answer parts (a)–(c).
a. Calculate the firm’s operating cash flow (OCF) for the year ended December 31, 2012,
using Equation 2.2.
b. Calculate the firm’s free cash flow (FCF) for the year ended December 31, 2012, using
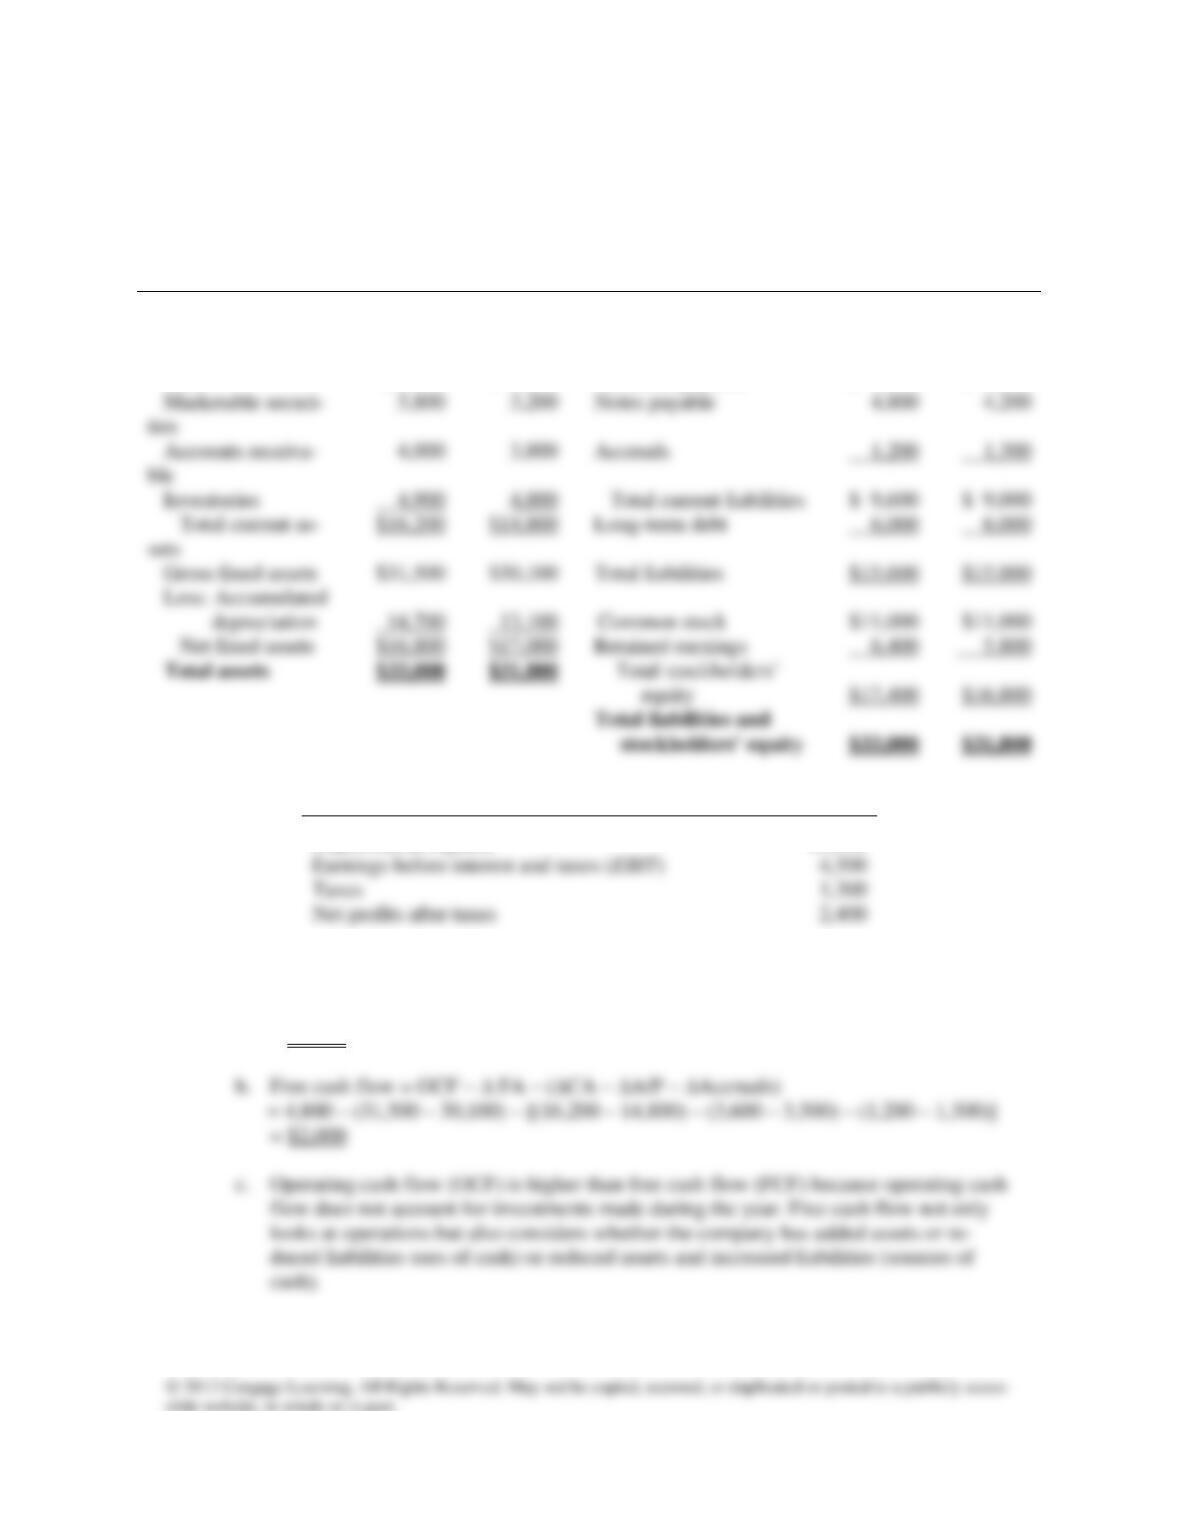
46 Instructor’s Manual
c. Interpret, compare, and contrast your cash flow estimates in parts (a) and (b).
SMG Industries
Balance Sheet
(in $ millions)
Assets
December
31, 2012
December
31, 2011
Liabilities and Stock-
holders’ Equity
December
31, 2012
December
31, 2011
Cash
$ 3,500
$ 3,000
Accounts payable
$ 3,600
$ 3,500
Inventories
4,900
Total current liabilities
$ 9,600
$ 9,000
Gross fixed assets
$31,500
$30,100
Total liabilities
$15,600
$15,000
$11,000
$11,000
$17,400
$16,800
Income Statement Data (2012, in $millions)
Depreciation expense
$1,600
Net profits after taxes
A2-2. a. Operating cash flow = EBIT – Taxes + Depreciation
= $4,500 – $1,300 + $1,600
= $4,800