267
Chapter 19
Valuation and Financial Modeling:
A Case Study
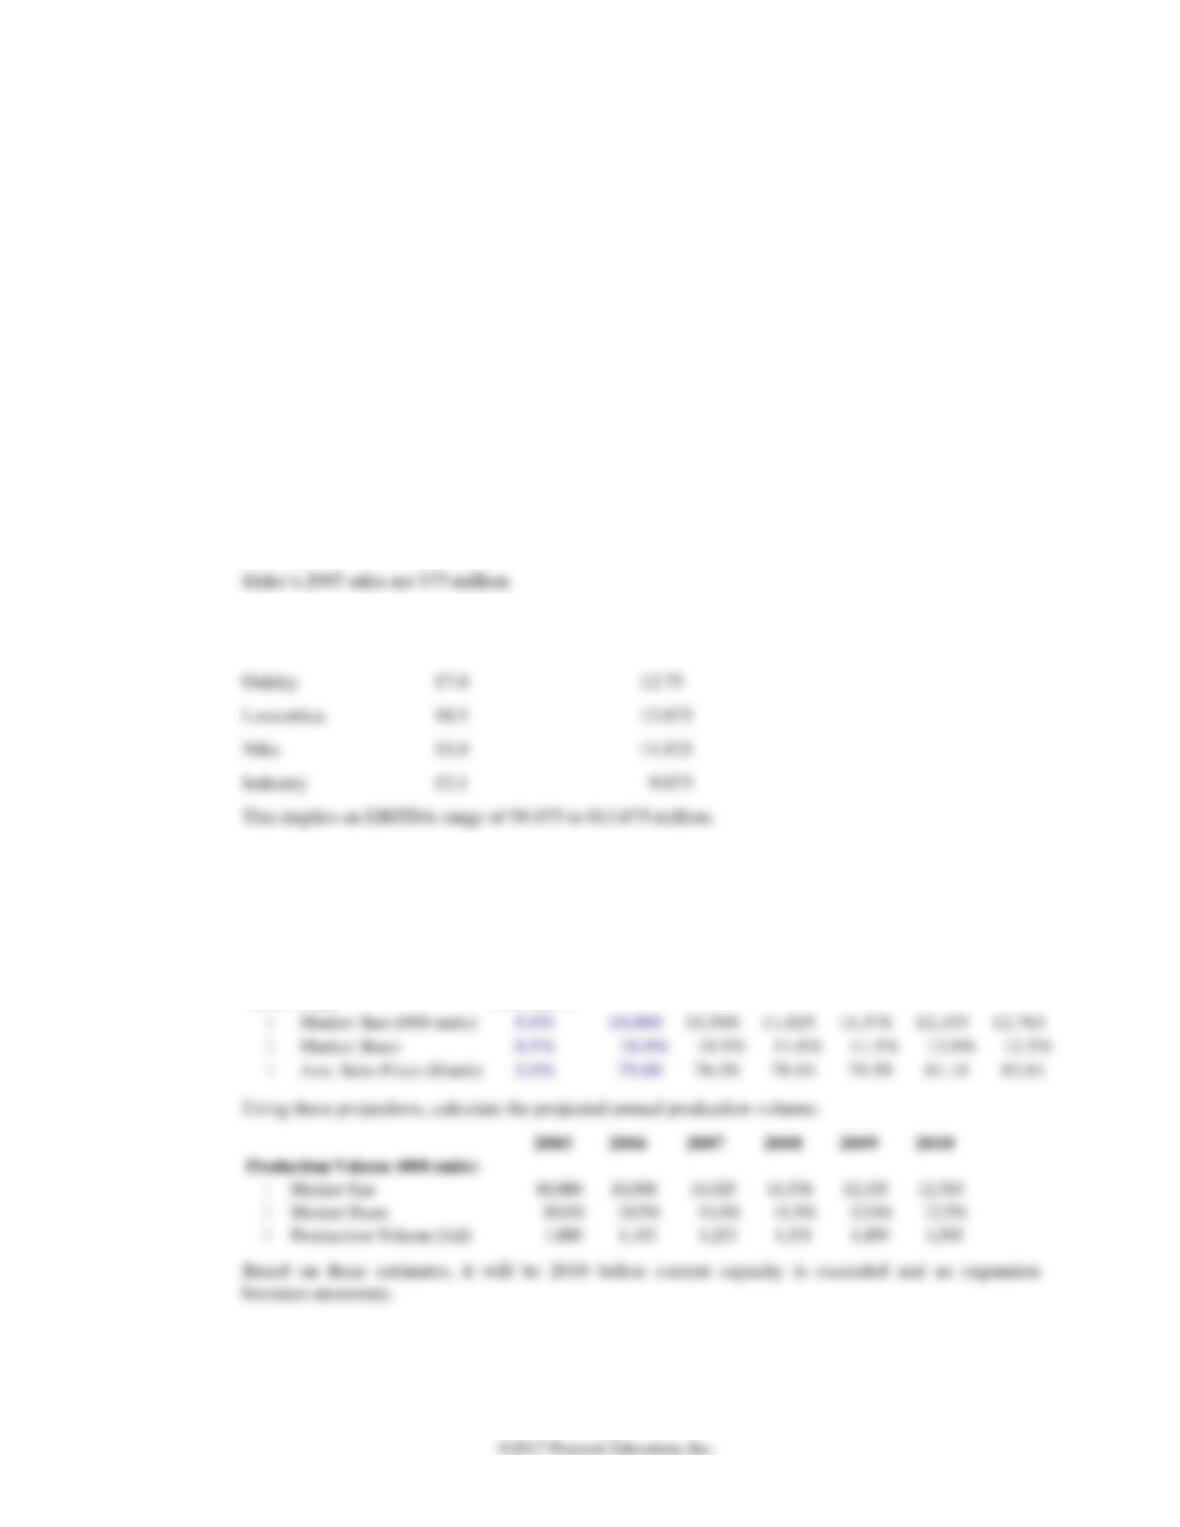
19–1. You would like to compare Ideko’s profitability to its competitors’ profitability using the
EBITDA/sales multiple. Given Ideko’s current sales of $75 million, use the information in Table
19.2 to compute a range of EBITDA for Ideko assuming it is run as profitably as its competitors.
Find the highest and lowest EBITDA values across all three firms and the industry as a whole:
EBITDA/Sales (%) EBITDA ($ mil)
19–2. Assume that Ideko’s market share will increase by 0.5% per year rather than the 1% used in the
chapter. What production capacity will Ideko require each year? When will an expansion
become necessary (when production volume will exceed the current level by 50%)?
First compute the projected annual market share:
2005 2006 2007 2008 2009 2010
Sales Data Growth/Yr
19–3. Under the assumption that Ideko market share will increase by 0.5% per year, you determine
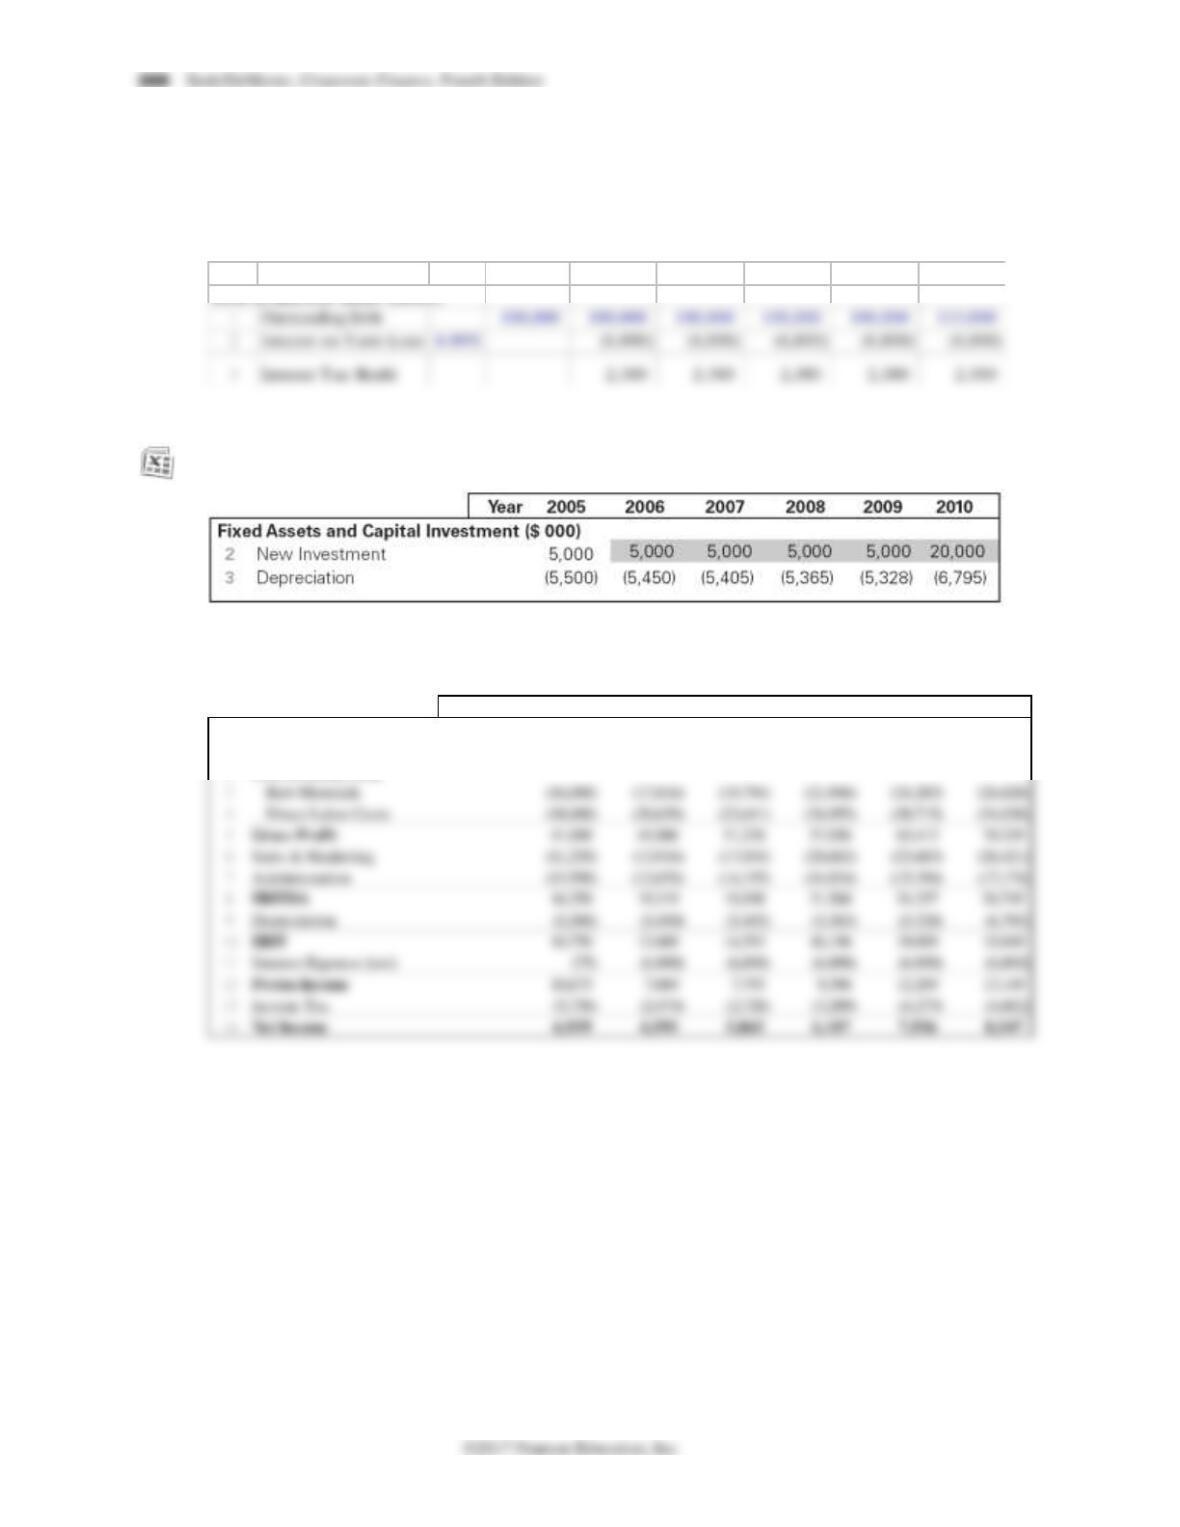
that the plant will require an expansion in 2010. The cost of this expansion will be $15 million.
Assuming the financing of the expansion will be delayed accordingly, calculate the projected
interest payments and the amount of the projected interest tax shields (assuming that the interest
rates on the term loans remain the same as in the chapter) through 2010.
2005 2006 2007 2008 2009 2010
Debt & Interest Table ($000s)
19–4. Under the assumption that Ideko’s market share will increase by 0.5% per year (and the
investment and financing will be adjusted as described in Problem 3), you project the following
depreciation:
Using this information, project net income through 2010 (that is, reproduce Table 19.7 under the
new assumptions).
Year 2005 2006 2007 2008 2009 2010
INCOME STATEMENT ($000s)
1Sales 75,000 84,341 94,631 105,956 118,413 132,105
2Cost of Goods Sold
19–5. Under the assumptions that Ideko’s market share will increase by 0.5% per year (implying that
the investment, financing, and depreciation will be adjusted as described in Problems 3 and 4)
and that the forecasts in Table 19.8 remain the same, calculate Ideko’s working capital
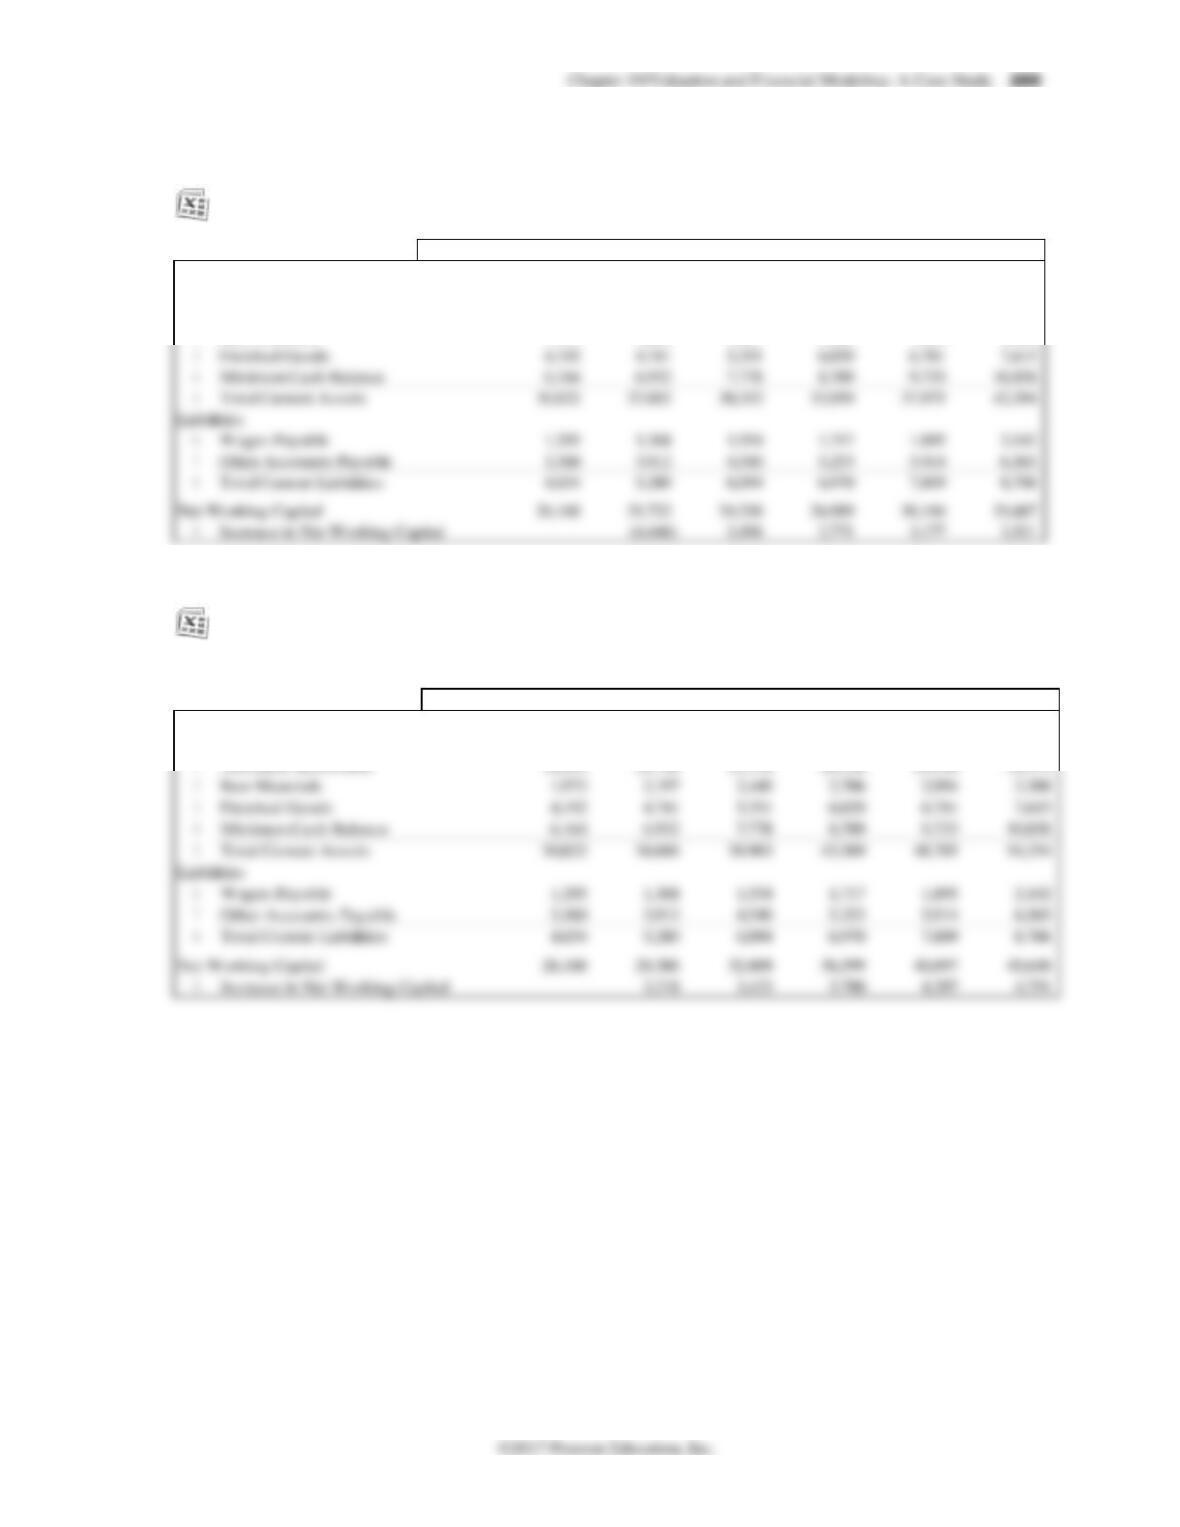
requirements though 2010 (that is, reproduce Table 19.9 under the new assumptions).
Year 2005 2006 2007 2008 2009 2010
Working Capital ($000s)
Assets
1Accounts Receivable 18,493 13,864 15,556 17,418 19,465 21,716
2Raw Materials 1,973 1,464 1,627 1,804 1,996 2,205
19–6. Under the assumptions that Ideko’s market share will increase by 0.5% per year (implying that
the investment, financing, and depreciation will be adjusted as described in Problems 3 and 4)
but that the projected improvements in net working capital do not transpire (so the numbers in
Table 19.8 remain at their 2005 levels through 2010), calculate Ideko’s working capital
requirements though 2010 (that is, reproduce Table 19.9 under these assumptions).
Year 2005 2006 2007 2008 2009 2010
Working Capital ($000s)
Assets
1Accounts Receivable 18,493 20,796 23,334 26,126 29,198 32,574
19–7. Forecast Ideko’s free cash flow (reproduce Table 19.10), assuming Ideko’s market share will
Problem 5).
Year 2005 2006 2007 2008 2009 2010
Free Cash Flow ($000s)
1Net Income 4,595 5,065 6,107 7,936 8,547
19–8. Forecast Ideko’s free cash flow (reproduce Table 19.10), assuming Ideko’s market share will
increase by 0.5% per year; investment, financing, and depreciation will be adjusted accordingly;
and the projected improvements in working capital do not occur (that is, under the assumptions
in Problem 6).
Year 2005 2006 2007 2008 2009 2010
Free Cash Flow ($000s)
1Net Income 4,595 5,065 6,107 7,936 8,547
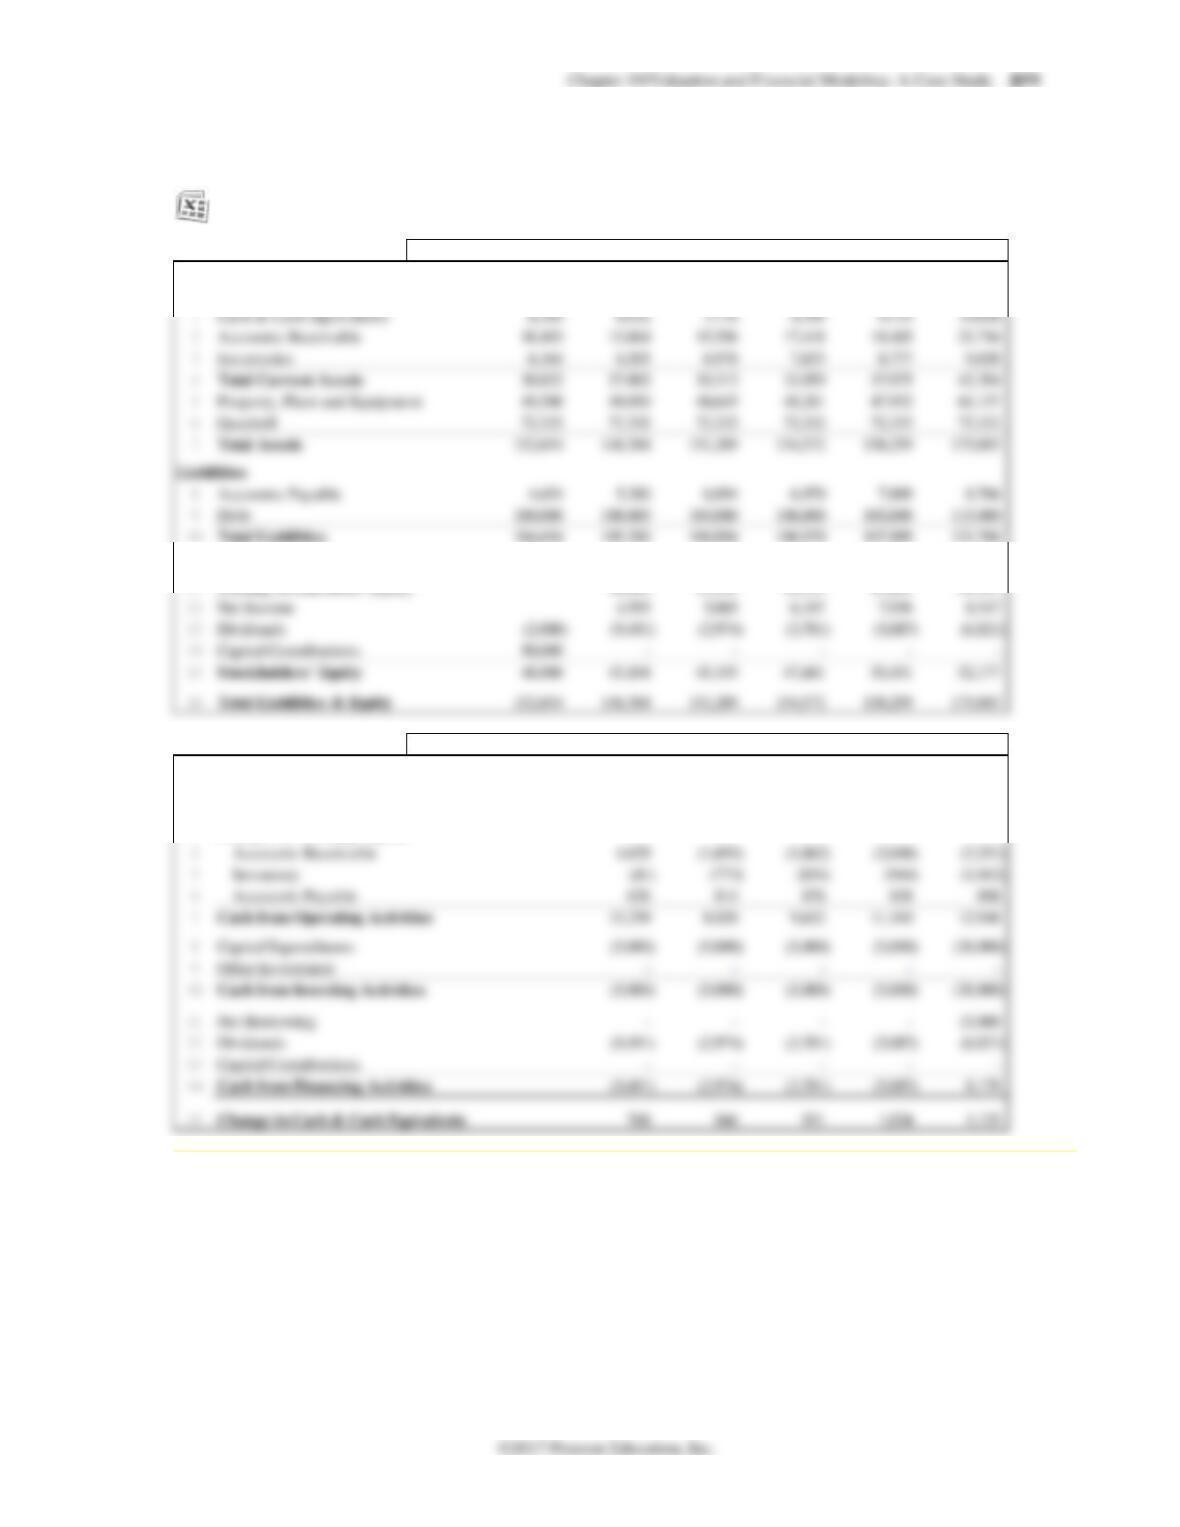
19–9. Reproduce Ideko’s balance sheet and statement of cash flows, assuming Ideko’s market share
will increase by 0.5% per year; investment, financing, and depreciation will be adjusted
accordingly; and the projected improvements in working capital occur (that is, under the
assumptions in Problem 5).
Year 2005 2006 2007 2008 2009 2010
BALANCE SHEET ($000s)
Assets
Stockholders‘ Equity
11 Starting Stockholders‘ Equity 48,000 43,104 45,195 47,601 50,451
Year 2005 2006 2007 2008 2009 2010
STATEMENT OF CASH FLOWS ($000s)
1Net Income 4,595 5,065 6,107 7,936 8,547
2Depreciation 5,450 5,405 5,365 5,328 6,795
3Changes in Working Capital
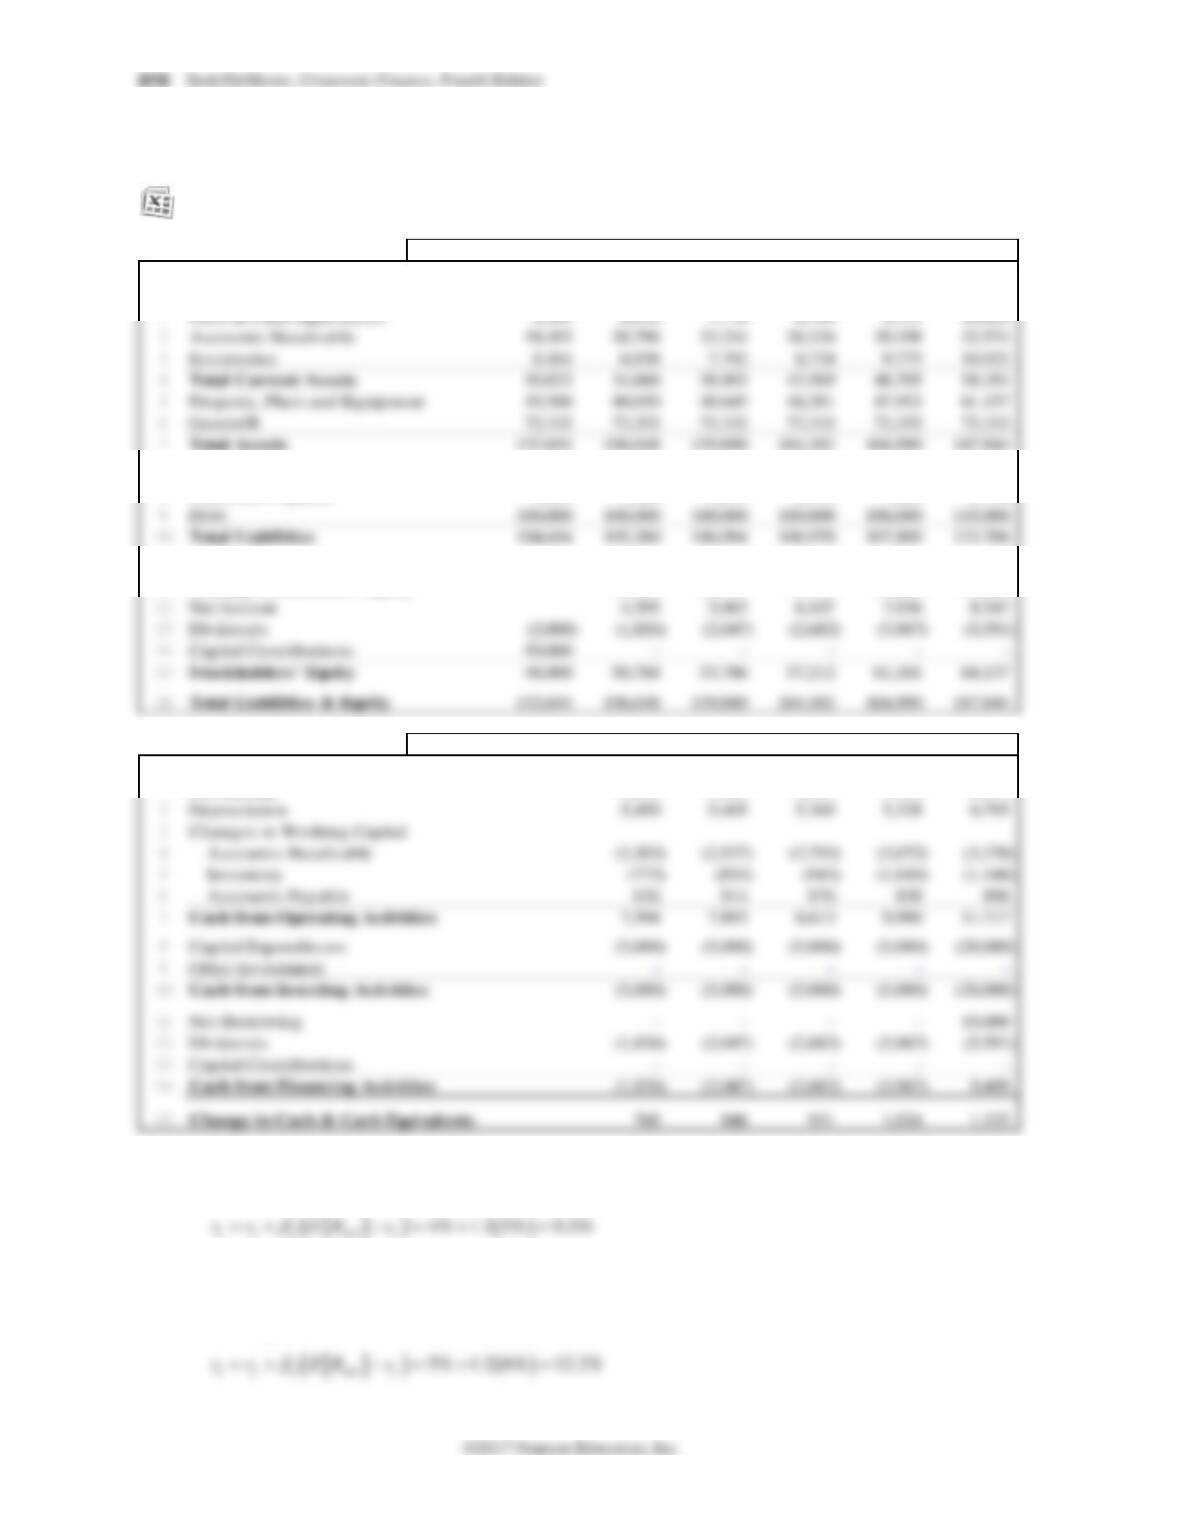
19-10. Reproduce Ideko’s balance sheet and statement of cash flows, assuming Ideko’s market share
will increase by 0.5% per year; investment, financing, and depreciation will be adjusted
accordingly; and the projected improvements in working capital do not occur (that is, under the
assumptions in Problem 6).
Year 2005 2006 2007 2008 2009 2010
BALANCE SHEET ($000s)
Assets
Liabilities
8Accounts Payable 4,654 5,280 6,094 6,970 7,809 8,706
Stockholders‘ Equity
11 Starting Stockholders‘ Equity 48,000 50,768 53,786 57,212 61,181
Year 2005 2006 2007 2008 2009 2010
STATEMENT OF CASH FLOWS ($000s)
1Net Income 4,595 5,065 6,107 7,936 8,547
19-11. Calculate Ideko’s unlevered cost of capital when Ideko’s unlevered beta is 1.1 rather than 1.2,
and all other required estimates are the same as in the chapter.
19-12. Calculate Ideko’s unlevered cost of capital when the market risk premium is 6% rather than
5%, the risk-free rate is 5% rather than 4%, and all other required estimates are the same as in
the chapter.
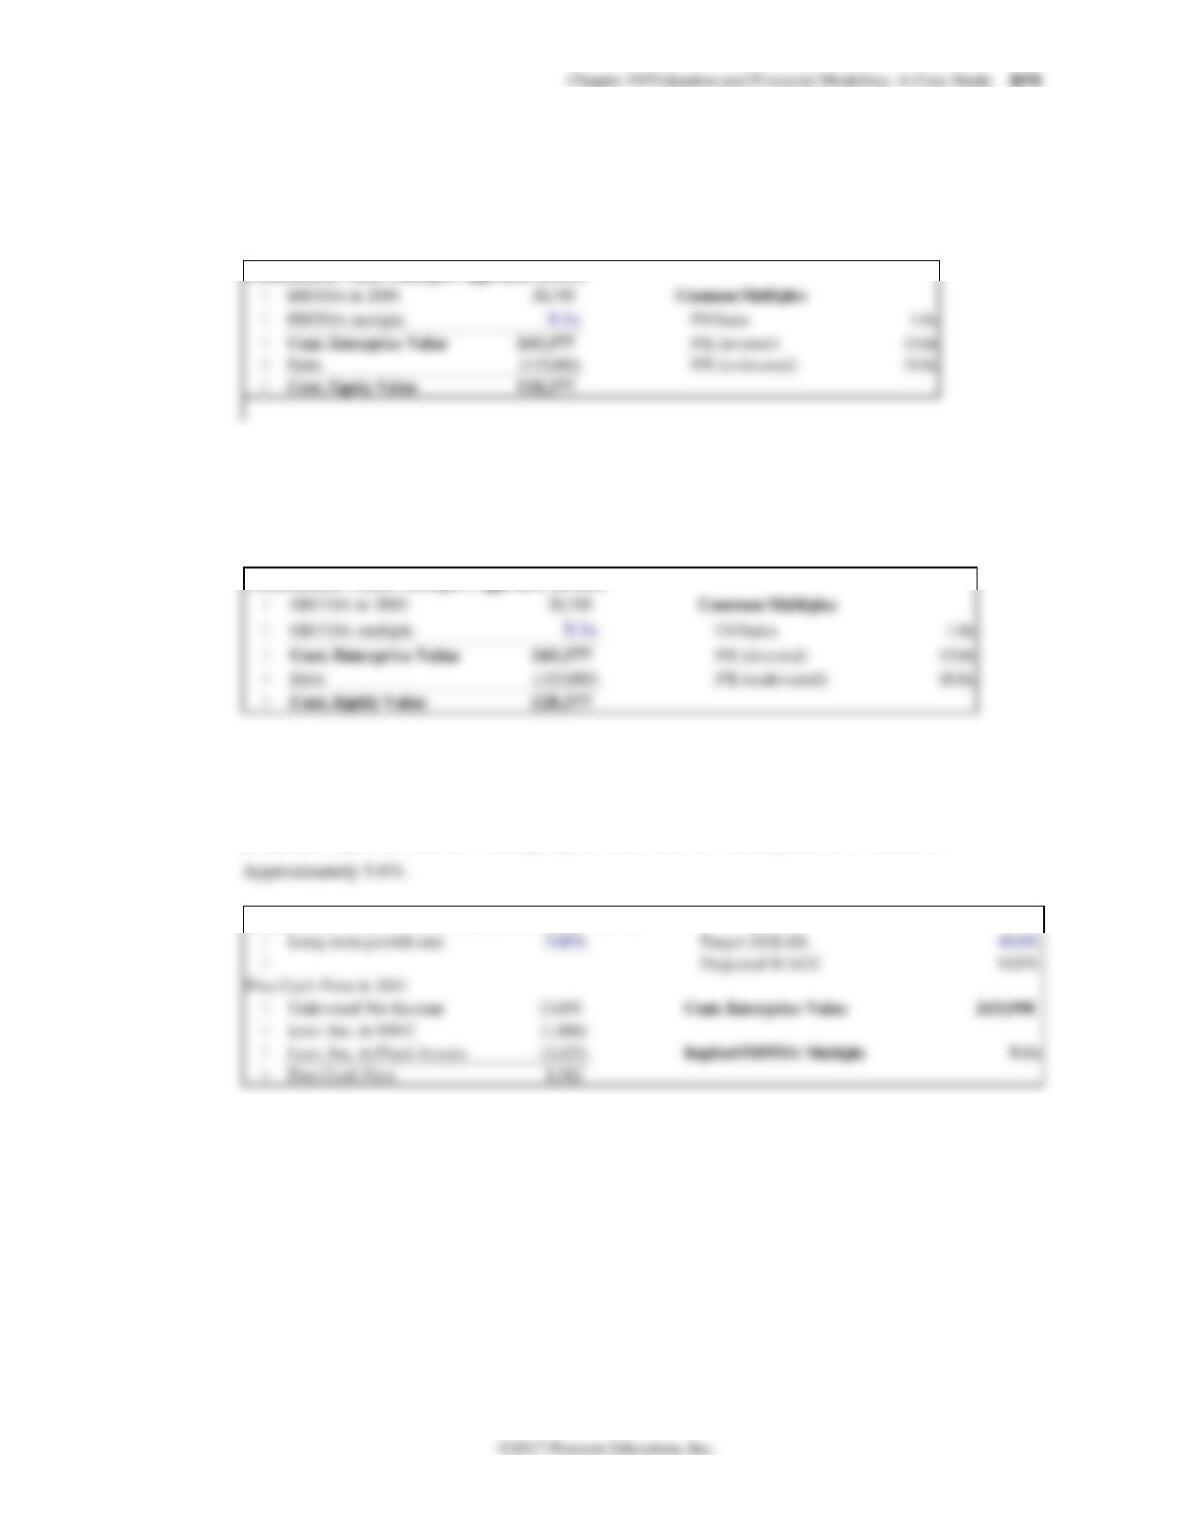
19-13. Using the information produced in the income statement in Problem 4, use EBITDA as a
multiple to estimate the continuation value in 2010, assuming the current value remains
unchanged (reproduce Table 19.15). Infer the EV/sales and the unlevered and levered P/E ratios
implied by the continuation value you calculated.
Continuation Value: Multiples Approach ($000s)
19-14. How does the assumption on future improvements in working capital affect your answer to
Problem 13?
It does not affect the answer because the working capital savings do not affect EBITDA or debt
levels.
Continuation Value: Multiples Approach ($000s)
19-15. Approximately what expected future long-run growth rate would provide the same EBITDA
multiple in 2010 as Ideko has today (i.e., 9.1)? Assume that the future debt–to-value ratio is held
constant at 40%; the debt cost of capital is 6.8%; Ideko’s market share will increase by 0.5% per
year until 2010; investment, financing, and depreciation will be adjusted accordingly; and the
projected improvements in working capital occur (i.e., the assumptions in Problem 5).
Continuation Value: DCF and EBITDA Multiple ($000s)
19-16. Approximately what expected future long-run growth rate would provide the same EBITDA
multiple in 2010 as Ideko has today (i.e., 9.1). Assume that the future debt-to-value ratio is held
constant at 40%; the debt cost of capital is 6.8%; Ideko’s market share will increase by 0.5% per
year; investment, financing, and depreciation will be adjusted accordingly; and the projected
improvements in working capital do not occur (i.e., the assumptions in Problem 6).
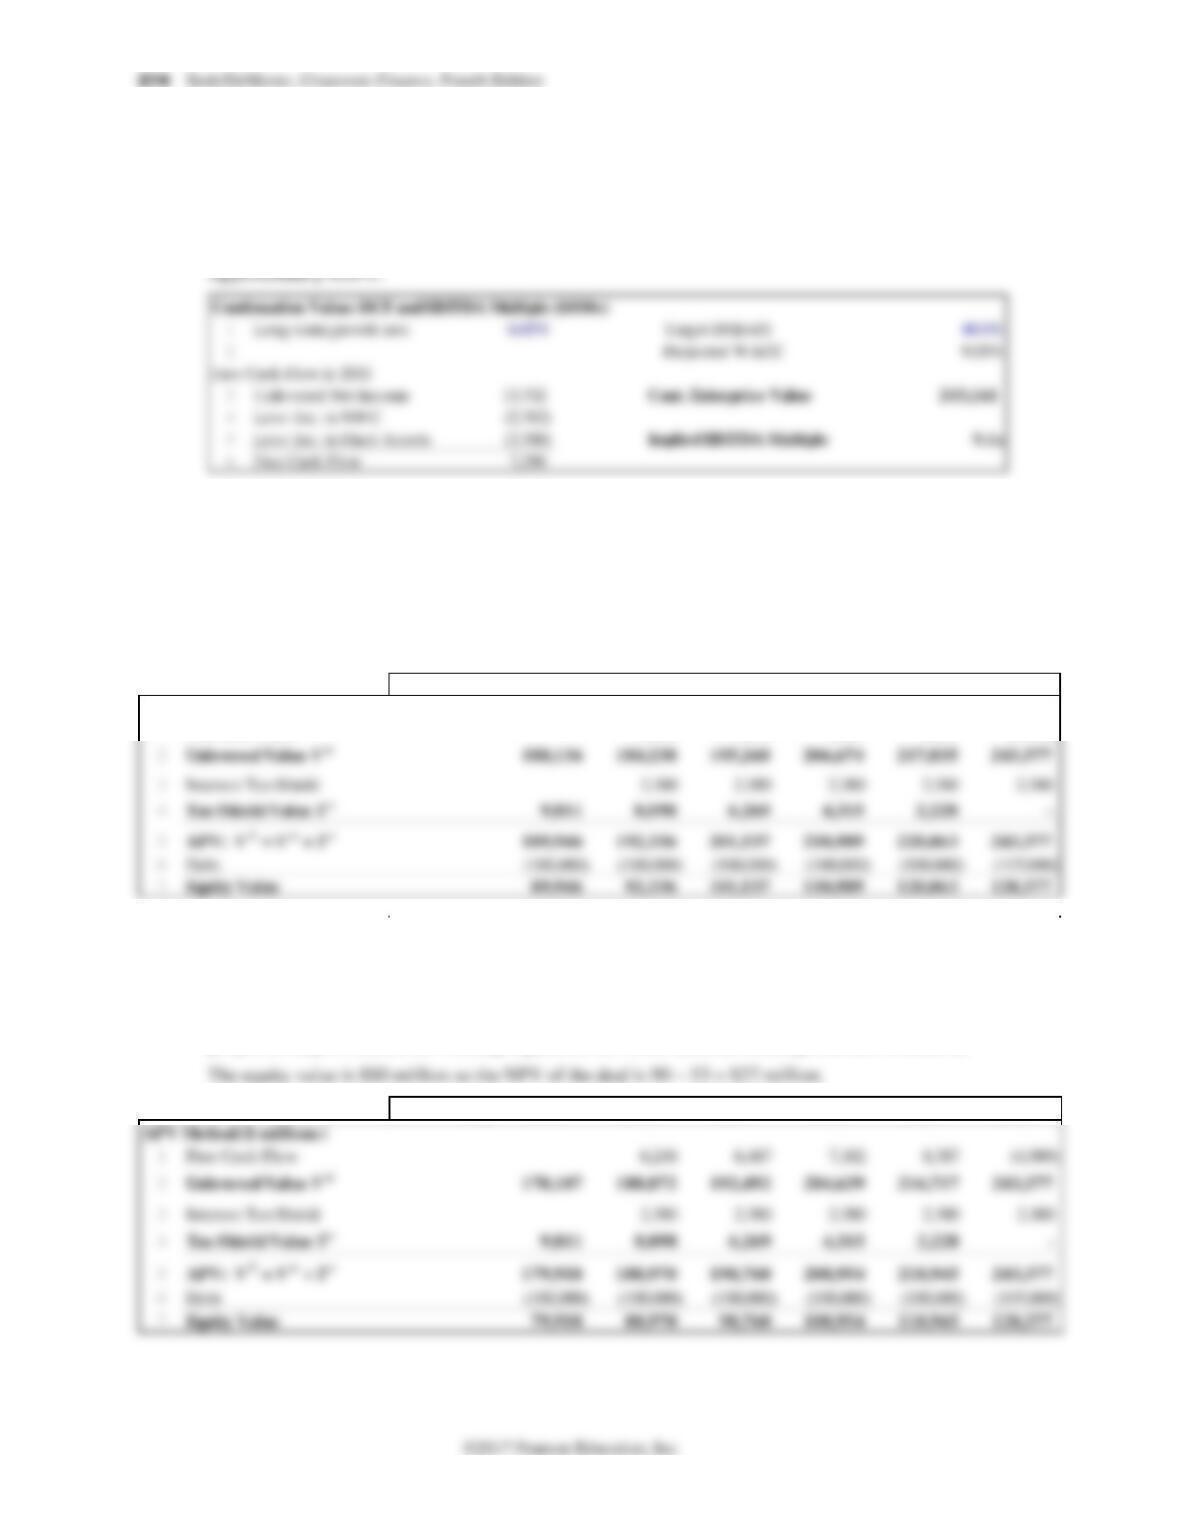
19-17. Using the APV method, estimate the value of Ideko and the NPV of the deal using the
continuation value you calculated in Problem 13 and the unlevered cost of capital estimate in
Section 19.4. Assume that the debt cost of capital is 6.8%; Ideko’s market share will increase by
0.5% per year until 2010; investment, financing, and depreciation will be adjusted accordingly;
and the projected improvements in working capital occur (i.e., the assumptions in Problem 5).
The equity value is $90 million so the NPV of the deal is 90 – 53 = $37 million.
Year 2005 2006 2007 2008 2009 2010
APV Method ($ millions)
1Free Cash Flow 13,911 7,394 8,121 9,507 (3,759)
19-18. Using the APV method, estimate the value of Ideko and the NPV of the deal using the
continuation value you calculated in Problem 13 and the unlevered cost of capital estimate in
Section 19.4. Assume that the debt cost of capital is 6.8%; Ideko’s market share will increase by
0.5% per year; investment, financing, and depreciation will be adjusted accordingly; and the
projected improvements in working capital do not occur (i.e., the assumptions in Problem 6).
Year 2005 2006 2007 2008 2009 2010
19-19. Use your answers from Problems 17 and 18 to infer the value today of the projected
improvements in working capital under the assumptions that Ideko’s market share will increase
by 0.5% per year and that investment, financing, and depreciation will be adjusted accordingly.