1. The weighted average cost of capital is independent of the firm’s capital structure.
2. The WACC of a firm with debt is equal to the unlevered cost of equity.
1
2
3
4
5
6
7
8
9
10
11
12
13
14
16
17
18
19
20
21
26
27
30
31
32
33
34
35
36
41
45
37
46
47
48
53
56
49
50
58
59
60
61
62
63
64
65
66
A B C D E F G H I J K L
1/6/2015
Situation
Modigliani and Miller without Taxes
Proposition I.
Proposition II.
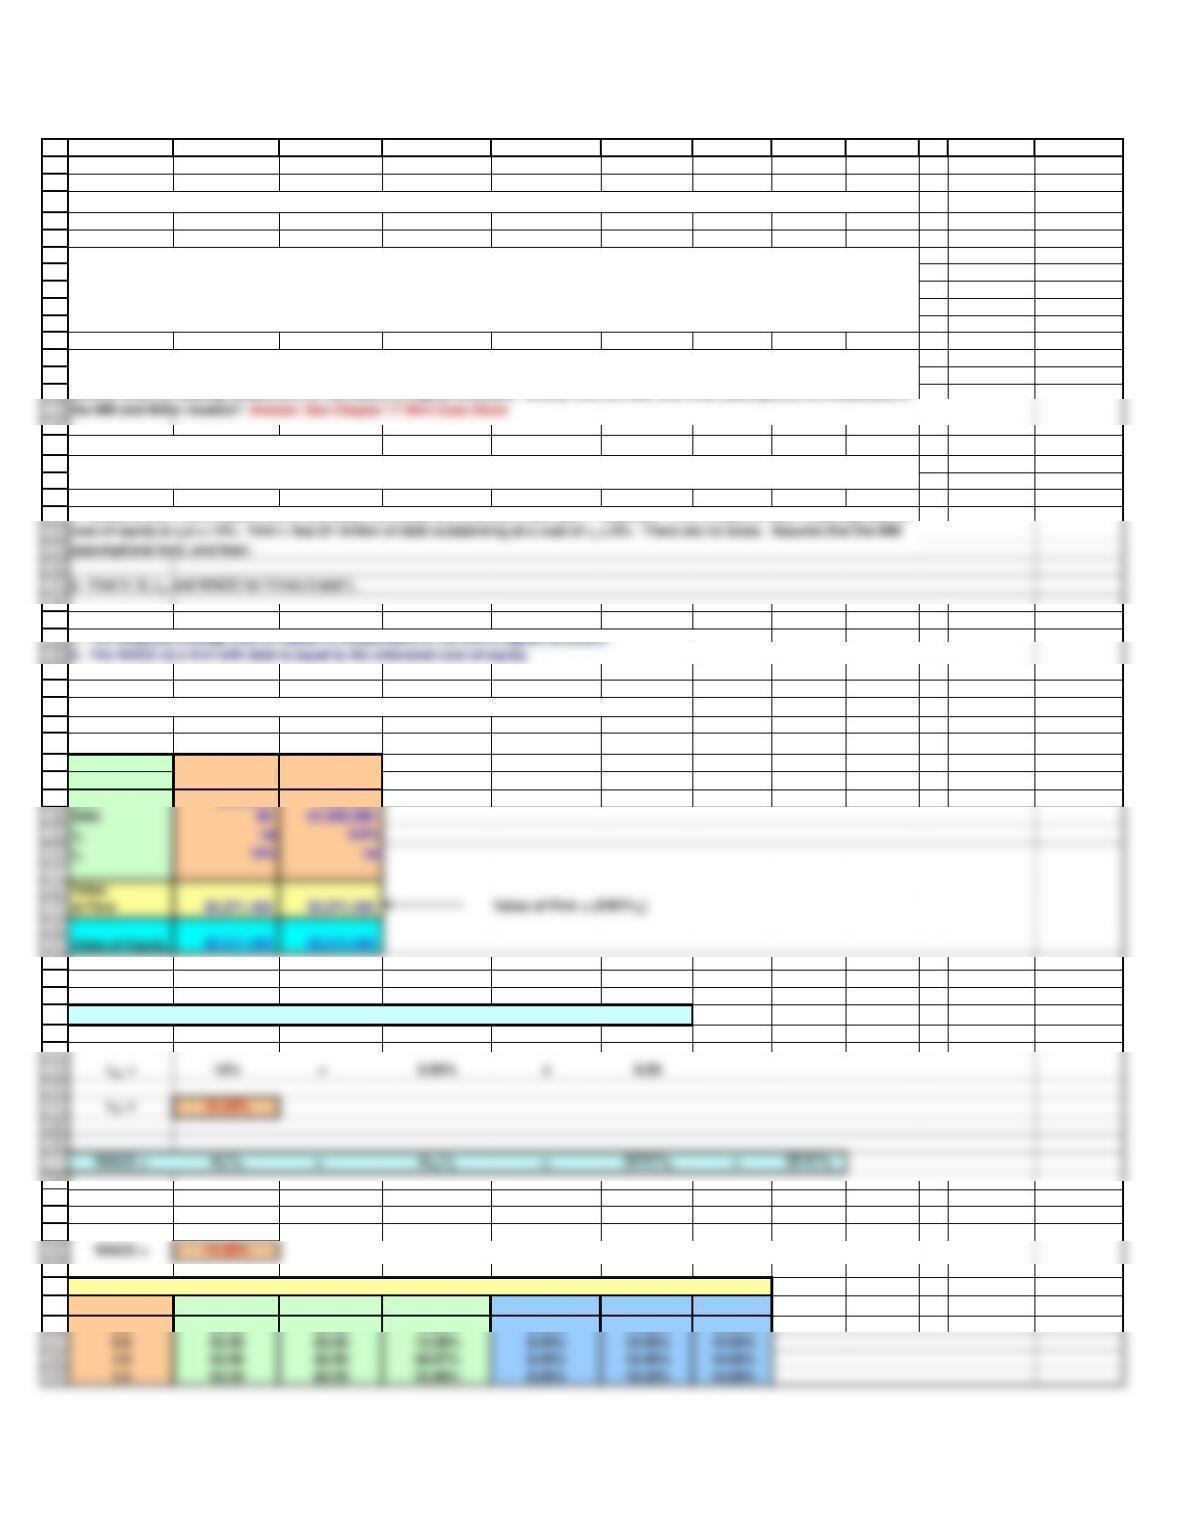
Input Data Firm U Firm L
No Debt Some Debt
EBIT $500,000 $500,000
rsL = rsU + (rsU-rd)x (D/S)
WACC = 2.24% + 11.8%
MM without Taxes
D V S D/V
rdrsWACC
0.0 $3.50 $3.50 0.00% 8.00% 14.00% 14.00%
Chapter 17. Mini Case
David Lyons, the CEO of Lyons Solar Technologies, is concerned about his firm’s level of debt financing. The company uses short-
term debt to finance its temporary working capital needs, but it does not use any permanent (long-term) debt. Other solar technology
companies average about 30 percent debt, and Mr. Lyons wonders why the difference occurs, and what its effects are on stock
prices. To gain some insights into the matter, he poses the following questions to you, his recently hired assistant.
Franco Modigliani and Merton Miller developed a model to examine the impact of debt on firm value. In this first version it is
assumed that taxes are zero.
a. Business Week recently ran an article on companies’ debt policies, and the names Modigliani and Miller (MM) were mentioned
several times as leading researchers on the theory of capital structure. Briefly, who are MM, and what assumptions are embedded in
The cost of equity, rsL = rsU + Risk premium = rsU + (rsU -rd)(D/S)
1. Assume that Firms U and L are in the same risk class, and that both have EBIT = $500,000. Firm U uses no debt financing, and its
71
72
73
74
75
76
77
78
91
92
93
94
95
96
97
98
106
107
108
113
117
120
Value of Tax
Shield
Value of Firm = Value of Unlevered Firm +T x Debt
Total Market
Value of Firm
109
122
123
124
125
126
127
128
129
130
A B C D E F G H I J K L
Modigliani and Miller with CorporateTaxes
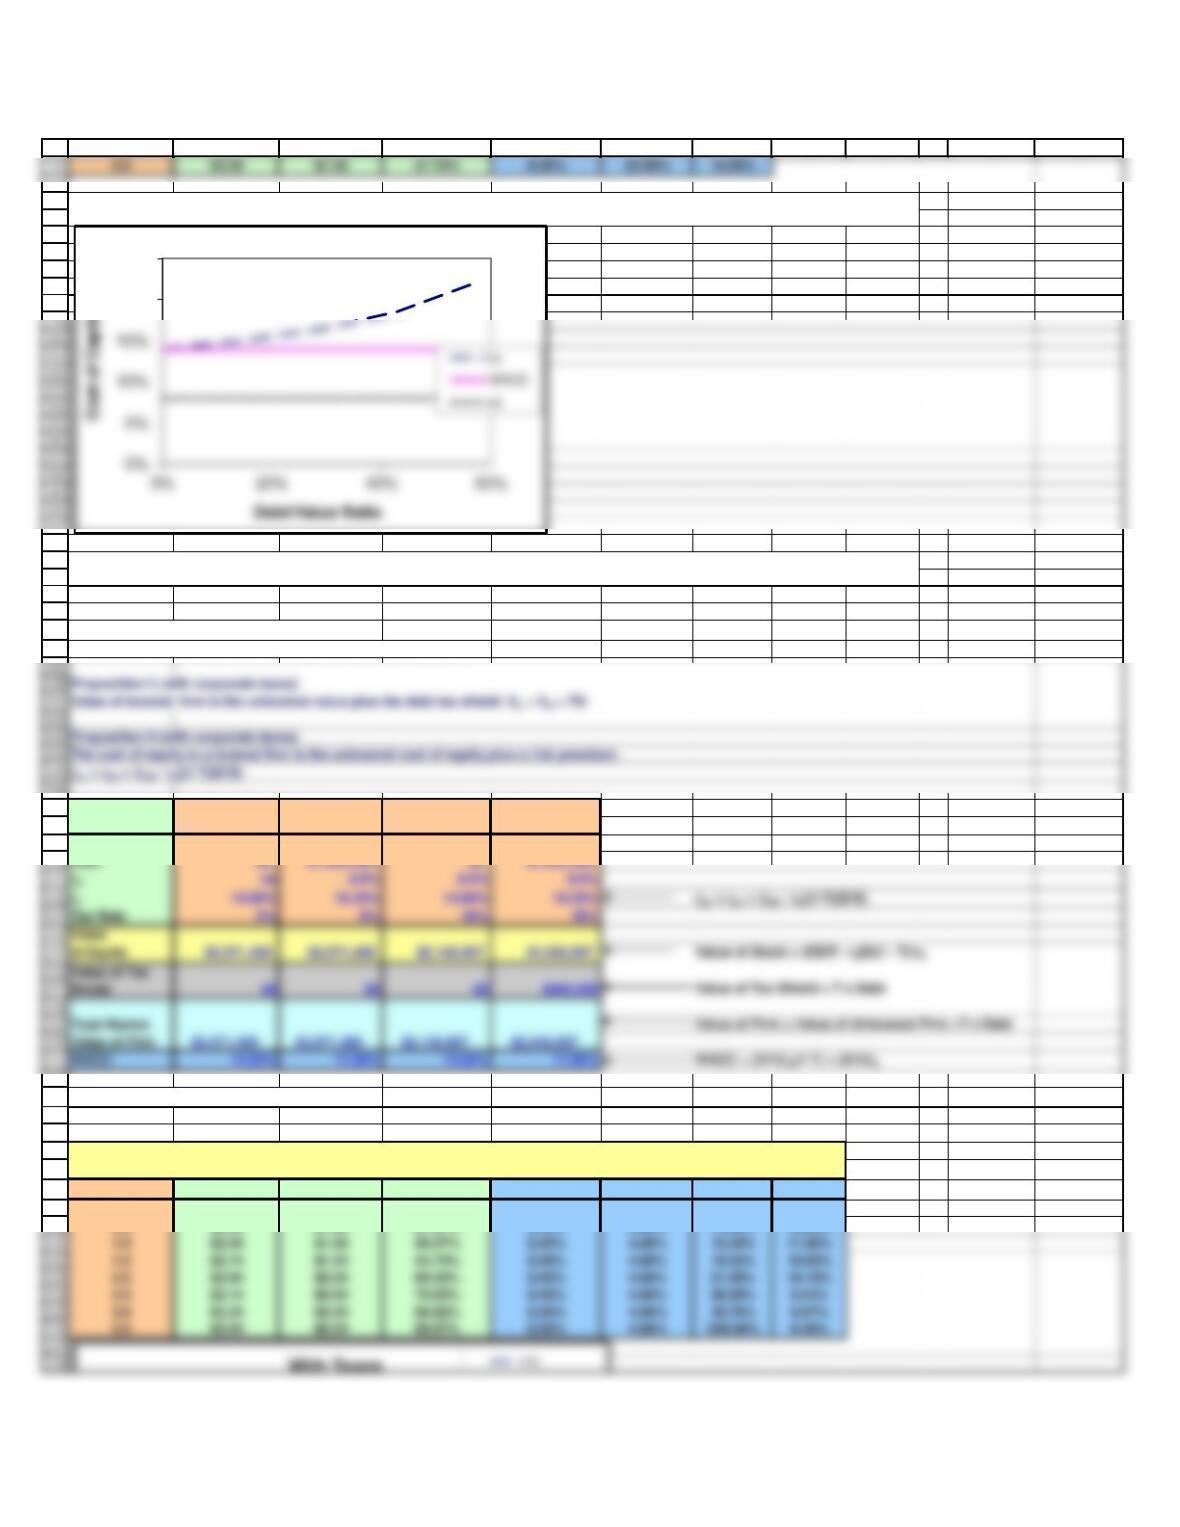
The MM results are different once corporate taxes are added in.
Firm U Firm L 40% Tax Rate 40% Tax Rate
Input Data No Debt Some Debt No Debt Some Debt
EBIT $500,000 $500,000 $500,000 $500,000
Effects of Leverage: MM Models
MM with Corporate Taxes
Tc = 40.00%
DV S D/V
rdrd x (1-T) rsWACC
0.0 $2.14 $2.14 0.00% 8.00% 4.80% 14.00% 14.00%
0.5 $2.34 $1.84 21.37% 8.00% 4.80% 14.98% 12.80%
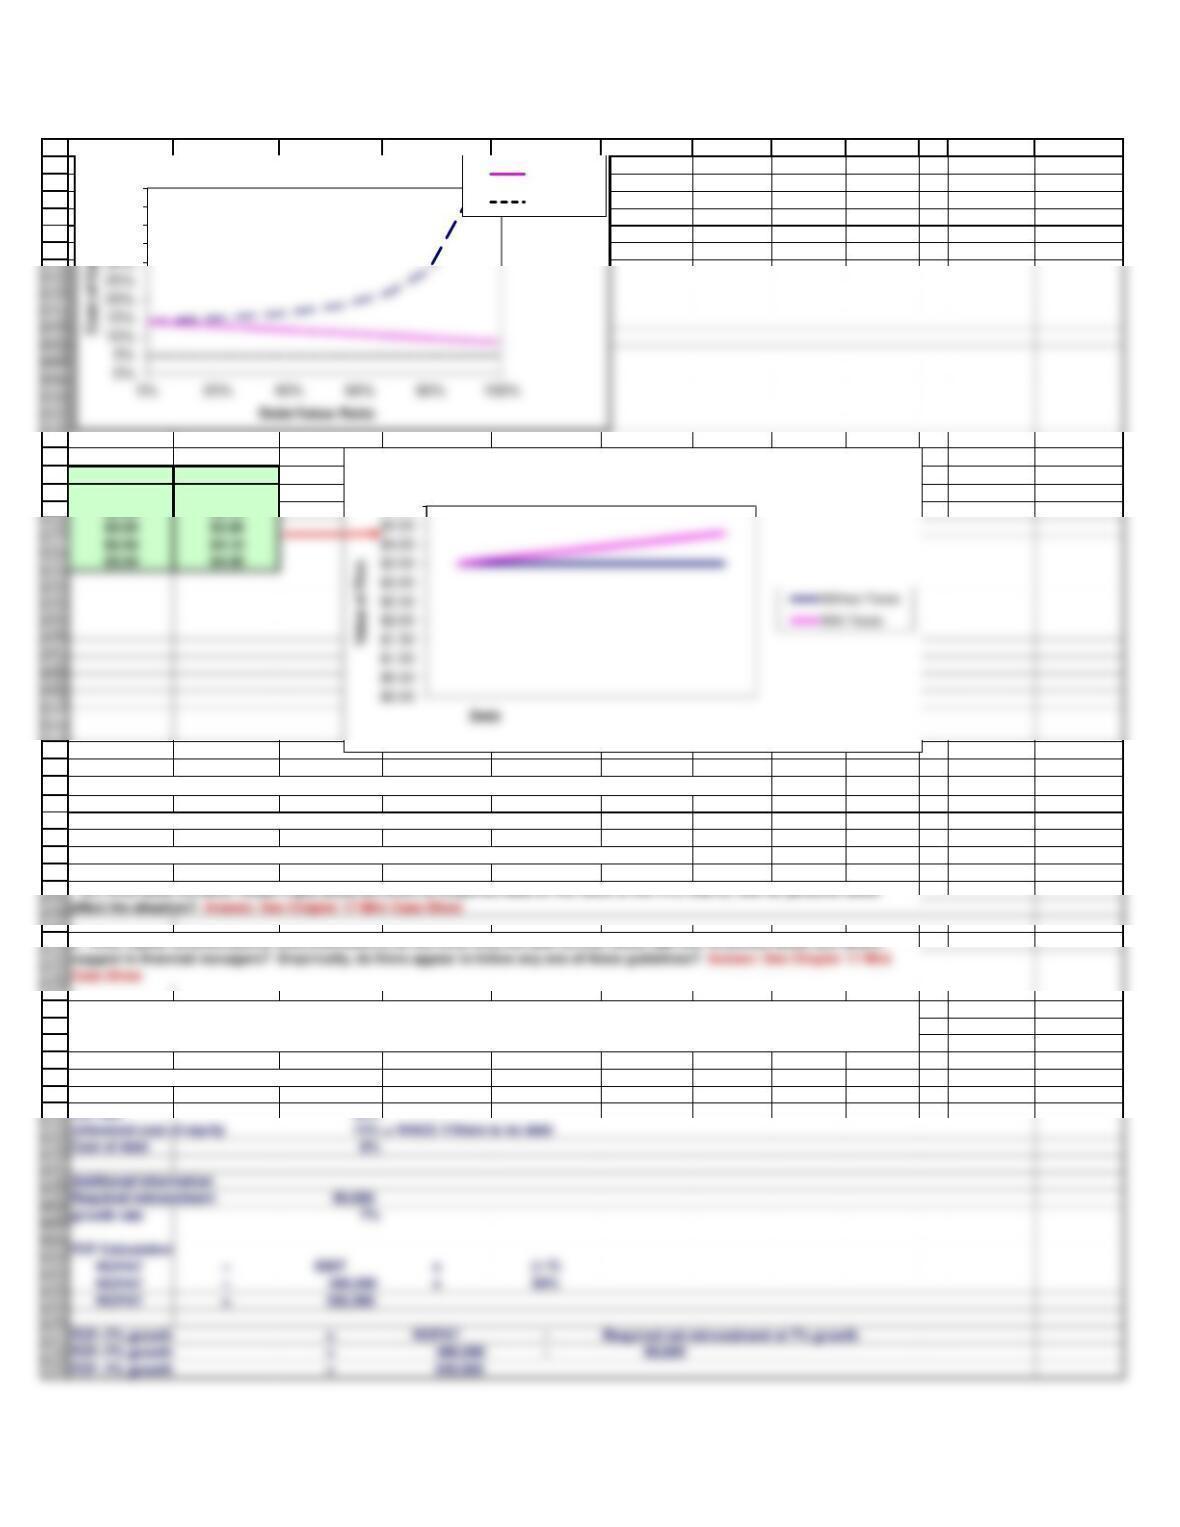
(2.) Graph (a) the relationships between capital costs and leverage as measured by D/V, and (b) the relationship between value and
D.
c. Using the data given in Part b, but now assuming that Firms L and U are both subject to a 40 percent corporate tax rate, repeat the
analysis called for in b(1) and b(2) under the MM with-tax model.
20%
25%
Without Taxes
139
140
141
142
143
144
155
156
157
162
158
159
affect the situation? Answer: See Chapter 17 Mini Case Show
suggest to financial managers? Empirically, do firms appear to follow any one of these guidelines? Answer: See Chapter 17 Mini
50,000
173
174
175
176
177
178
179
180
183
184
187
188
189
190
191
192
193
194
A B C D E F G H I J K L
V-No Taxes V-Taxes
$3.50 $3.50
$3.50 $3.70
Relevant information from part c.
EBIT
500,000
Tax rate
40%
f. Suppose that Firms U and L are growing at a constant rate of 7% and that the investment in net operating assets required to
support this growth is 10% of EBIT. Use the compressed adjusted present value (APV) model to estimate the value of U and L. Also
estimate the levered cost of equity and the weighted average cost of capital.
e. What capital structure policy recommendations do the three theories (MM without taxes, MM with corporate taxes, and Miller)
d. Now suppose investors are subject to the following tax rates: Td = 30% and Ts = 12%.
(1.) What is the gain from leverage according to the Miller model?
(2.) How does this gain compare to the gain in the MM model with corporate taxes?
(3.) What does the Miller model imply about the effect of corporate debt on the value of the firm, that is, how do personal taxes
35%
40%
45%
50%
With Taxes rs
WACC
rd x (1-T)
$5.00
Relationship Between Value and Debt
210
211
212
213
214
215
216
217
218
219
220
236
237
238
239
240
241
242
243
244
245
246
254
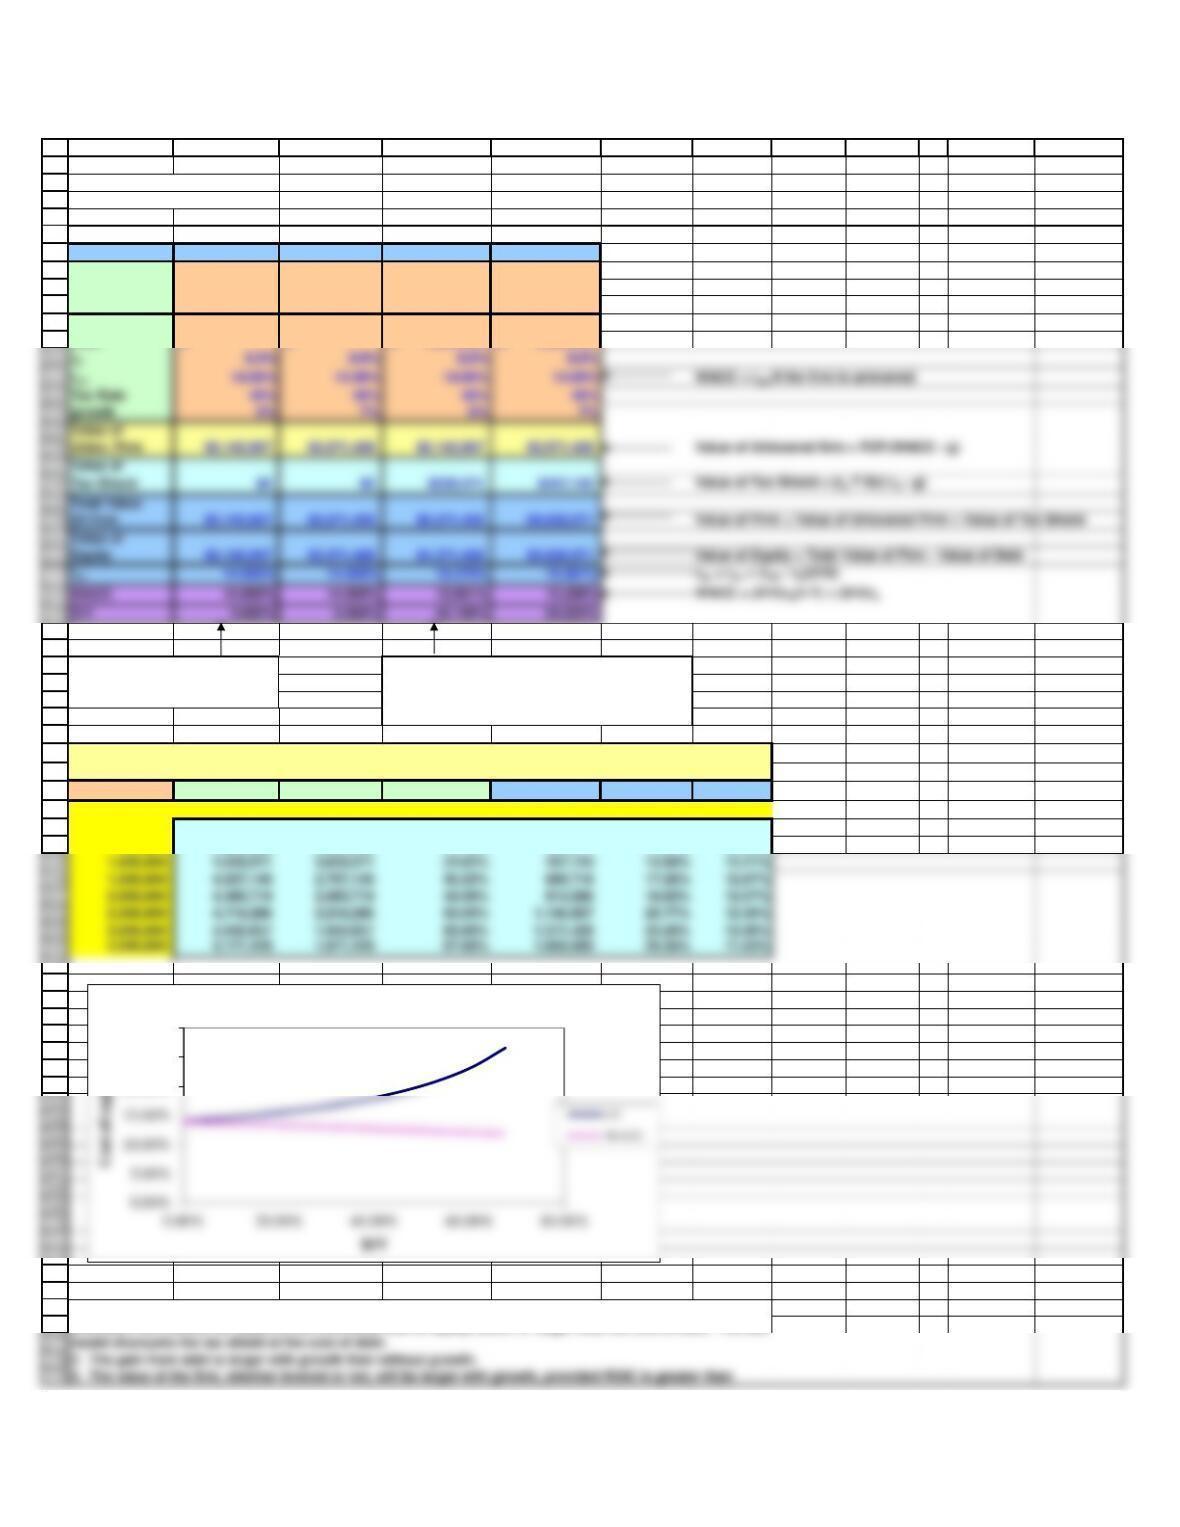
1,000,000 4,028,571 3,028,571 24.82% 457,143 15.98% 13.21%
1,500,000 4,257,143 2,757,143 35.23% 685,714 17.26% 12.87%
2,000,000 4,485,714 2,485,714 44.59% 914,286 18.83% 12.57%
2,500,000 4,714,286 2,214,286 53.03% 1,142,857 20.77% 12.30%
3,000,000 4,942,857 1,942,857 60.69% 1,371,429 23.26% 12.06%
247
248
model discounts the tax shield at the cost of debt.
255
256
257
258
259
260
261
262
272
273
274
275
276
A B C D E F G H I J K L
FCF — 0% growth
= NOPAT
FCF — 0% growth
= 300,000
Firm U Firm U Firm L Firm L
Data for 40% Tax Rate 40% Tax Rate 40% Tax Rate 40% Tax Rate
Lyons zero Debt zero Debt some Debt some Debt
and no growth and 7% growth and no growth and 7% growth
exp. FCF 300,000$ 250,000$ 300,000$ 250,000$
Debt –$ –$ 1,000,000$ 1,000,000$
APV with growth: rTS = rsU.growth = 7.00%
T = 40.00%
DV S D/V Tax shield
rsL WACC
$4,028,571 $3,028,571 24.823% $457,143 15.981% 13.206%
– 3,571,429 3,571,429 0.00% – 14.00% 14.00%
500,000 3,800,000 3,300,000 13.16% 228,571 14.91% 13.58%
Things to note:
This column will NOT be the same as the “40%
tax rate, some debt” column from part c
because we are discounting the tax shield at rsU
instead of rd.
This column is the same as the
“40% tax rate no debt” column
from part c.
1. The gain from the tax shield will be lower using the APV model than under MM because the APV model
discounts the interest tax shield at the unlevered cost of equity, which is larger than the cost of debt. The MM
WACC. Although we don’t show it here, ROIC is greater than WACC, so the value of the firm increases with
growth.
20.00%
25.00%
30.00%
Cost of Capital with growth
224
226
230
232
235
growth 0% 7% 0% 7%
Unlev. Firm $2,142,857 $3,571,429 $2,142,857 $3,571,429 Value of Unlevered firm = FCF/(WACC – g)
Of Firm $2,142,857 $3,571,429 $2,371,429 $4,028,571 Value of Firm = Value of Unlevered Firm + Value of Tax Shield