CFIN6 – CHAPTER 16
INTEGRATIVE PROBLEM SOLUTION
Part 1: Financial Forecasting
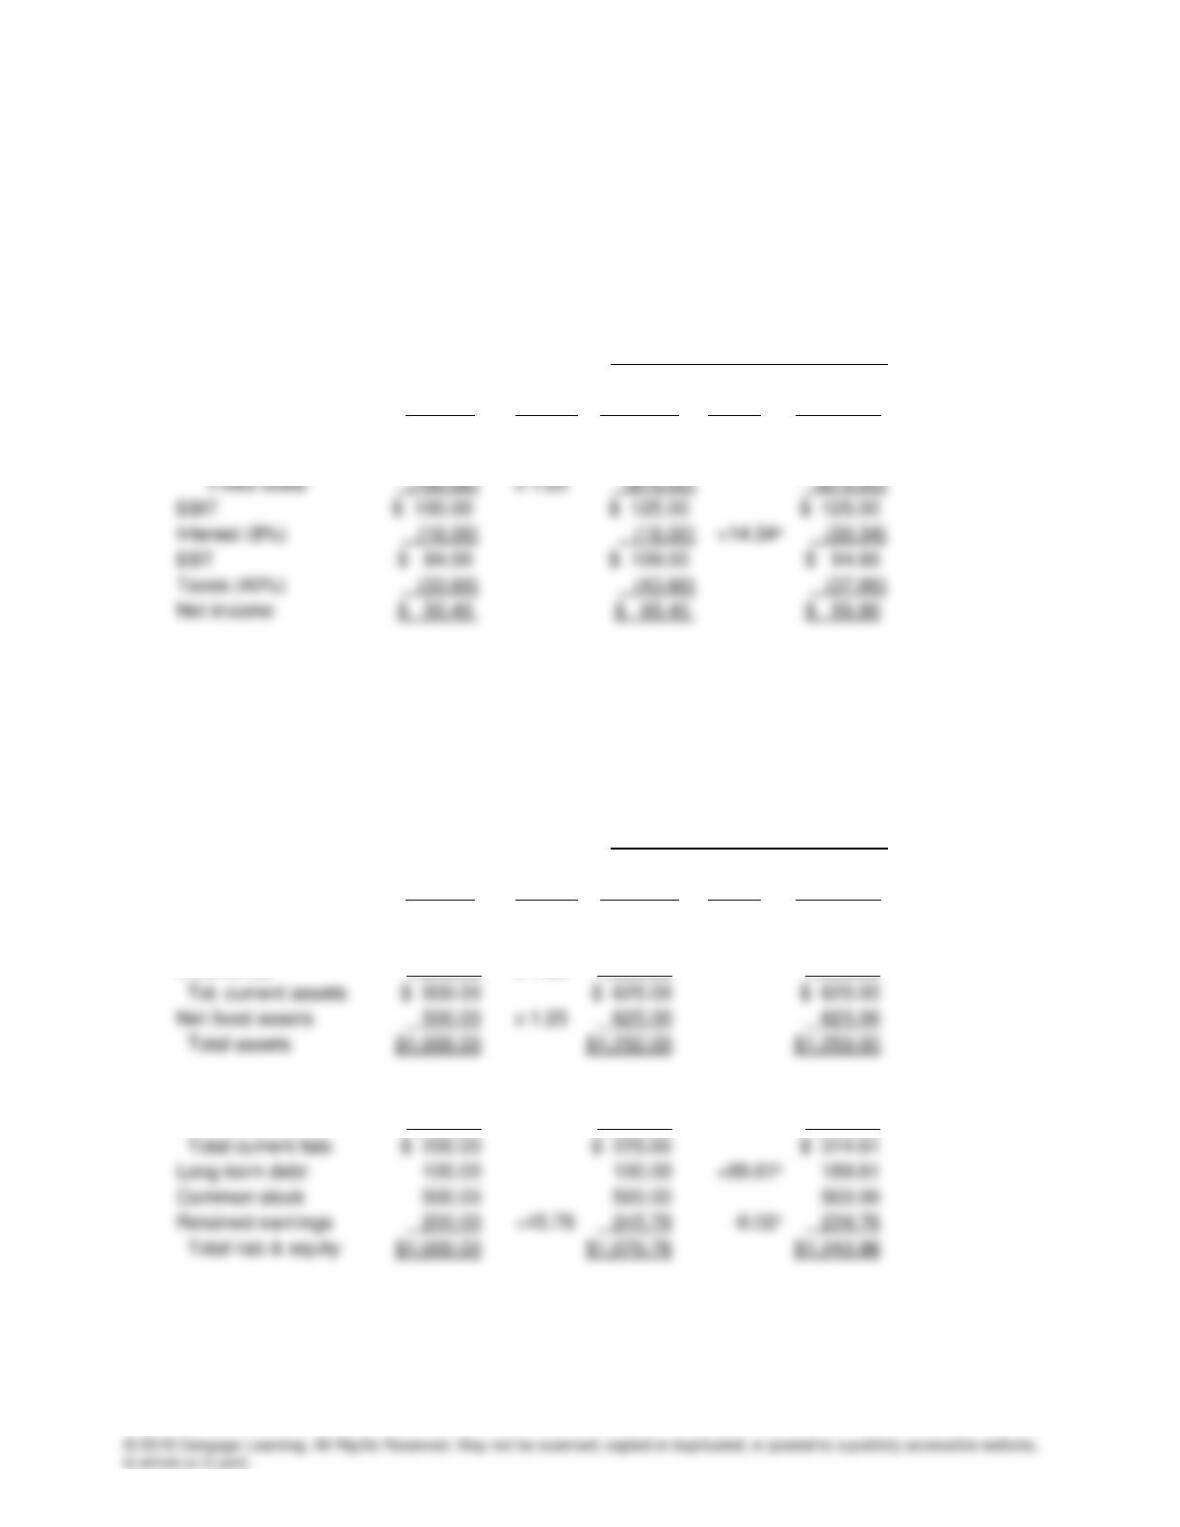
a. I. INCOME STATEMENT:
Next Year’s Forecast
Last Year Forecast Feed-
Actual Basis 1st Pass Back 2nd Pass
Sales $2,000.00 x 1.25 $2,500.00 $2,500.00
Less: Var. costs (60%) (1,200.00) x 1.25 (1,500.00) 1,500.00
Dividends (30%) $ 15.12 $ 19.62 $ 17.04
RE addition $ 35.28 $ 45.78 $ 39.76
a External funds are financed with 50 percent notes payables and 50 percent long-term debt, so the
change in interest expense equals 0.08($89.61) + 0.08($89.61) = $7.17 + $7.17 = $14.34.
II. BALANCE SHEET:
Next Year’s Forecast
Last Year Forecast Feed-
Actual Basis 1st Pass Back 2nd Pass
Cash & securities $ 20.00 x 1.25 $ 25.00 $ 25.00
Accounts receivable 240.00 x 1.25 300.00 300.00
A/P and accruals $ 100.00 x 1.25 $ 125.00 $ 125.00
Notes payable 100.00 100.00 +89.61a 189.61
AFN $ 179.22 $ 6.02
Cumulative AFN $ 185.24
aΔ in notes payable = $179.22(0.5) = $89.61.
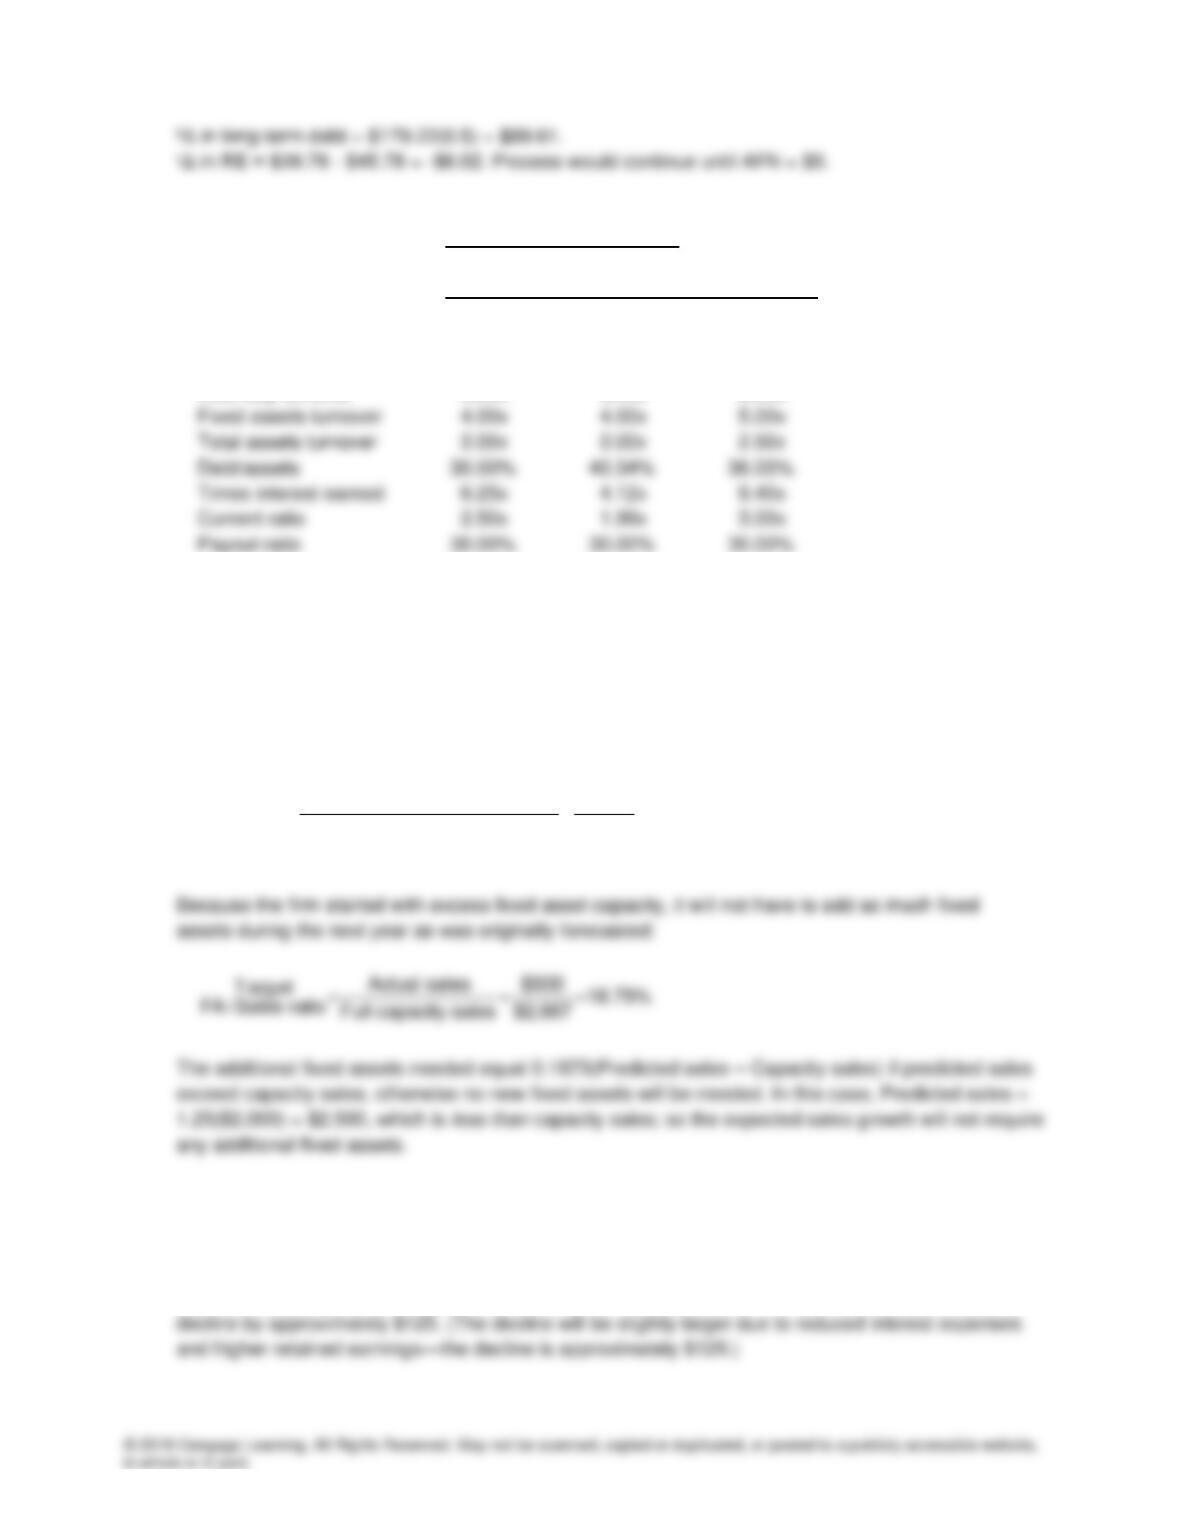
b. Key ratios NWC
Last Year Next Year Industry
Actual 2nd pass Last Year
Profit margin 2.52% 2.27% 4.00%
ROE 7.20% 7.68% 15.60%
DSO 43.20 days 43.20 days 32.00 days
NWC’s profit margin and ROE are only about half as high as the industry average—NWC is not
very profitable relative to other firms in its industry. Further, its DSO is too high, and its
inventory turnover ratio is too low, which indicates that the company is carrying excess
inventory and receivables. In addition, its debt ratio is forecasted to move above the industry
average, and its coverage ratio is low and forecasted to decline even more. The company is not
in good shape, and things do not appear to be improving.
c(1).
( )
Actual sales $2,000
Full capacity $2,667
sales Percent of capacity at which 0.75
fixed assets were operated
= = =
c(2). We had previously found an AFN of $185.24 using two passes through the balance sheet method. This
AFN value was based on an increase in fixed assets equal to 0.25($500) = $125. As noted earlier, if
NWC was operating at 75 percent of capacity last year, then the level of fixed assets would not have to
be increased to achieve the sales level forecasted for next year. Therefore, the funds needed will
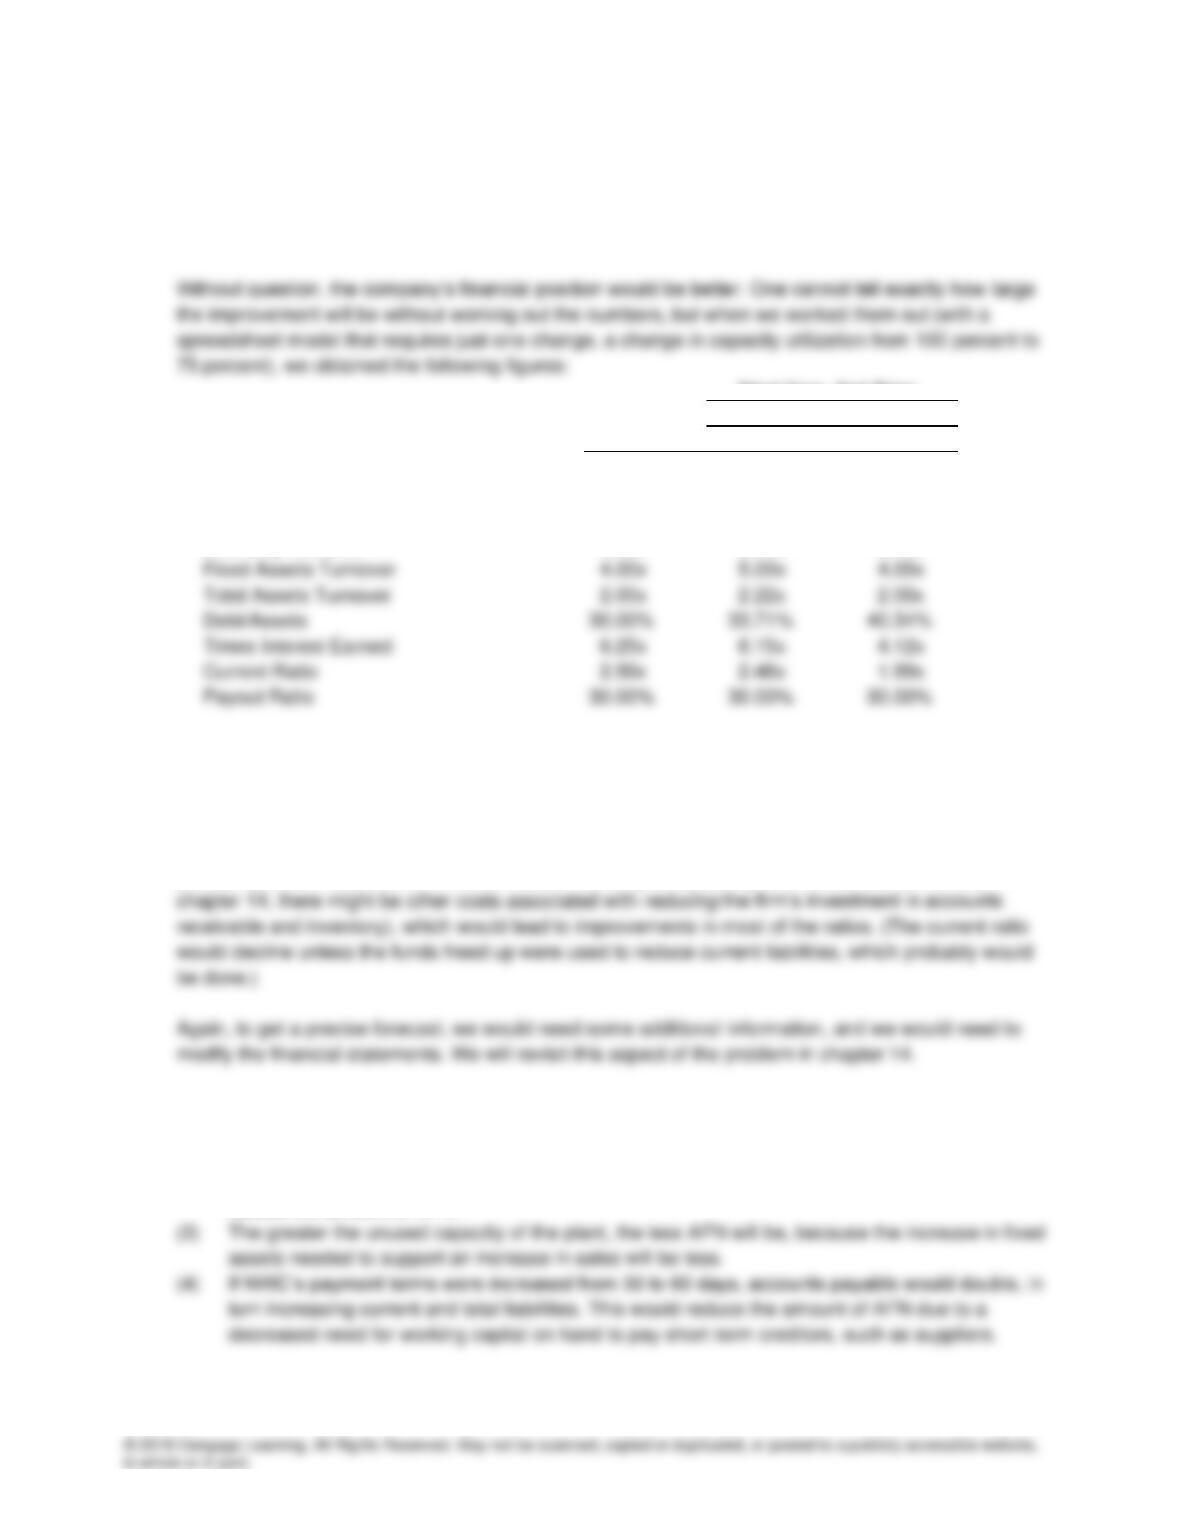
d. We would expect almost all the ratios to improve. With less financing, interest expense would be
reduced. Depreciation and maintenance, in relation to sales, also would decline. These changes would
improve the profit margin and ROE. Also, the total assets turnover ratio would improve. Similarly, with
less debt financing, the debt ratio and the current ratio would both improve, as would the TIE ratio.
Next Year, 2nd Pass
Key Ratios Last Year If Last Year Was At
Actual 75% Cap. 100% Cap.
Profit Margin 2.52% 2.51% 2.27%
Roe 7.20% 8.44% 7.68%
Days Sales Outstanding 43.20 days 43.20 days 43.20 days
Inventory Turnover 5.00x 5.00x 5.00x
e. The DSO and inventory turnover ratio indicate that NWC has excessive inventories and receivables.
The effect of improvements here would be similar to that associated with excess capacity in fixed
assets. Sales could be expanded without proportionate increases in current assets. (Actually, these
items probably could be reduced even if sales did not increase.) Thus, the AFN would be less than
previously determined, and this would reduce financing and possibly other costs (as we will see in
f. (1) If the payout ratio were reduced, then more earnings would be retained, and this would reduce
the need for external financing, or AFN.
(2) If the profit margin goes up, then both total and retained earnings will increase, and this will

Part II. Breakeven Analysis and Leverage
a. The computation for operating breakeven is:
OpBE F $60 million
Q 15 million units
P V $10(1-0.6)
= = =
−
b. The breakeven chart is:
Fixed costs
Total operating costs
If NWC can produce and sell 20 million units of the chemical, the proposal should be adopted. At 20
million units, NWC will produce an operating profit.
c. At 20 million units of sales, the operating section of NWC’s income statement would be:
Sales (20 million units @ $10) $200,000,000
Variable costs (60%, or $6) (120,000,000)
Gross profit $ 80,000,000
Fixed costs (60,000,000)
200
250
300
350
Total sales revenues
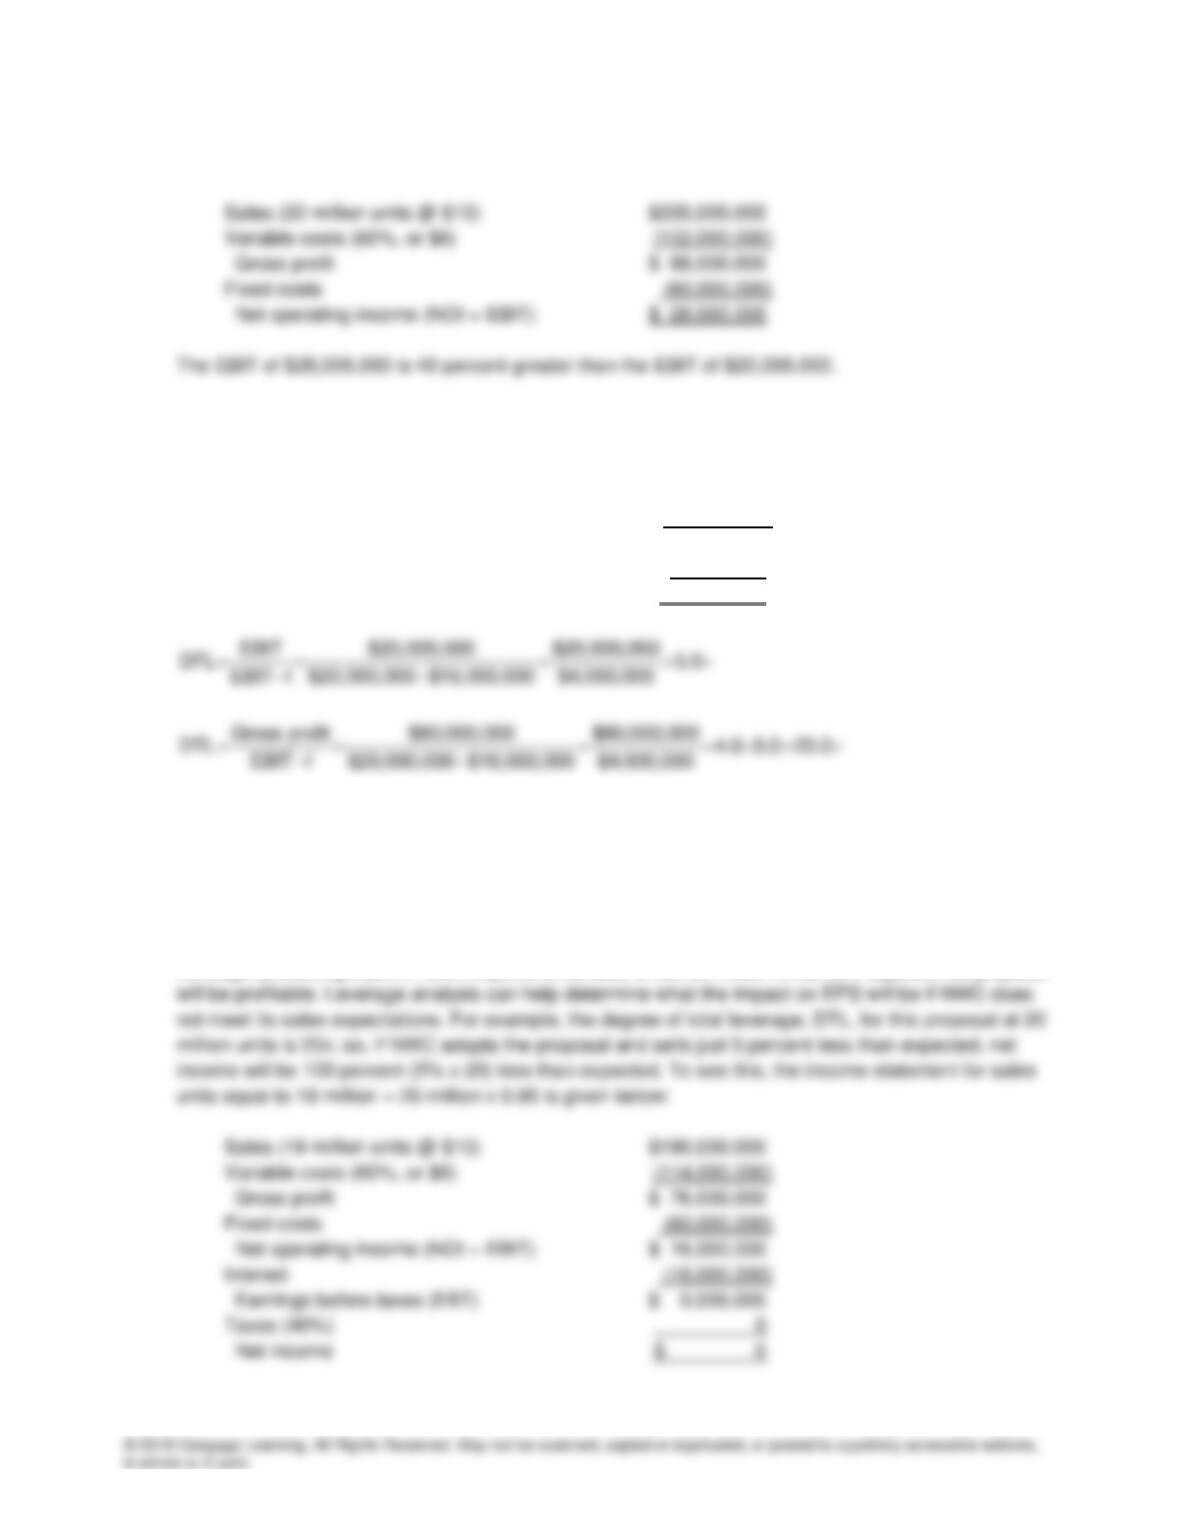
of the income statement would look like if NWC’s sales actually were $200,000,000(1.10) =
$220,000,000:
d. At 20 million units of sales, the financing section of NWC’s income statement would be:
Net operating income (EBIT) $20,000,000
Interest (16,000,000)
Earnings before taxes (EBt) $ 4,000,000
Taxes (40%) 1,600,000
Net income $ 2,400,000
If sales turn out to be 10 percent greater than expected, EPS will be 10% x 20 = 200% greater than
expected.
e. Breakeven analysis can be used to help determine the feasibility of the proposal. As the above
analyses show, NWC would have to sell at least 15 million units of the chemical before the proposal

The degree of total leverage suggests the proposal is fairly risky if the expected level of sales is 20
million units. If the expected level of sales were much higher, the proposal would not seem as risky.