C16
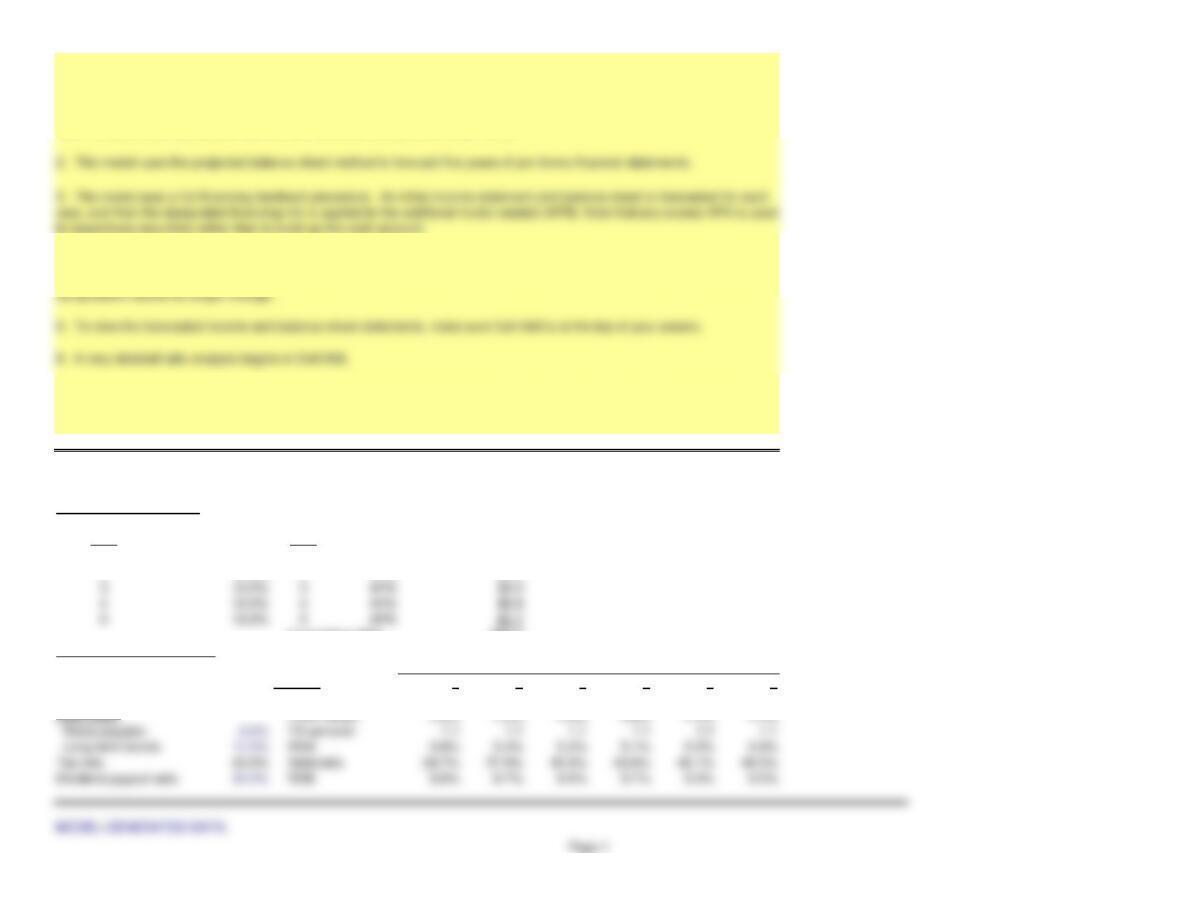
INPUT DATA: KEY OUTPUT:
Forecasted sales growth:
Year Year
112.0% 1AFN $4.6
212.0% 2AFN $5.3
Cumulative AFN $30.4
AFN financing percentages:
Notes payable 40.0%
Long-term bonds 60.0% Ratios: 012345
Common stock 0.0% Current ratio 2.5 2.3 2.1 2.0 1.9 1.8
4. If you get an error due to circular reasoning, press the F9 (CALC) until the calculations are changed. To be sure that the
calculations are complete, continue to press the CALC key until the Cumulative AFN key output stabilizes–that is, until the
7. You can view a graph that shows how the debt-to-asset ratio changes over time at different sales growth rates by clicking
on the worksheet labeled GRAPH at the bottom of this spreadsheet. To return to this worksheet, click on the worksheet labeled
C08 at the bottom of the GRAPH worksheet.
Forecasting
Year
1. There are a number of instructions with which you should be familiar to use these computerized models. These instructions
appear in a separate worksheet labeled INSTRUCTIONS. If you have not already done so, you should read these instructions
now. To read these instructions, click on the worksheet labeled INSTRUCTIONS.
3. The model uses a full financing feedback procedure. An initial income statement and balance sheet is forecasted for each
C16
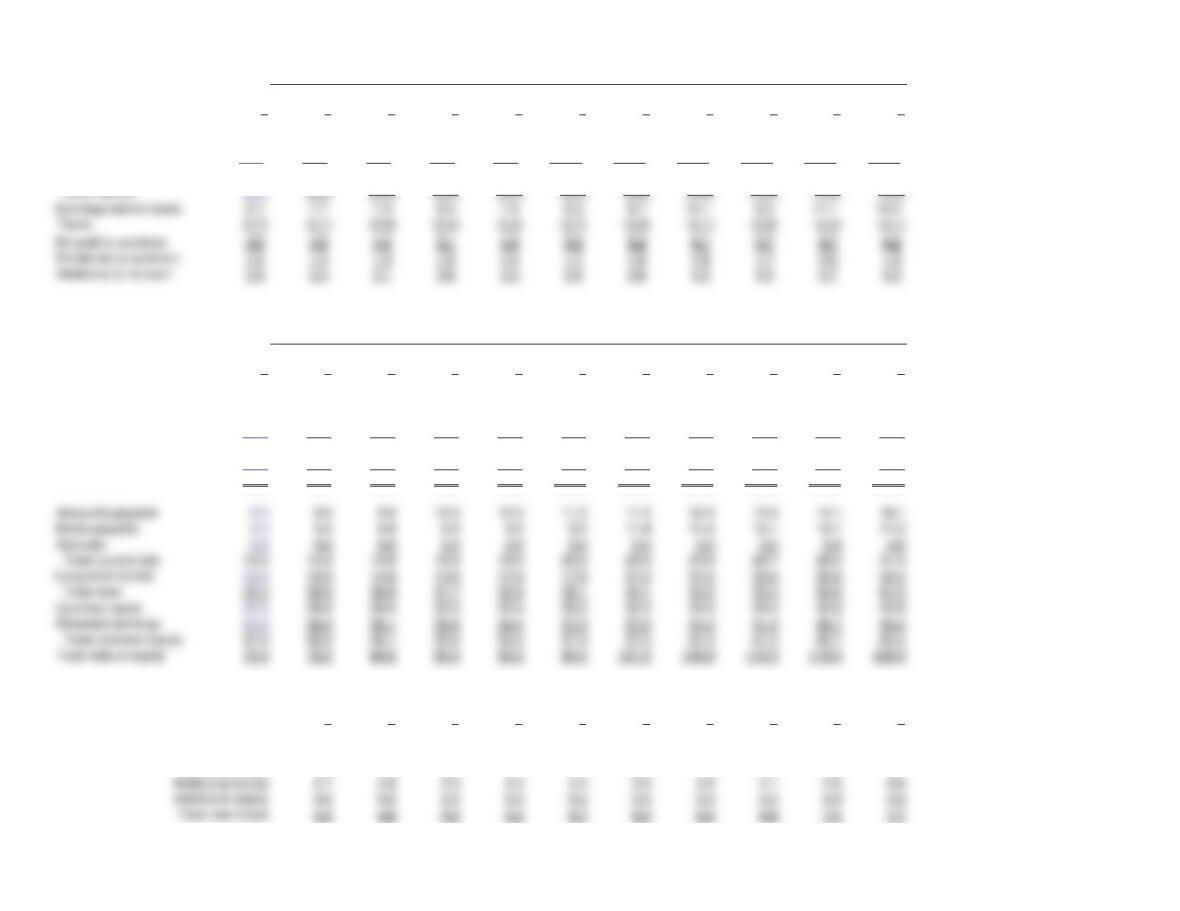
INCOME STATEMENT ($ millions)
Projected
Historical Initial Final Initial Final Initial Final Initial Final Initial Final
01122334455
Sales 80.0 89.6 89.6 100.4 100.4 112.4 112.4 125.9 125.9 141.0 141.0
Operating costs (71.3) (79.9) (79.9) (89.4) (89.4) (100.2) (100.2) (112.2) (112.2) (125.7) (125.7)
EBIT 8.7 9.7 9.7 10.9 10.9 12.2 12.2 13.7 13.7 15.3 15.3
Less interest (2.0) (2.0) (2.5) (2.5) (3.0) (3.0) (3.6) (3.6) (4.2) (4.2) (5.0)
BALANCE SHEET ($ millions)
Projected
Historical Initial Final Initial Final Initial Final Initial Final Initial Final
01122334455
Cash 4.0 4.5 4.5 5.0 5.0 5.6 5.6 6.3 6.3 7.0 7.0
Accounts receivable 12.0 13.4 13.4 15.1 15.1 16.9 16.9 18.9 18.9 21.1 21.1
Inventories 16.0 17.9 17.9 20.1 20.1 22.5 22.5 25.2 25.2 28.2 28.2
Tot current assets 32.0 35.8 35.8 40.1 40.1 45.0 45.0 50.4 50.4 56.4 56.4
Net plant and equip 40.0 44.8 44.8 50.2 50.2 56.2 56.2 62.9 62.9 70.5 70.5
Total assets 72.0 80.6 80.6 90.3 90.3 101.2 101.2 113.3 113.3 126.9 126.9
Initial Final Initial Final Initial Final Initial Final Initial Final
Additional Funds 1122334455
AFN 4.4 0.2 5.0 0.2 5.7 0.3 6.5 0.3 7.4 0.0
—– —– —– —– —– —– —– —– —– —–
Additional notes 1.8 1.8 2.0 2.1 2.3 2.4 2.6 2.7 3.0 3.1
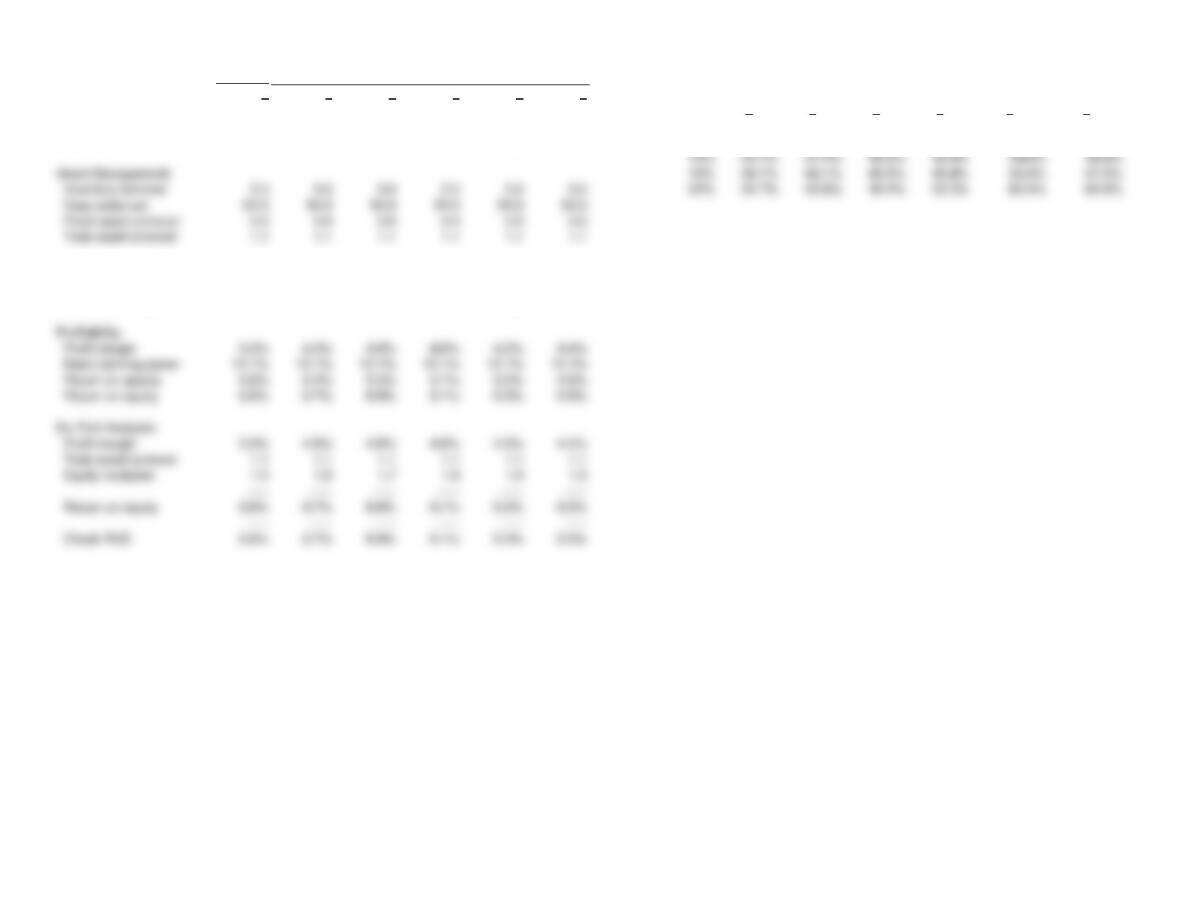
SELECTED HISTORICAL AND FORECASTED RATIOS
Page 2
C16
Historical Projected Data Table:
012345 Debt-to-assets
Liquidity: growth 0 1 2 3 4 5
Current 2.5 2.3 2.1 2.0 1.9 1.8 34.7% 37.9% 40.9% 43.6% 46.1% 48.5%
Quick 1.2 1.1 1.1 1.0 0.9 0.9 0% 34.7% 31.2% 27.6% 23.8% 19.9% 15.7%
Debt Management:
Debt ratio 34.7% 37.9% 40.9% 43.6% 46.1% 48.5%
Times int earned 4.4 4.0 3.7 3.4 3.2 3.1
Page 3
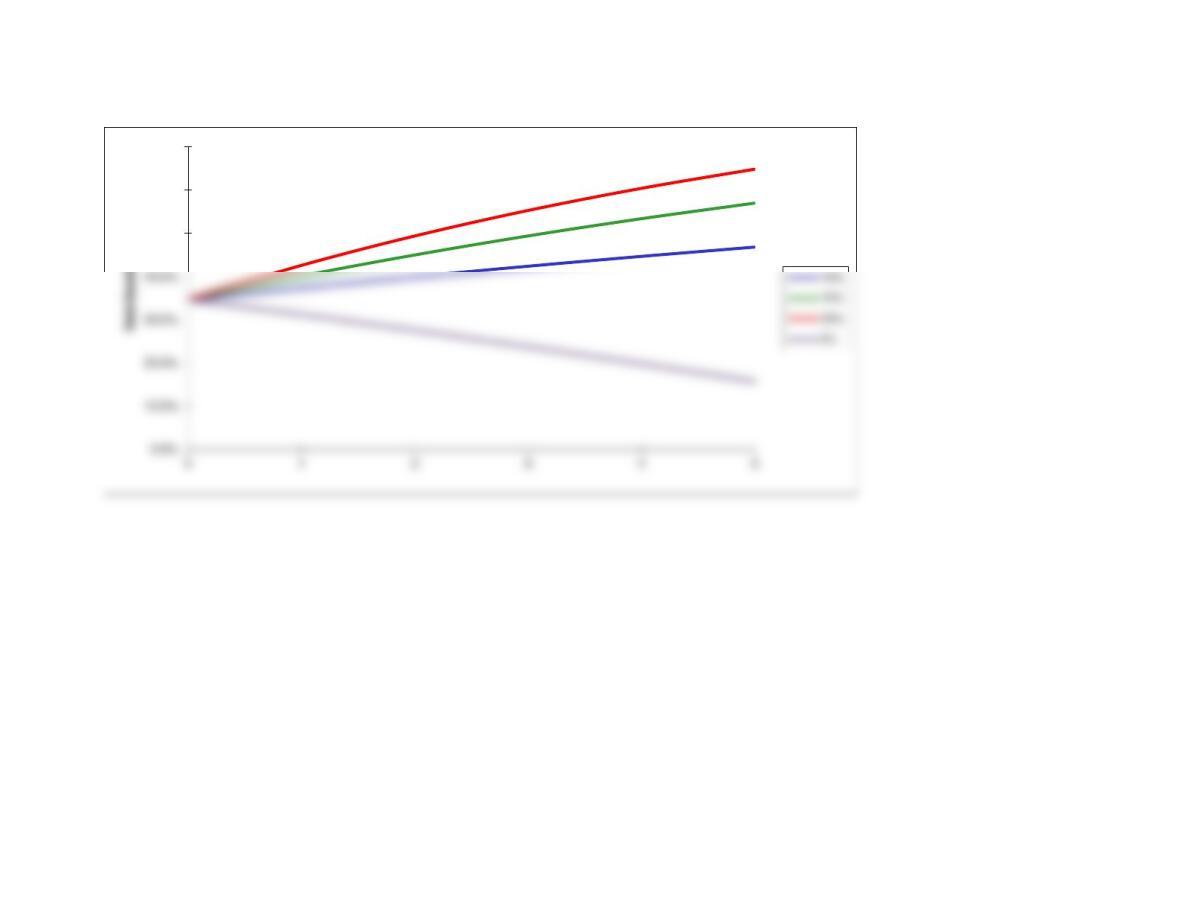
GRAPH
50.0%
60.0%
70.0%
Page 4
We have already entered the base case data for each model in this
file, and the models have performed the analysis for preceding parts
of the problem. You will need to enter the data for each of the
remaining parts of the problem–we indicate in each problem the parts
that should be done using the spreadsheet. However, there are several
points worth noting before you go into a model:
1. The input data are entered in specified cells in the INPUT DATA
section. When you change an input item, the model automatically
2. The key output data are displayed to the right of the INPUT DATA
3. Input data items that you can change are distinguished from the
4. All percentages must be entered as decimals. Dollars and other
numbers must be entered without dollar signs or commas.
5. Instructions and comments concerning specific models accompany
GENERAL INSTRUCTIONS FOR COMPUTERIZED PROBLEM SOLUTIONS