C16
INPUT DATA: KEY OUTPUT:
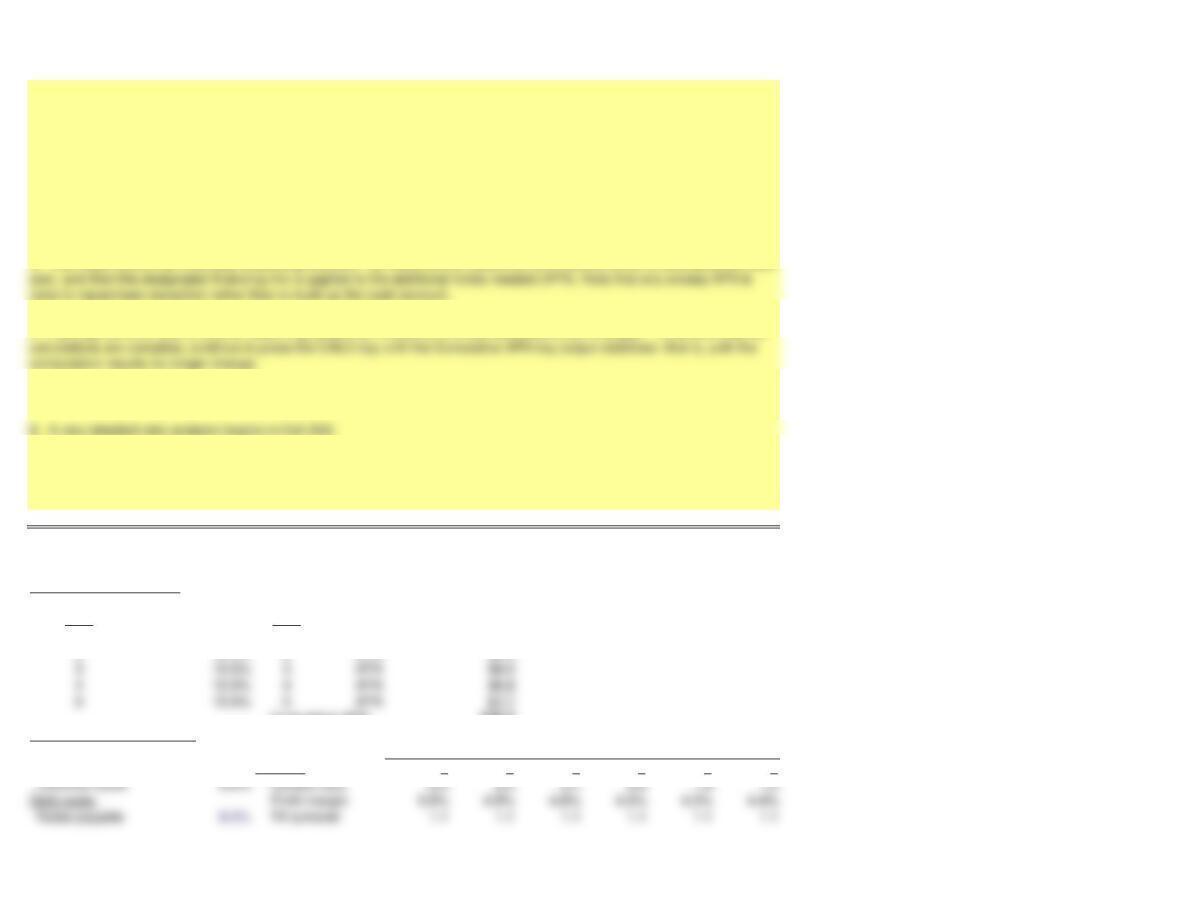
Forecasted sales growth:
Year Year
112.0% 1 AFN $4.6
Cumulative AFN $30.4
AFN financing percentages:
Notes payable 40.0%
Long-term bonds 60.0% Ratios: 0 1 2 3 4 5
Notes payable 8.0% TA turnover 1.1 1.1 1.1 1.1 1.1 1.1
Chapter 16 Spreadsheet Problem Solutions (C16)
computation results no longer change.
5. To view the forecasted income and balance sheet statements, make sure Cell A43 is at the top of your screen.
7. You can view a graph that shows how the debt-to-asset ratio changes over time at different sales growth rates by clicking
on the worksheet labeled GRAPH at the bottom of this spreadsheet. To return to this worksheet, click on the worksheet
labeled C08 at the bottom of the GRAPH worksheet.
Forecasting
Year
1. There are a number of instructions with which you should be familiar to use these computerized models. These
instructions appear in a separate worksheet labeled INSTRUCTIONS. If you have not already done so, you should read these
instructions now. To read these instructions, click on the worksheet labeled INSTRUCTIONS.
2. This model uses the projected balance sheet method to forecast five years of pro forma financial statements.
year, and then the designated financing mix is applied to the additional funds needed (AFN). Note that any excess AFN is
used to repurchase securities rather than to build up the cash account.
Page 1
C16
MODEL-GENERATED DATA:
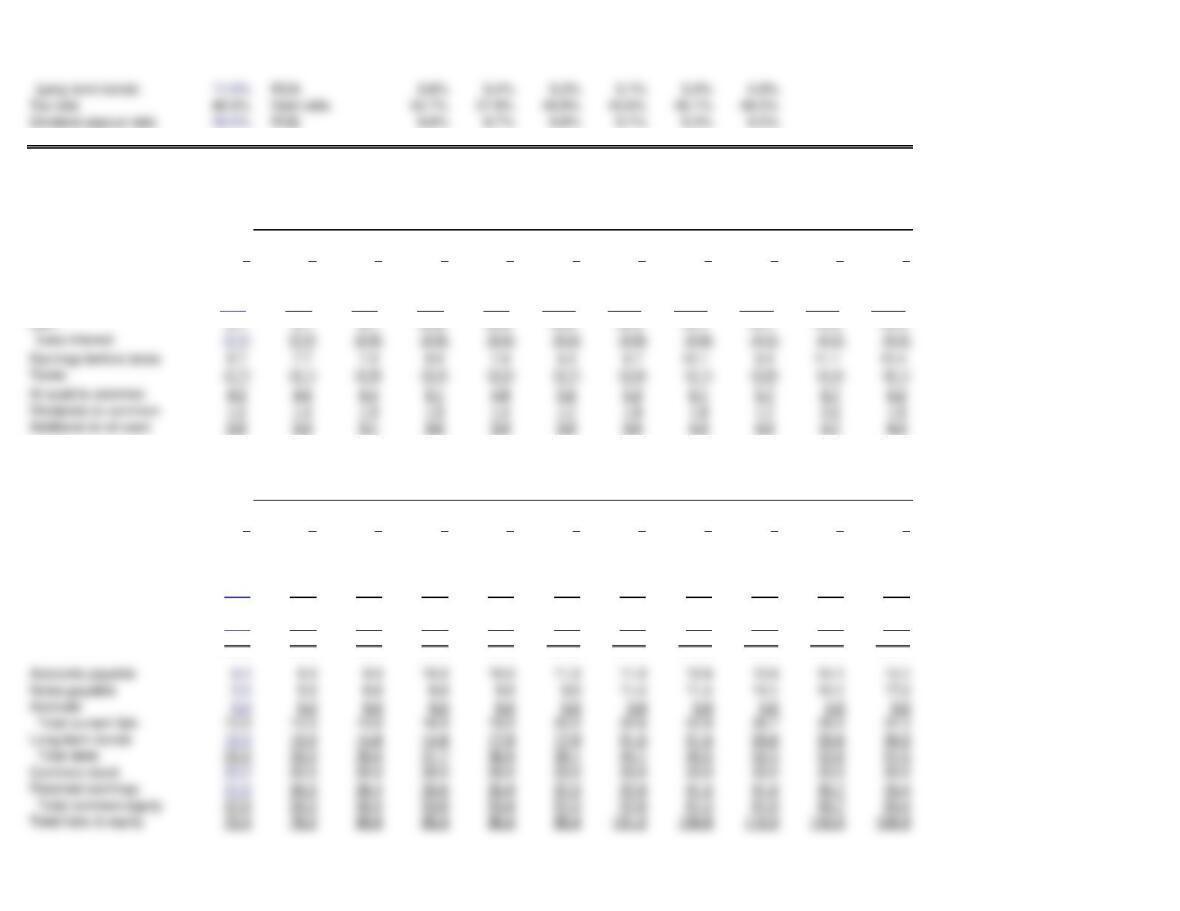
INCOME STATEMENT ($ millions)
Projected
Historical Initial Final Initial Final Initial Final Initial Final Initial Final
01122334455
Sales 80.0 89.6 89.6 100.4 100.4 112.4 112.4 125.9 125.9 141.0 141.0
Operating costs (71.3) (79.9) (79.9) (89.4) (89.4) (100.2) (100.2) (112.2) (112.2) (125.7) (125.7)
Less interest (2.0) (2.0) (2.5) (2.5) (3.0) (3.0) (3.6) (3.6) (4.2) (4.2) (5.0)
BALANCE SHEET ($ millions)
Projected
Historical Initial Final Initial Final Initial Final Initial Final Initial Final
01122334455
Cash 4.0 4.5 4.5 5.0 5.0 5.6 5.6 6.3 6.3 7.0 7.0
Accounts receivable 12.0 13.4 13.4 15.1 15.1 16.9 16.9 18.9 18.9 21.1 21.1
Inventories 16.0 17.9 17.9 20.1 20.1 22.5 22.5 25.2 25.2 28.2 28.2
Tot current assets 32.0 35.8 35.8 40.1 40.1 45.0 45.0 50.4 50.4 56.4 56.4
Net plant and equip 40.0 44.8 44.8 50.2 50.2 56.2 56.2 62.9 62.9 70.5 70.5
Total assets 72.0 80.6 80.6 90.3 90.3 101.2 101.2 113.3 113.3 126.9 126.9
Page 2
C16
Initial Final Initial Final Initial Final Initial Final Initial Final
Additional Funds 1 1 2 2 3 3 4 4 5 5
AFN 4.4 0.2 5.0 0.2 5.7 0.3 6.5 0.3 7.4 0.0
—– —– —– —– —– —– —– —– —– —–
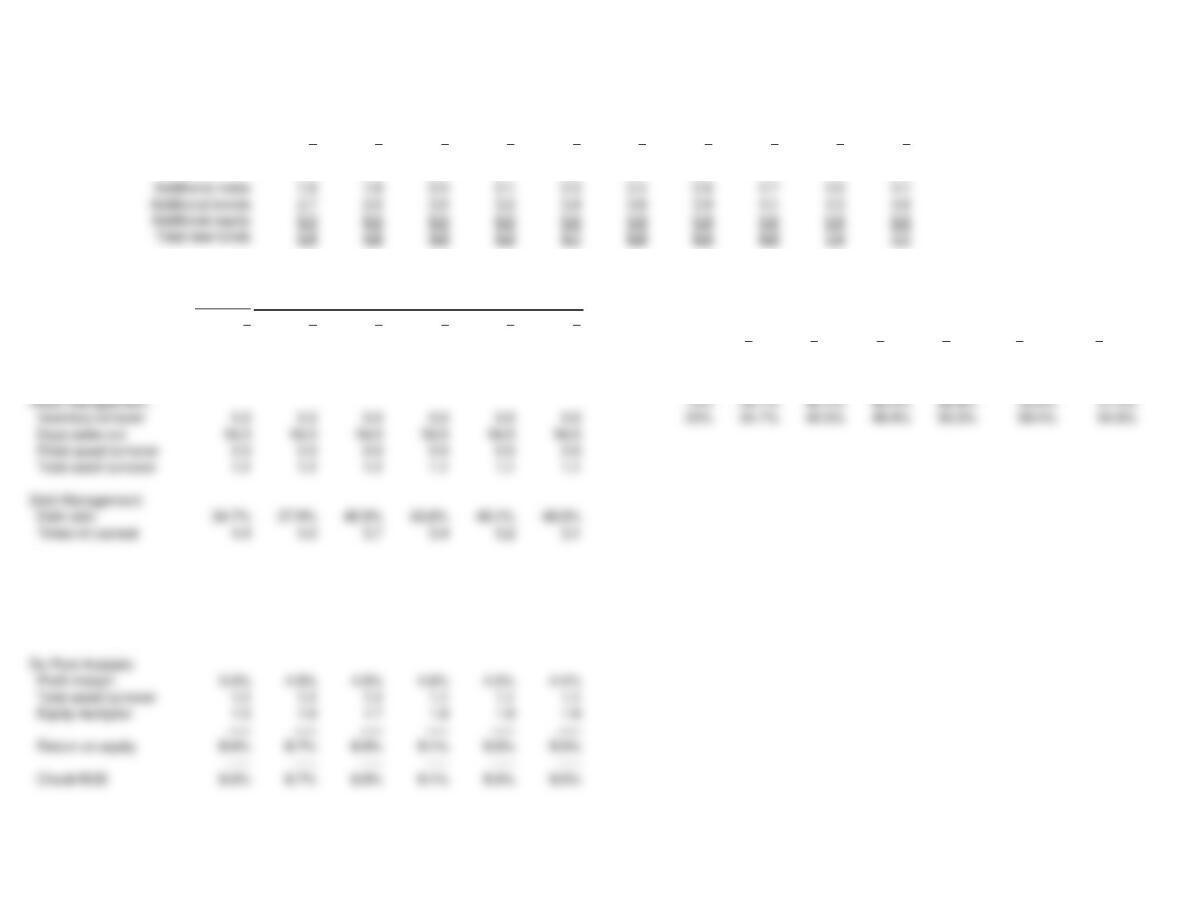
SELECTED HISTORICAL AND FORECASTED RATIOS
Historical Projected Data Table:
0 1 2 3 4 5 Debt-to-assets
Liquidity: growth 0 1 2 3 4 5
Current 2.5 2.3 2.1 2.0 1.9 1.8 34.7% 37.9% 40.9% 43.6% 46.1% 48.5%
Quick 1.2 1.1 1.1 1.0 0.9 0.9 0% 34.7% 31.2% 27.6% 23.8% 19.9% 15.7%
10% 34.7% 37.4% 40.0% 42.4% 44.6% 46.8%
Profitability:
Profit margin 5.0% 4.9% 4.8% 4.6% 4.5% 4.4%
Basic earning power 12.1% 12.1% 12.1% 12.1% 12.1% 12.1%
Return on assets 5.6% 5.4% 5.3% 5.1% 5.0% 4.9%
Return on equity 8.6% 8.7% 8.9% 9.1% 9.3% 9.5%
Page 3
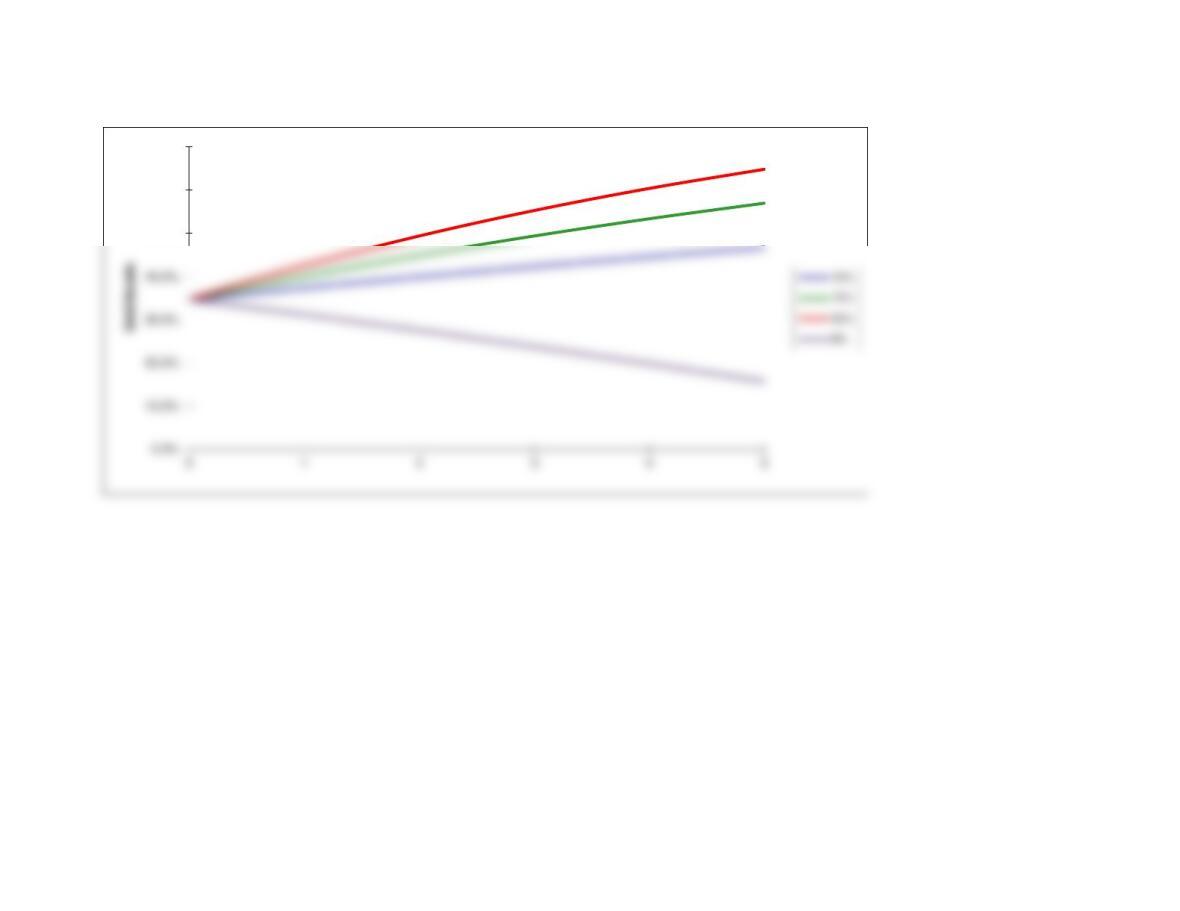
GRAPH
50.0%
60.0%
70.0%
Page 4
We have already entered the base case data for each model in this
file, and the models have performed the analysis for preceding parts
of the problem. You will need to enter the data for each of the
remaining parts of the problem–we indicate in each problem the parts
that should be done using the spreadsheet. However, there are several
points worth noting before you go into a model:
1. The input data are entered in specified cells in the INPUT DATA
section. When you change an input item, the model automatically
2. The key output data are displayed to the right of the INPUT DATA
3. Input data items that you can change are distinguished from the
ones you should not change. The items that you can change are
highlighted in color (blue) whereas the other items are printed in black.
5. Instructions and comments concerning specific models accompany
GENERAL INSTRUCTIONS FOR COMPUTERIZED PROBLEM SOLUTIONS