Chapter 15 Spreadsheet-Related Problem Solution (C15B)
INPUT DATA:
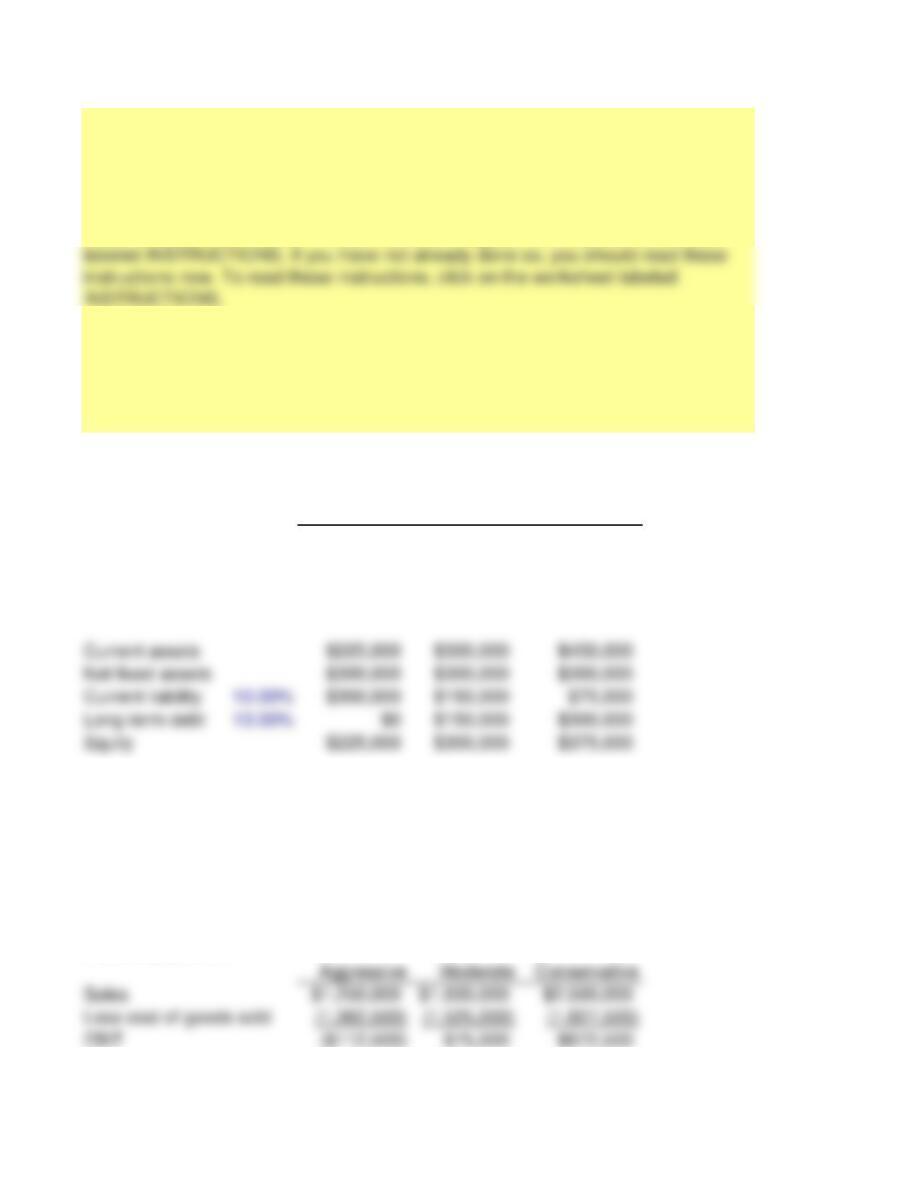
Aggressive Moderate Conservative
Sales $1,250,000 $1,600,000 $2,500,000
Fixed costs $300,000 $405,000 $577,500
Variable costs 0.85 0.70 0.50
Tax rate 40.00% 40.00% 40.00%
KEY OUTPUT:
Current ratio 0.75 2.00 6.00
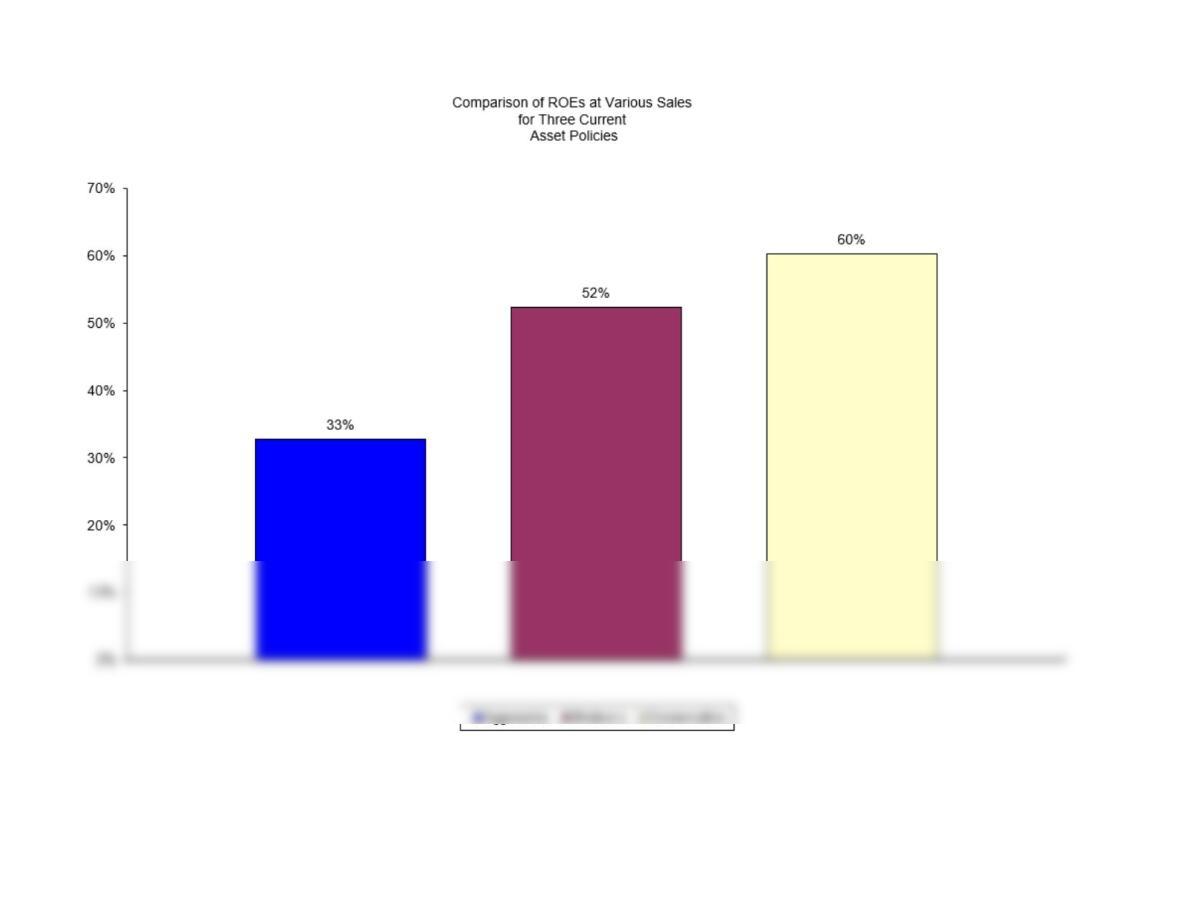
Return on equity -38.0% 8.1% 100.2%
MODEL-GENERATED DATA:
Income Statement
Working Capital Financing
1. There are a number of instructions with which you should be familiar to use
these computerized models. These instructions appear in a separate worksheet
2. A graph that compares the ROEs produced by the working capital policies will be
displayed if you click the worksheet labeled GRAPH at the bottom of this
spreadsheet. To return to this worksheet, click on the worksheet labeled C15B at
the bottom of the GRAPH worksheet.

We have already entered the base case data for each model in this
file, and the models have performed the analysis for preceding parts
of the problem. You will need to enter the data for each of the
remaining parts of the problem–we indicate in each problem the parts
that should be done using the spreadsheet. However, there are several
points worth noting before you go into a model:
1. The input data are entered in specified cells in the INPUT DATA
section. When you change an input item, the model automatically
2. The key output data are displayed to the right of the INPUT DATA
3. Input data items that you can change are distinguished from the
4. All percentages must be entered as decimals. Dollars and other
numbers must be entered without dollar signs or commas.
5. Instructions and comments concerning specific models accompany
GENERAL INSTRUCTIONS FOR COMPUTERIZED PROBLEM SOLUTIONS