Chapter 15 Spreadsheet Problem Solutions (C15)
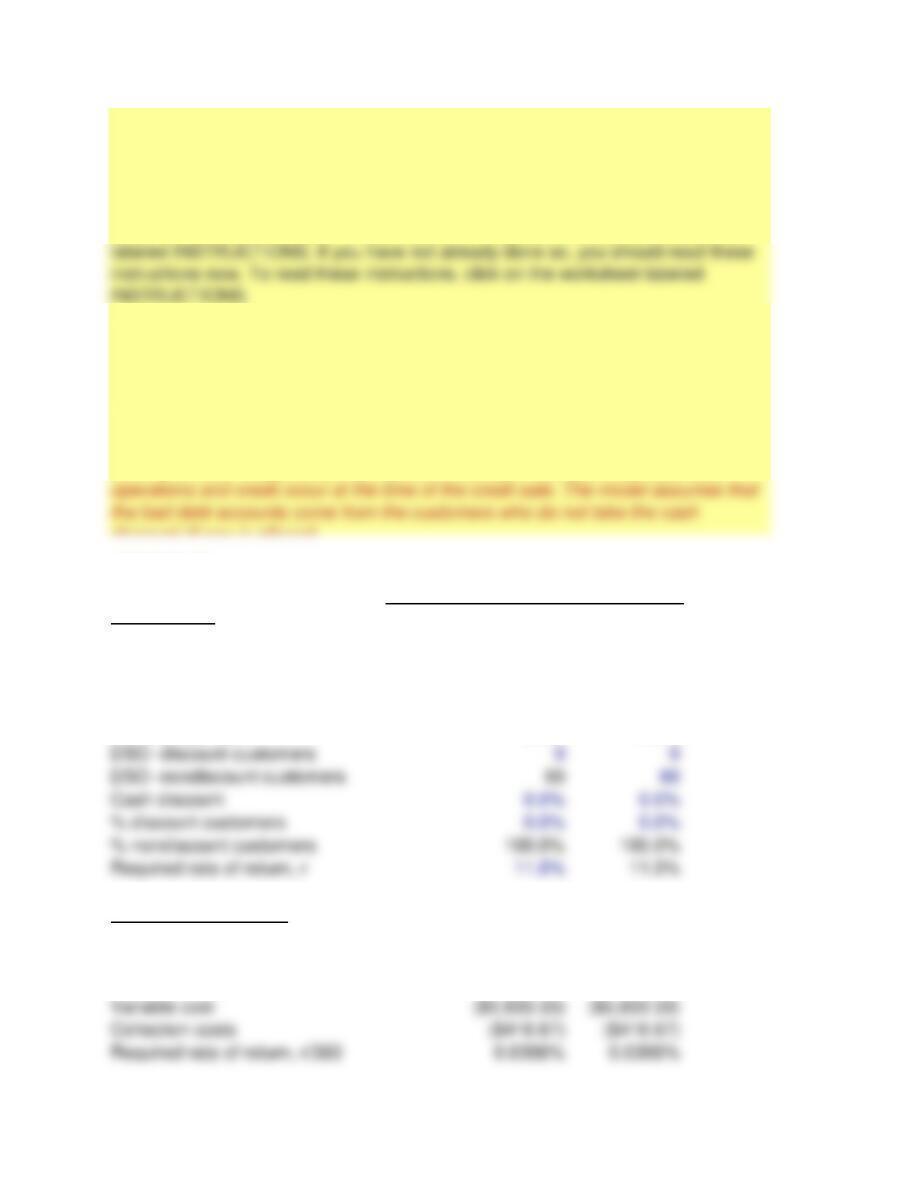
INPUT DATA:
Old New
Annual Data:
Sales $3,000,000 $3,000,000
Variable cost ratio 70.0% 70.0%
Variable cost $2,100,000 $2,100,000
Collection costs $150,000 $150,000
Bad debt percent 5.0% 5.0%
Daily Data (360 days):
Sales $8,333.33 $8,333.33
Collection–discount cust. $0.00 $0.00
Collection–nondiscount cust. $7,916.67 $7,916.67
Analyzing Credit Terms
NOTE: This spreadsheet can also be used to solve for credit policies that include
cash discounts. The primary assumption is that cash outflows associated with
1. There are a number of instructions with which you should be familiar to use
these computerized models. These instructions appear in a separate worksheet
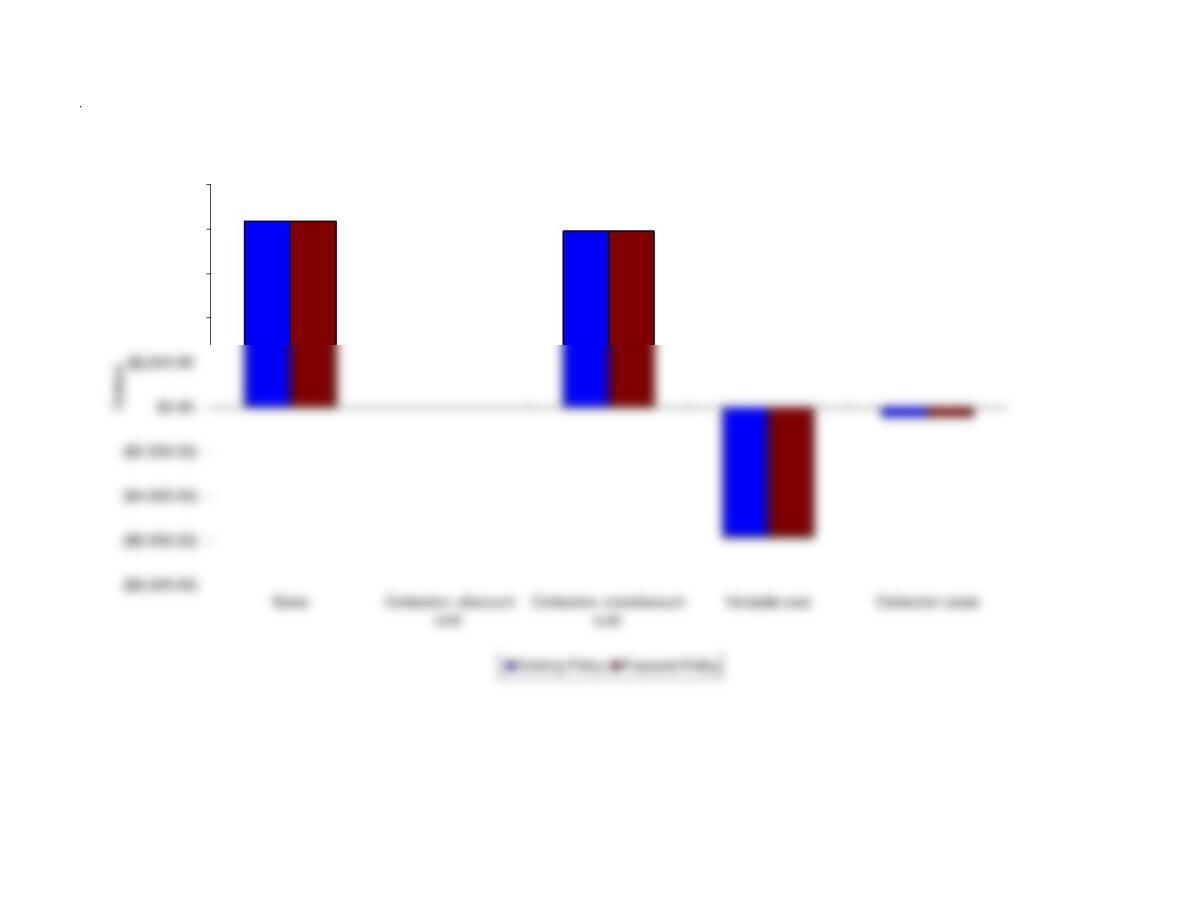
2. A graph that compares the proposed credit policy with the existing credit policy
will be displayed if you click on the worksheet labeled CREDIT POLICIES at the
bottom of this worksheet.
KEY OUTPUT:
Net present value $1,522.87 $1,522.87
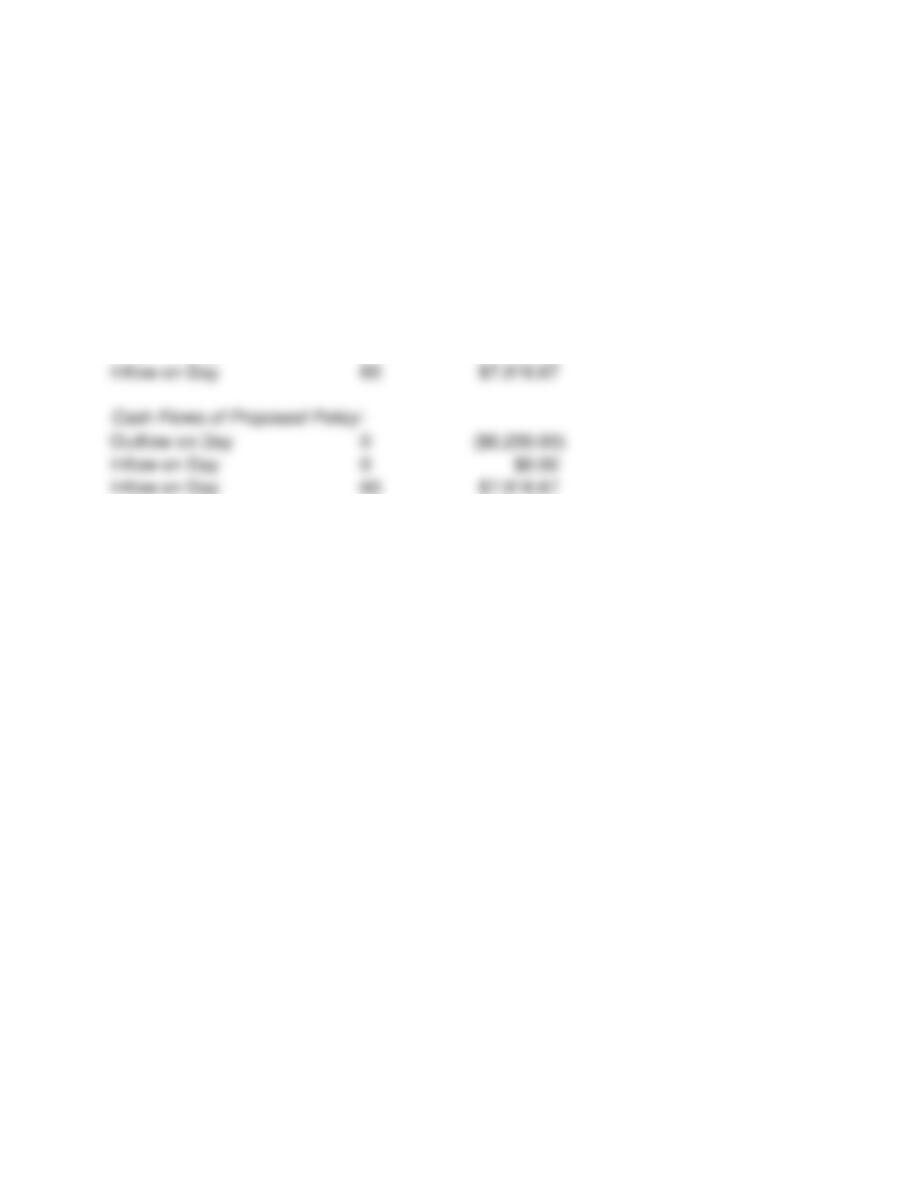
MODEL GENERATED DATA:
Cash Flows of Existing Policy:
Outflow on Day 0 ($6,250.00)
Inflow on Day 0 $0.00
C
$4,000.00
$6,000.00
$8,000.00
$10,000.00
Comparison of Credit Policies

We have already entered the base case data for each model in this
file, and the models have performed the analysis for preceding parts
of the problem. You will need to enter the data for each of the
remaining parts of the problem–we indicate in each problem the parts
that should be done using the spreadsheet. However, there are several
points worth noting before you go into a model:
1. The input data are entered in specified cells in the INPUT DATA
section. When you change an input item, the model automatically
2. The key output data are displayed to the right of the INPUT DATA
3. Input data items that you can change are distinguished from the
4. All percentages must be entered as decimals. Dollars and other
numbers must be entered without dollar signs or commas.
5. Instructions and comments concerning specific models accompany
GENERAL INSTRUCTIONS FOR COMPUTERIZED PROBLEM SOLUTIONS