1
2
3
4
5
6
7
8
14
15
16
17
18
19
20
21
22
23
24
25
26
27
28
29
30
31
40
41
42
43
44
45
46
47
48
49
50
51
62
63
64
65
66
67
68
69
70
77
78
Tax Rate 25% 25%
79
80
A B C D E F G H I J K L
11/21/2018
Situation
Input Data
Percent Financed
with debt, wdrd
0% 0.0%
20% 8.0%
30% 8.5%
40% 10.0%
50% 12.0%
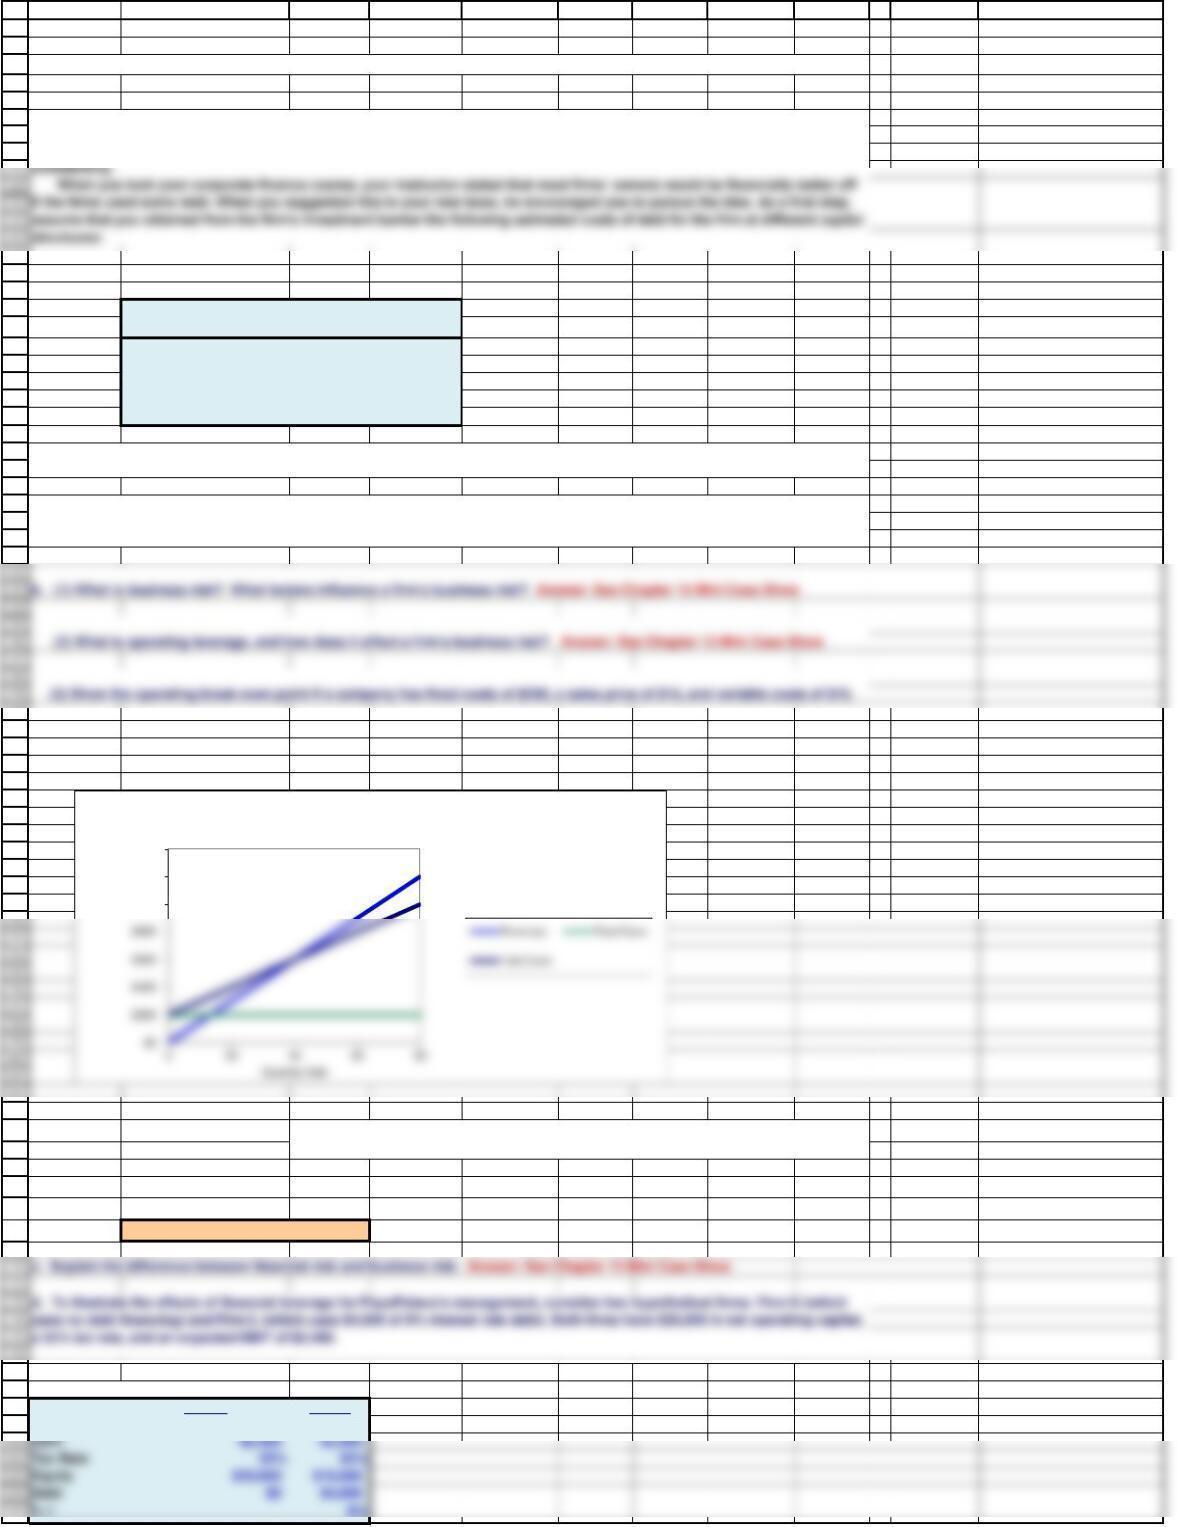
F = $200 QRevenues
Fixed Costs
Total Costs
P = $15 0$0 $200 $200
V = $10 80 $1,200 $200 $1,000
Q BE = FC / (P – VC)
Q BE = F÷(P – VC)
Q BE = $200 ÷$15.00 – $10.00
Q BE = 40 Units.
Two Hypothetical Firms
Firm U Firm L
Capital $20,000 $20,000
Chapter 15. Mini Case
If the company were to recapitalize, debt would be issued, and the funds received would be used to repurchase stock.
a. Using the free cash flow valuation model, show the only avenues by which capital structure can affect value.. Answer: See
Chapter 15 Mini Case Show
In words, the quantity at which a firm breaks even is found as the difference between
Price and Variable costs divided by Fixed costs.
Assume you have just been hired as a business manager of PizzaPalace, a regional pizza restaurant chain. The company’s EBIT
was $120 million last year and is not expected to grow. Pizza Palace is in the 25% state-plus-federal tax bracket, the risk-free rate
is 6 percent, and the market risk premium is 6 percent. The firm is currently financed with all equity and it has 10 million shares
$1,000
$1,200
$1,400
Operating Leverage
86
87
88
89
90
91
92
97
98
99
100
101
108
109
110
111
112
113
114
115
116
117
127
128
129
130
131
132
133
139
140
141
142
143
h. With the above points in mind, now consider the optimal capital structure for PizzaPalace.
g. What does does the empirical evidence say about capital structure theory? What are the implications for managers?
149
150
151
152
153
154
155
156
157
158
159
160
167
168
169
170
A B C D E F G H I J K L
Impact of Leverage
Firm U Firm L Distribution to Investors
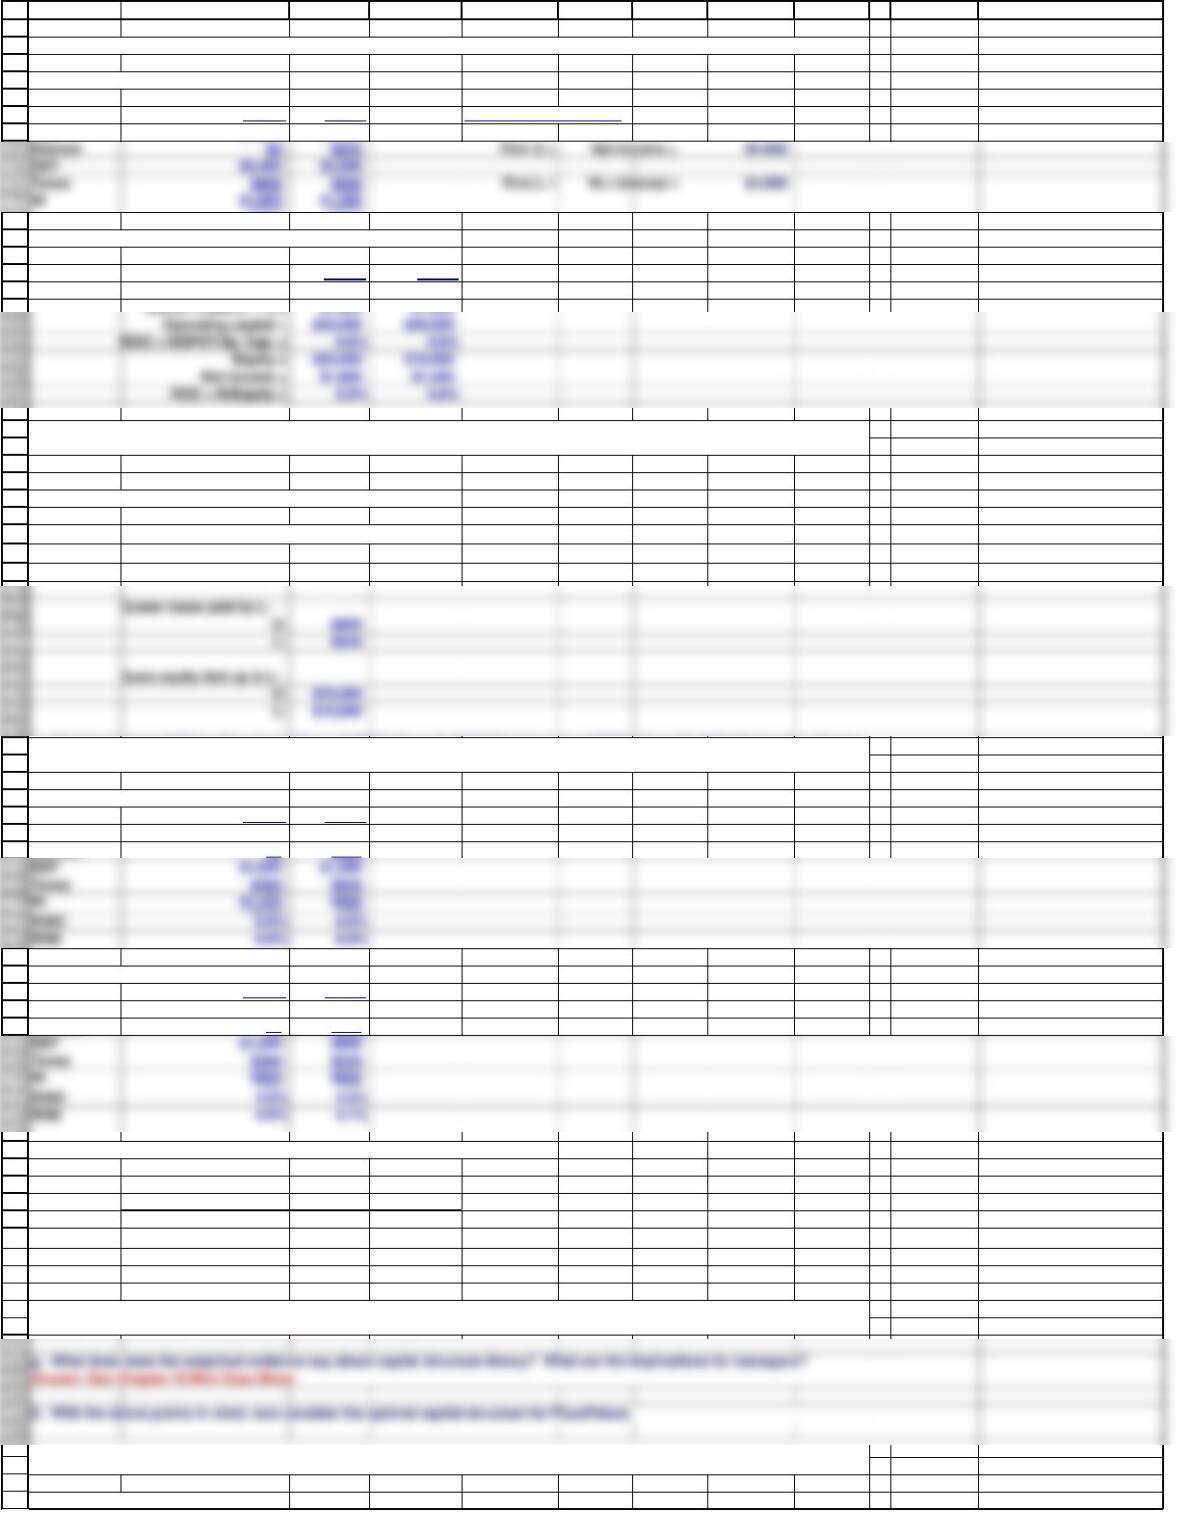
EBIT $2,400 $2,400
(2) Calculate NOPAT, ROIC, and ROE for both firms.
xFirm U Firm L
EBIT = $2,400 $2,400
(4) Why did leverage increase ROE in this example?
More total dollars paid to L’s investors:
U: NI = $1,800
L: NI + Int = $1,880
If EBIT = $1,200:
Firm U Firm L
EBIT $1,600 $1,600
Interest $0 $320
If EBIT = $1,600:
Firm U Firm L
EBIT $1,200 $1,200
Interest $0 $320
Leverage only adds value if ROIC is greater than the after-tax cost of debt.
EBIT EBIT EBIT
$2,400 $1,600 $1,200
ROIC 9.0% 6.0% 4.5%
rd(1-T) 6.0% 6.0% 6.0%
ROE 9.8% 6.0% 4.1%
Data for Recapitalization
f. What does capital structure theory attempt to do? What lessons can be learned from capital structure theory? Be sure to
address the MM models. Answer: See Chapter 15 Mini Case Show
e. What happens to ROE for Firm U and Firm L if EBIT falls to $1,600? What happens if EBIT falls to $1,200? What is the after-tax
cost of debt? What does this imply about the impact of leverage on risk and return?
(1) Construct partial income statements, which start with EBIT, for the two firms.
(1) For each capital structure under consideration, calculate the levered beta, the cost of equity, and the WACC.
(3) What does this example illustrate about the impact of financial leverage on ROE? Answer: See Chapter 15 Mini Case Show
Interest $0 $320 Firm U = $1,800
171
172
173
179
180
181
182
183
184
185
186
187
188
189
191
193
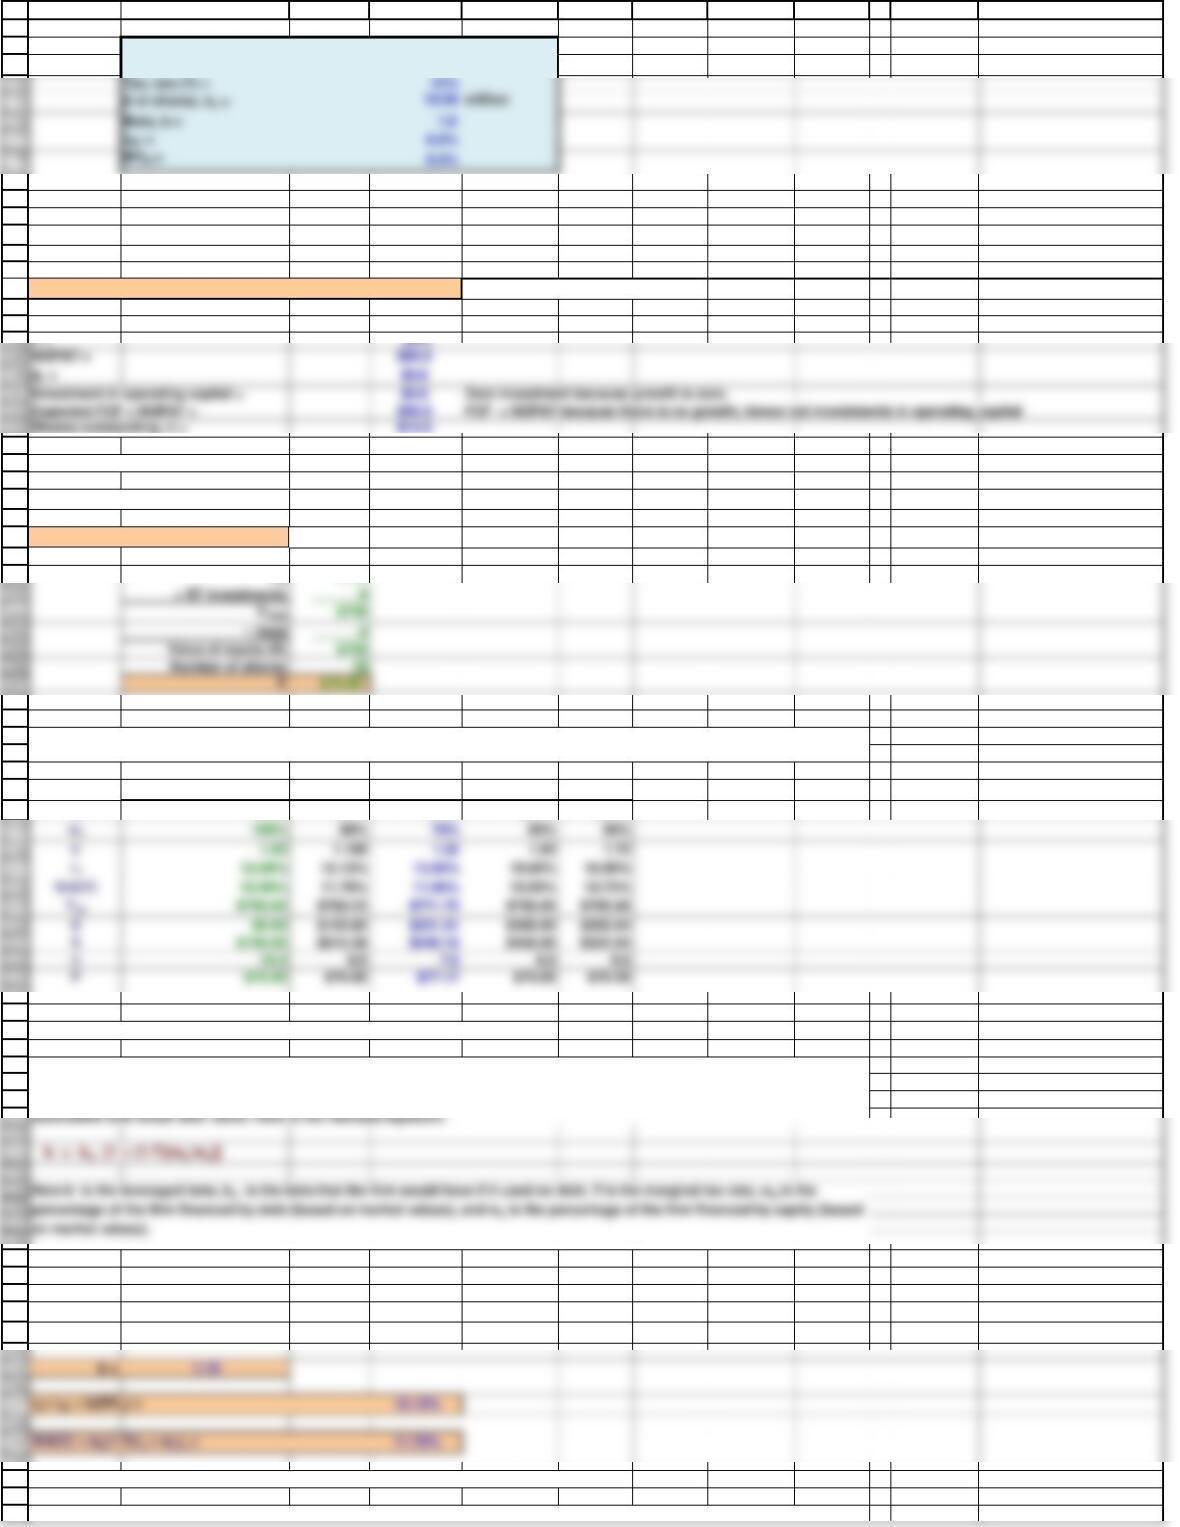
T = 25%
NOPAT = $90.0
gL = $0.0
Investment in operating capital = $0.0 Zero investment because growth is zero.
Expected FCF = NOPAT = $90.0 FCF = NOPAT because there is no growth, hence not investments in operating capital
Shares outstanding, n = $10.0
ws100% 80% 70% 60% 50%
rs12.00% 13.13% 13.93% 15.00% 16.50%
194
195
196
197
198
199
200
201
208
209
210
211
212
213
214
224
225
226
227
228
235
236
associated with those debt ratios. Here is the Hamada equation:
229
230
rs= rRF + b(RPM) = 13.13%
238
239
240
241
242
243
250
251
252
253
A B C D E F G H I J K L
EBIT = $120 million
gL = 0%
Beta, b = 1.0
rRF = 6.0%
RPM = 6.0%
WACC = rs= rRF + b(RPM) = 12.00% WACC = rs because there is not debt
EBIT = $120.0
Current Valuation
Vop = [FCF(1+gL)]/(WACC-gL)
Vop = $750.00
Vop $750
wd0% 20% 30% 40% 50%
rd0.0% 8.0% 8.5% 10.0% 12.0%
Estimating the Cost of Equity for Different Capital Structures
For example:
wd = 20%
ws = 80%
The betas, cost of equity, and WACC at each debt level are shown in the table above.
Investment bankers provided estimates of the cost of debt for different capital structures, as shown below. Other rows are
explained below the table.
(2) Now calculate the corporate value, the value of the debt that will be issued, and the resulting market value of equity.
Hamada developed his equation by merging the CAPM with the Modigliani-Miller model. We use the model to determine beta at
different amount of financial leverage, and then use the betas associated with different debt ratios to find the cost of equity
Tax rate (T) = 25%