
11/21/2018
Situation
Net Income
$140.00
Target equity ratio 80%
Total capital budget
$112.50
Number of shares 100
Distribution = Net Income – [(Target equity ratio) * (Total capital budget)]
Capital budget
$112.50
$90
Distributions paid (NI – Required equity) $50
Dividend per share $0.50
What would happen to the payout ratio and DPS if net income were forecasted to decrease to $90 million?
Net Income
$90.00
Capital budget
$112.50
Net income
$90
Required equity (Equity ratio X Capital budget)
$90
Distributions paid (NI – Required equity) $0
Payout ratio (Dividend/NI)
0.00%
Dividend per share $0.00
What would happen to the payout ratio and DPS if net income were forecasted to increase to $160 million?
$160.00
$112.50
$90
Distributions paid (NI – Required equity) $70
Dividend per share $0.70
(2.) The terms “irrelevance,” “dividend prefernce, or bird-in-the-hand,” and “tax effect” have been used to describe three major
theories regarding the way dividend payouts affect a firm’s value. Explain what these terms mean, and briefly describe each theory.
Answer: See Chapter 14 Mini Case Show
(4.) What results have empirical studies of the dividend theories produced? How does all this affect what we can tell managers
b. Discuss (1) the clientele effect, (2) the information content, or signaling, hypothesis, and (3) their effects on dividend policy.
Answer: See Chapter 14 Mini Case Show
Chapter 14. Mini Case
Your new boss at the consulting firm Flick and Associates, which has been retained to help IWT prepare for its public offering, has
asked you to make a presentation to Jackson and Smithfield in which you review the theory of dividend policy and discuss the
following issues.
(3.) What do the three theories indicate regarding the actions management should take with respect to dividend payouts? Answer:
See Chapter 14 Mini Case Show
a. (1.) What is meant by the term “distribution policy”? How have dividend payouts versus stock repurchases changed over time?
Answer: See Chapter 14 Mini Case Show
Integrated Waveguide Technologies (IWT) is a 6-year old company founded by Hunt Jackson and David Smithfield to exploit
metamaterial plasmonic technology to develop and manufacture miniature microwave frequency directional transmitters and
receivers for use in mobile Internet and communications applications. The technology, although highly-advanced, is relatively
inexpensive to implement and their patented manufacturing techniques require little capital in comparison to many electronics
fabrication ventures. Because of the low capital requirement, Jackson and Smithfield have been able to avoid issuing new stock and
thus own all of the shares. Because of the explosion in demand for its mobile Internet applications, IWT must now access outside
equity capital to fund its growth and Jackson and Smithfield have decided to take the company public. Until now, Jackson and
Smithfield have paid themselves reasonable salaries but routinely reinvested all after-tax earnings in the firm, so dividend policy has
not been an issue. However, before talking with potential outside investors, they must decide on a dividend policy.
c. (1.) Assume that IWT has a $112.5 million capital budget planned for the coming year. You have determined its present capital
structure (80% equity and 20% debt) is optimal, and its net income is forecasted at $140 million. Use the residual distribution model
approach to determine IWT’s total dollar distribution. Assume for now that the distribution is in the form of a dividend. IWT has 100
million shares. What is the forecasted dividend payout ratio? What is the forecasted dividend per share?

Inputs
Value of operations
d. (1.) Describe the procedures a company follows when it make a distribution through dividend payments. Answer: See Chapter 14
Mini Case Show
$1,937.50
Short-term investments
$50.00
Debt
$387.50
Number of shares
100.00
Value of operations $1,937.50
+ Value of nonoperating assets 50.00
Total intrinsic value of firm $1,987.50
− Debt 387.50
Intrinsic value of equity $1,600.00
÷ Number of shares 100.00
Intrinsic price per share $16.00
Value of operations $1,937.50 $1,937.50
+ Value of nonoperating assets 50.00 0.00
− Debt 387.50 387.50
÷ Number of shares 100.00 100.00
Value of operations $1,937.50 $1,937.50
f. (3.) Suppose instead that IWT has just made the $50 million distribution in the form of a stock repurchase. Now what is IWT’s
intrinsic value of equity? How many shares did IWT repurchase? How many shares remained outstanding after the repurchase? What
is its intrinsic per share stock price after the repurchase?
c. (2.) In general terms, how would a change in investment opportunities affect the payout ratio under the residual payment policy?
Answer: See Chapter 14 Mini Case Show
e. What are stock repurchases? Discuss the advantages and disadvantages of a firm‘s repurchasing its own shares. Answer: See
Chapter 14 Mini Case Show
d. (2.) What is a stock repurchase? Describe the procedures a company follows when it make a distribution through a stock
repurchase. Answer: See Chapter 14 Mini Case Show
If Distributed
as Dividend
Prior to
Distribution
f. (1.) Assume that IWT has not yet made the distribution. What is IWT’s intrinsic value of equity? What is its intrinsic per share stock
price?
Prior to
Distribution
f. (2.) Now suppose that IWT has just made the $50 million distribution in the form of dividends. What is IWT’s intrinsic value of
equity? What is its intrinsic per share stock price?
c. (3.) What are the advantages and disadvantages of the residual policy? (Hint: Don’t neglect signaling and clientele effects.
Answer: See Chapter 14 Mini Case Show
If Distributed
as Repurchase
f. Suppose IWT has decided to distribute $50 million, which it presently is holding in very liquid short-term investments. IWT’s value
of operations is estimated to be about $1,937.5 million. IWT has $387.5 million in debt (it has no preferred stock). As mentioned
previously, IWT has 100 million shares of stock outstanding.
Prior to
Distribution
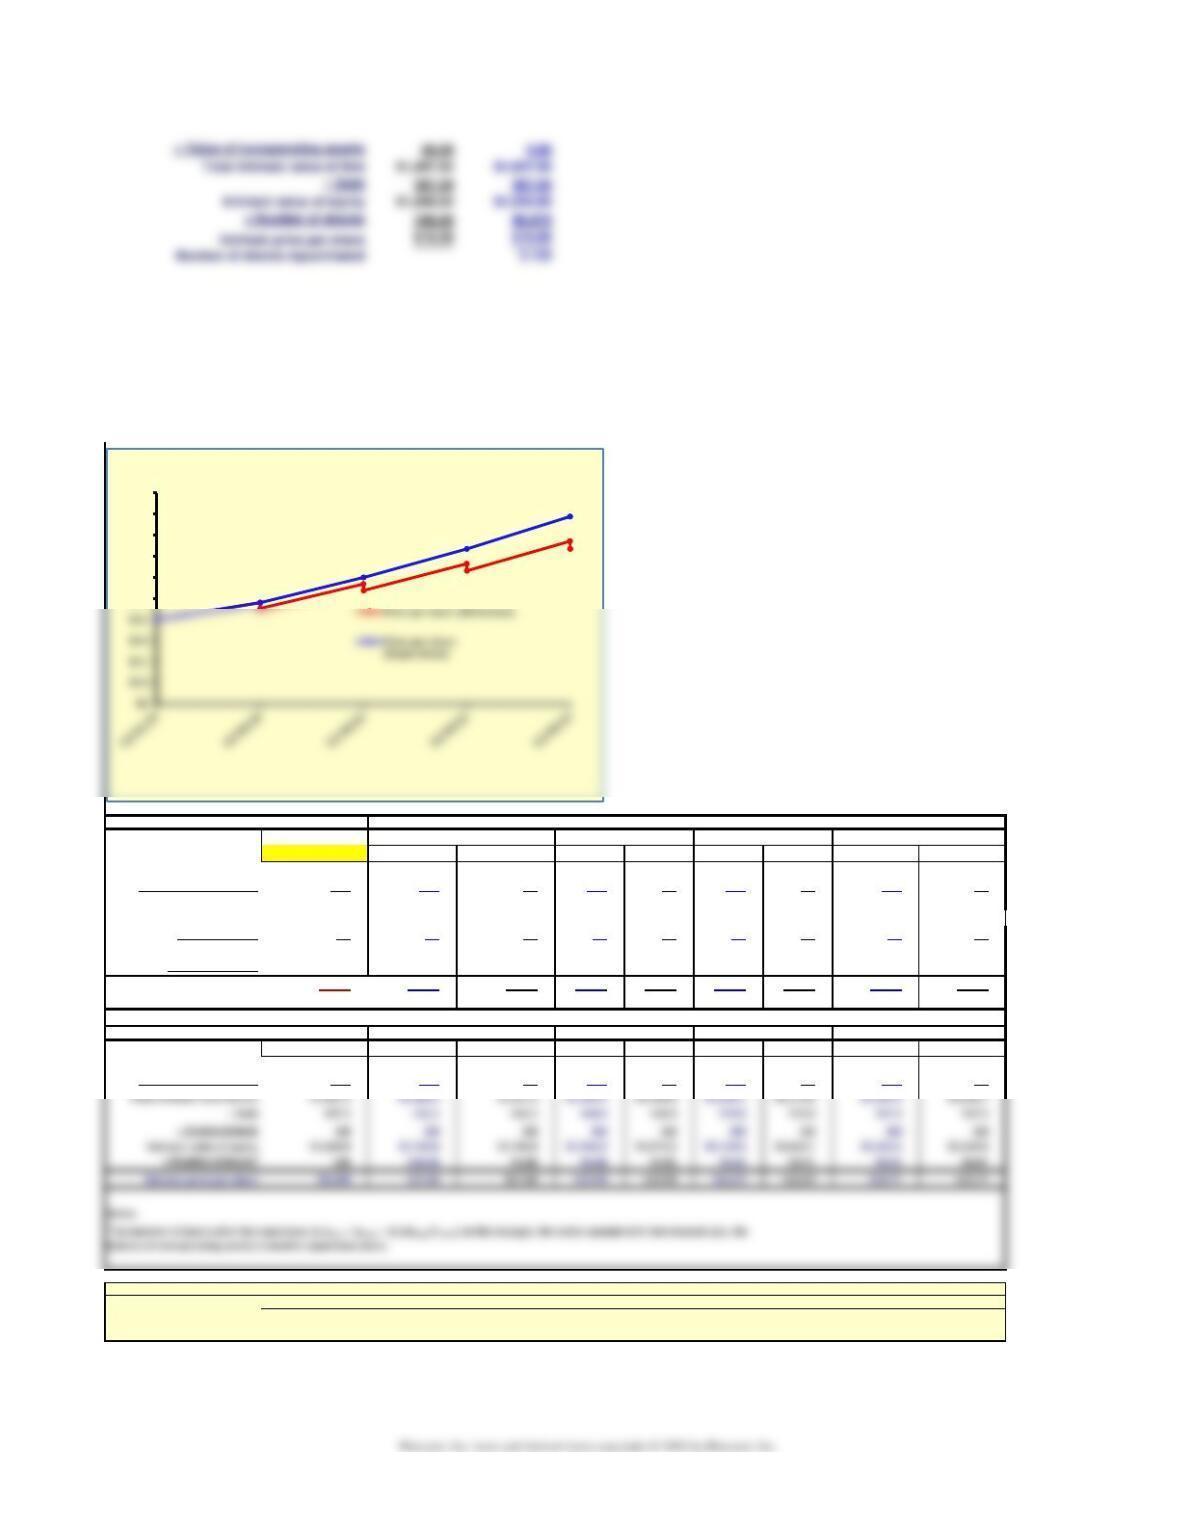
Suppose the value of operations, available funds for distribution, and debt increase at 10% a year. Here is the impact of repurchases versus dividends.
Growth in value of operations: 10%
Growth in distributions: 10%
Growth in debt: 10%
Stock prices over time:
1. Distribute as Dividends
12/31/2019 12/30 12/31 12/30 12/31 12/30 12/31 12/30 12/31
Value of operations $1,937.5 $2,131.3 $2,131.3 $2,344.4 $2,344.4 $2,578.8 $2,578.8 $2,836.7 $2,836.7
+ Value of ST investments 50.0 55.0 0.0 60.5 0.0 66.6 0.0 73.2 0.0
Total intrinsic value of firm $1,987.5 $2,186.3 $2,131.3 $2,404.9 $2,344.4 $2,645.4 $2,578.8 $2,909.9 $2,836.7
− Debt 387.5 426.3 426.3 468.9 468.9 515.8 515.8 567.3 567.3
− Preferred stock 0.0 0.0 0.0 0.0 0.0 0.0 0.0 0.0 0.0
Intrinsic value of equity $1,600.0 $1,760.0 $1,705.0 $1,936.0 $1,875.5 $2,129.6 $2,063.1 $2,342.6 $2,269.4
÷ Number of shares 100 100 100 100 100 100 100 100 100
Intrinsic price per share $16.00 $17.60 $17.05 $19.36 $18.76 $21.30 $20.63 $23.43 $22.69
Dividend per share $0.55 $0.61 $0.67 $0.73
Section 2. Distribute as Repurchase
12/31/19 12/30 12/31 12/30 12/31 12/30 12/31 12/30 12/31
Value of operations $1,937.5 $2,131.3 $2,131.3 $2,344.4 $2,344.4 $2,578.8 $2,578.8 $2,836.7 $2,836.7
+ Value of ST investments 50.0 55.0 0.0 60.5 0.0 66.6 0.0 73.2 0.0
Data for figure.
End of Month 12/31/19 12/30/20 12/31/20 12/30/21 12/31/21 12/30/22 12/31/22 12/30/23 12/31/23
Price per share (Dividends) $16.00 $17.60 $17.05 $19.36 $18.76 $21.30 $20.63 $23.43 $22.69
Price per share (Repurchase) $16.00 $17.60 $17.60 $19.98 $19.98 $22.69 $22.69 $25.77 $25.77
2020
2021
2022
2023
2020
2021
2022
2023
Projected
$18
$20
$22
$24
$26
$28 Stock
Price

g. Describe the series of steps that most firms take in setting dividend policy in practice. Answer: See Chapter 14 Mini Case Show