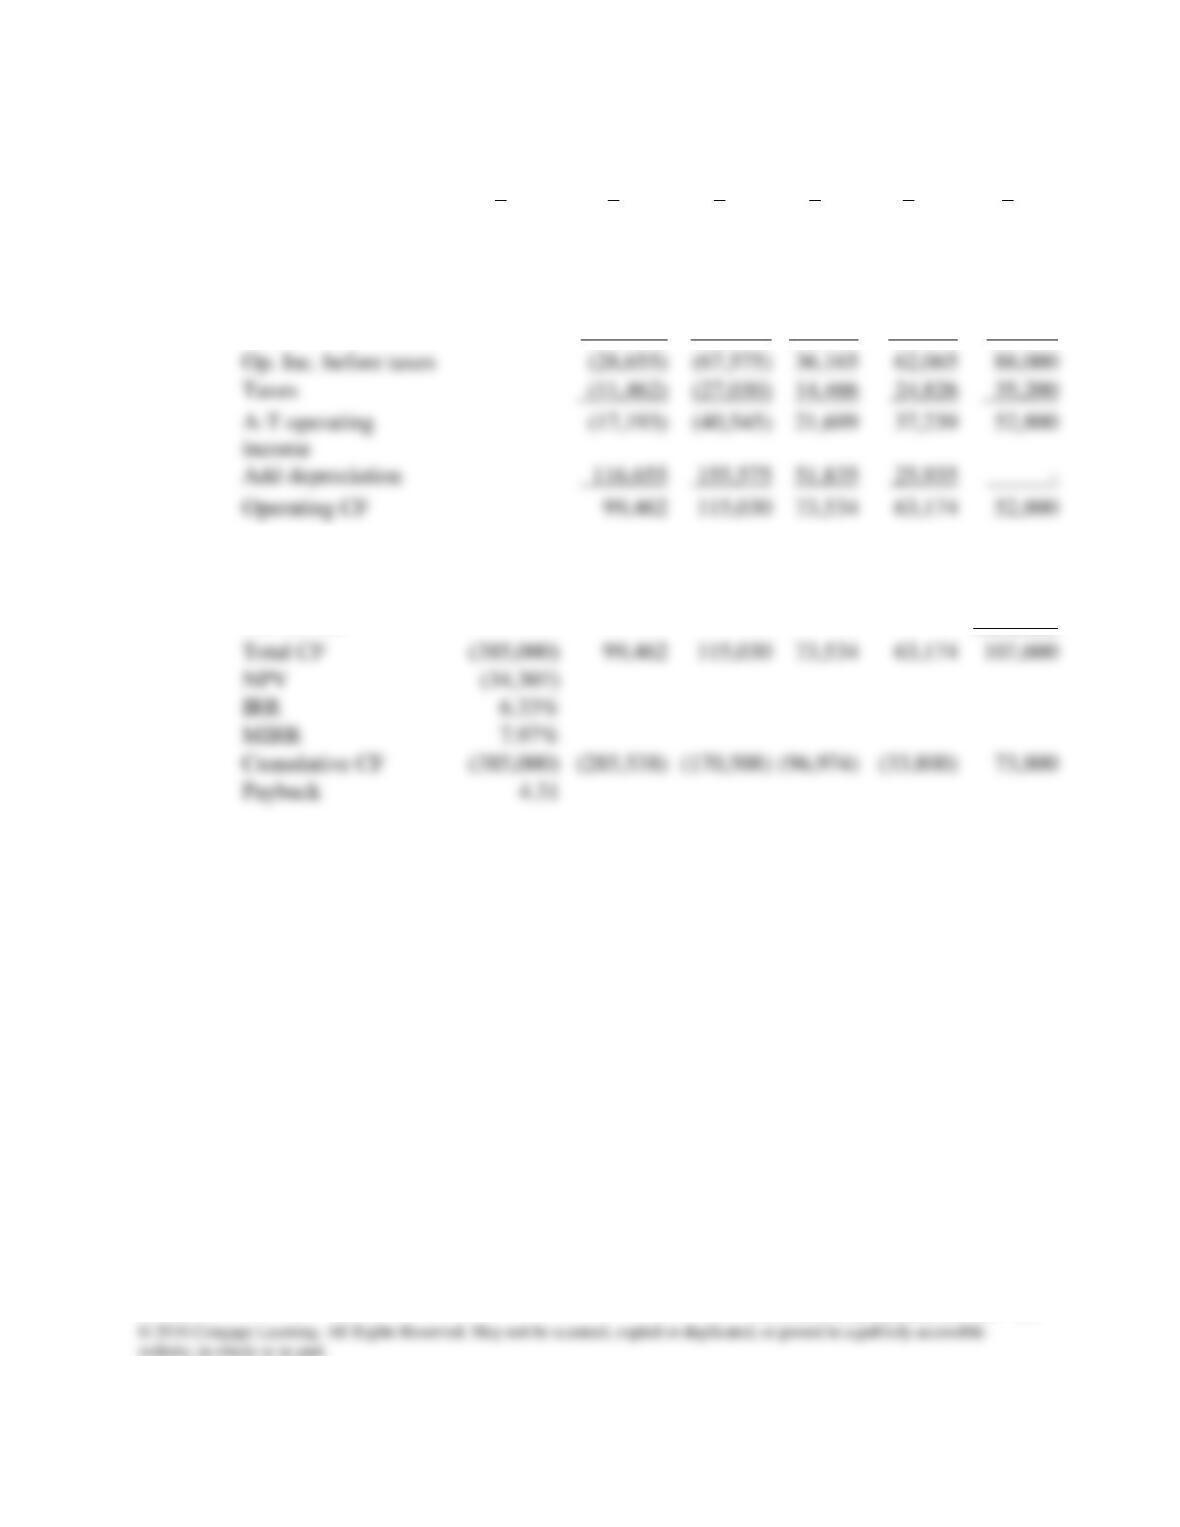
(2) Savings decrease by 20%:
0
1
2
3
4
5
Machine cost
(350,000)
Net working capital
(35,000)
Cost savings
88,000
88,000
88,000
88,000
88,000
Depreciation
116,655
155,575
51,835
25,935
–
Return of NWC
35,000
Sale of machine
33,000
Tax on sale
(13,200)
(385,000)
99,462
115,030
73,534
63,174
107,600
(34,307)
(385,000)
(285,538)
(170,508)
(96,974)
(33,800)
73,800
Answers and Solutions: 13 – 21
Op. Inc. before taxes
(28,655)
(67,575)
36,165
62,065
88,000
Taxes
(11,462)
14,466
24,826
Add depreciation
116,655
155,575
51,835
25,935
–
Operating CF
99,462
115,030
73,534
63,174
52,800
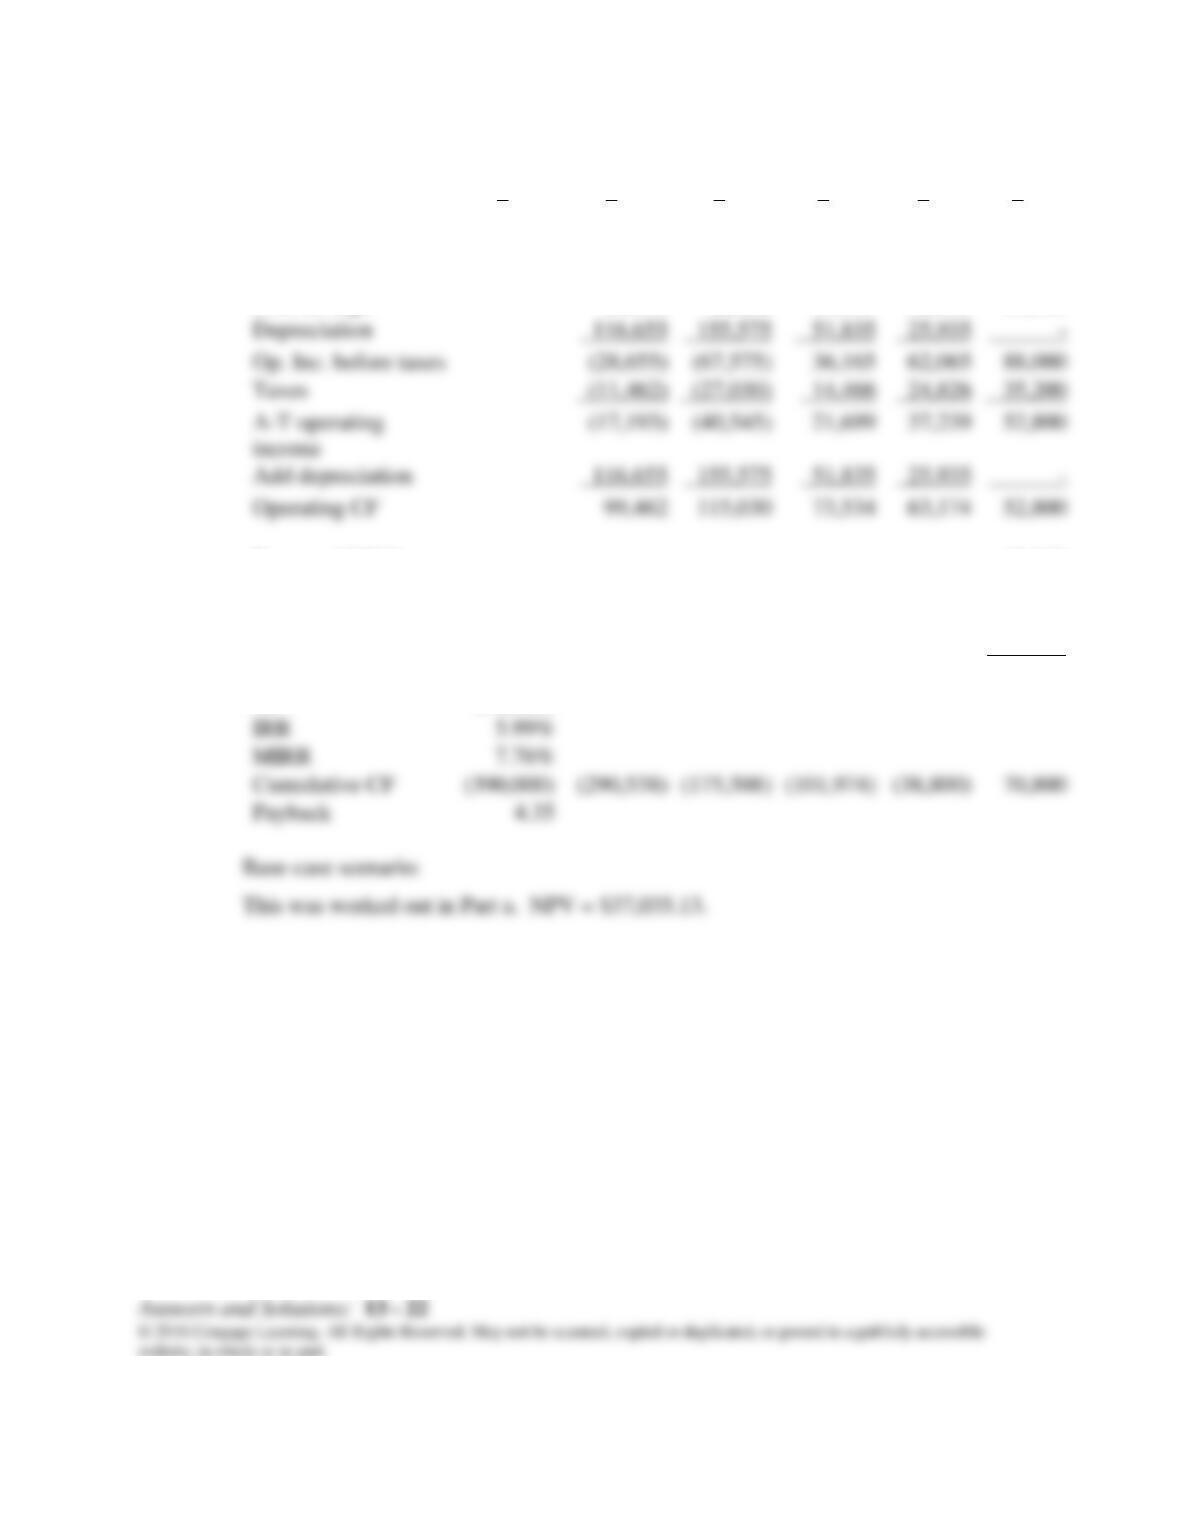
c. Worst–case scenario:
0
1
2
3
4
5
Machine cost
(350,000)
Net working capital
(40,000)
Cost savings
88,000
88,000
88,000
88,000
88,000
Return of NWC
40,000
Sale of machine
28,000
Tax on sale
(11,200)
Total CF
(390,000)
99,462
115,030
73,534
63,174
109,600
NPV
(38,065)
Cumulative CF
(390,000)
(38,800)
70,800
Op. Inc. before taxes
36,165
62,065
88,000
A-T operating
Operating CF
99,462
115,030
73,534
63,174
52,800
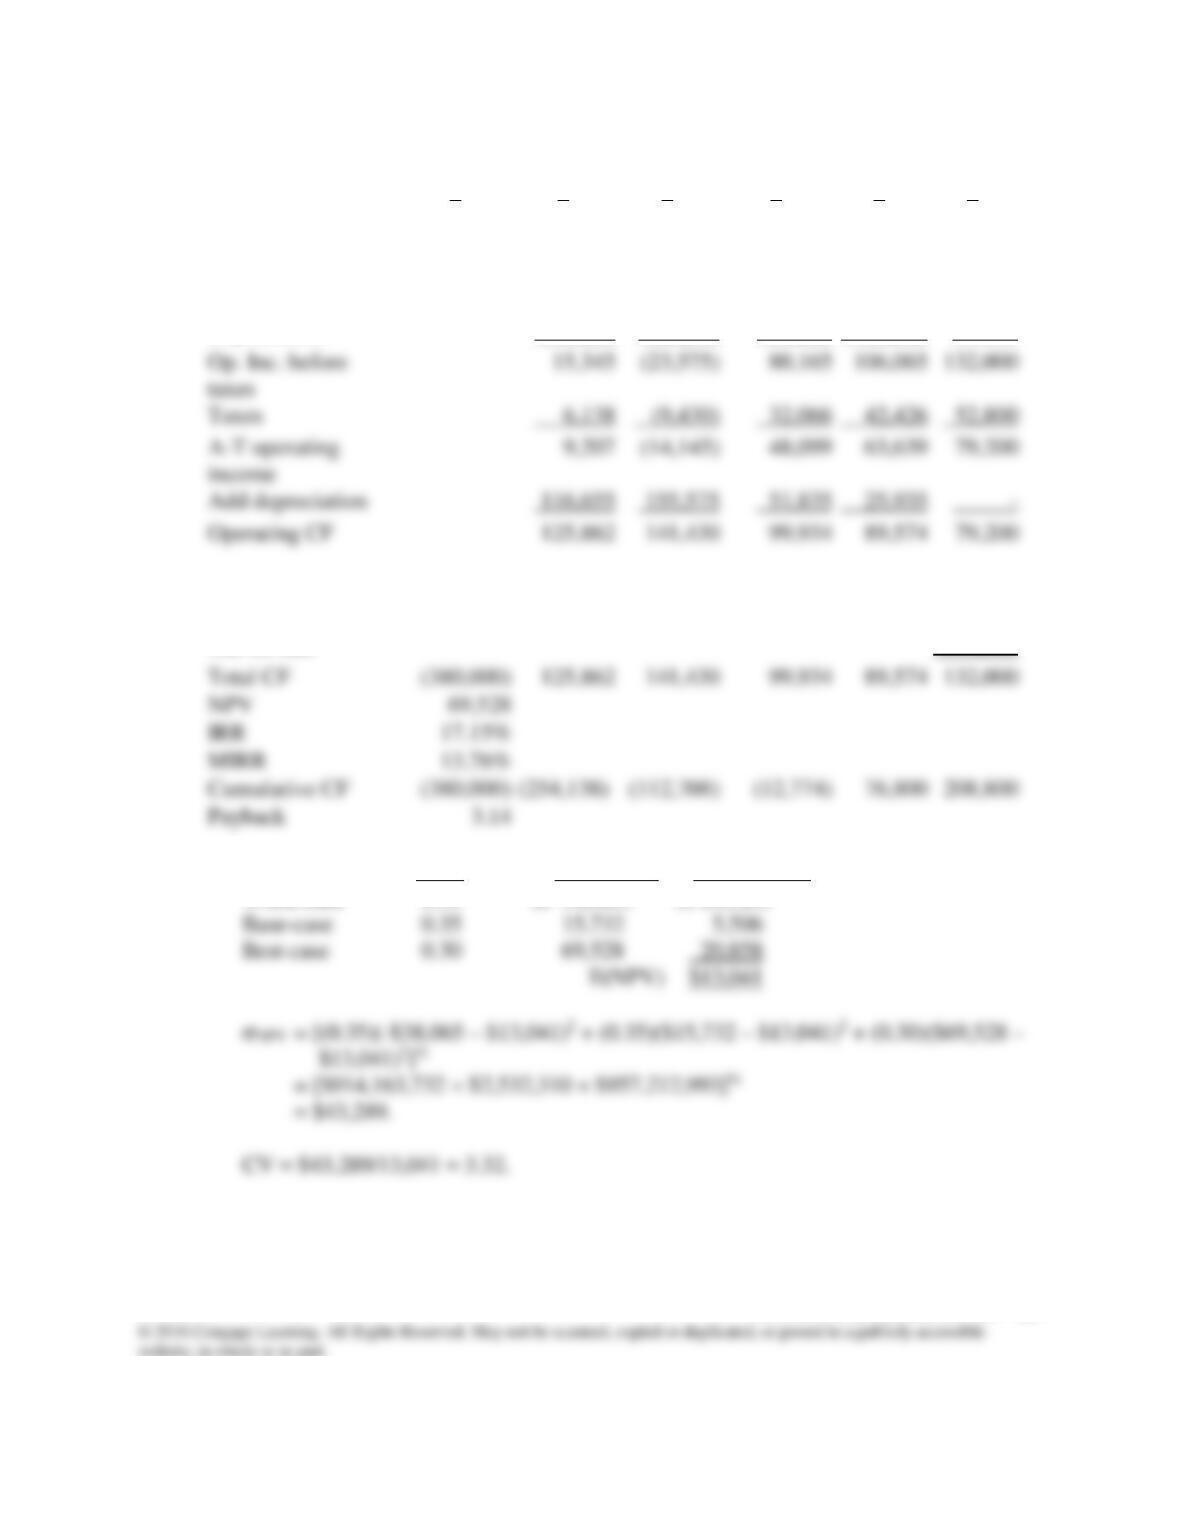
Best–case scenario:
0
1
2
3
4
5
Machine cost
(350,000)
Net working capital
(30,000)
Cost savings
132,000
132,000
132,000
132,000
132,000
Depreciation
116,655
155,575
51,835
25,935
–
Return of NWC
30,000
Sale of machine
38,000
Tax on sale
(15,200)
(380,000)
125,862
141,430
99,934
89,574
132,000
69,528
17.15%
(380,000)
(254,138)
(12,774)
76,800
208,800
Prob. NPV Prob. × NPV
Worst–case 0.35 ($ 38,065) ($ 13,323)
Answers and Solutions: 13 – 23
Taxes
6,138
32,066
42,426
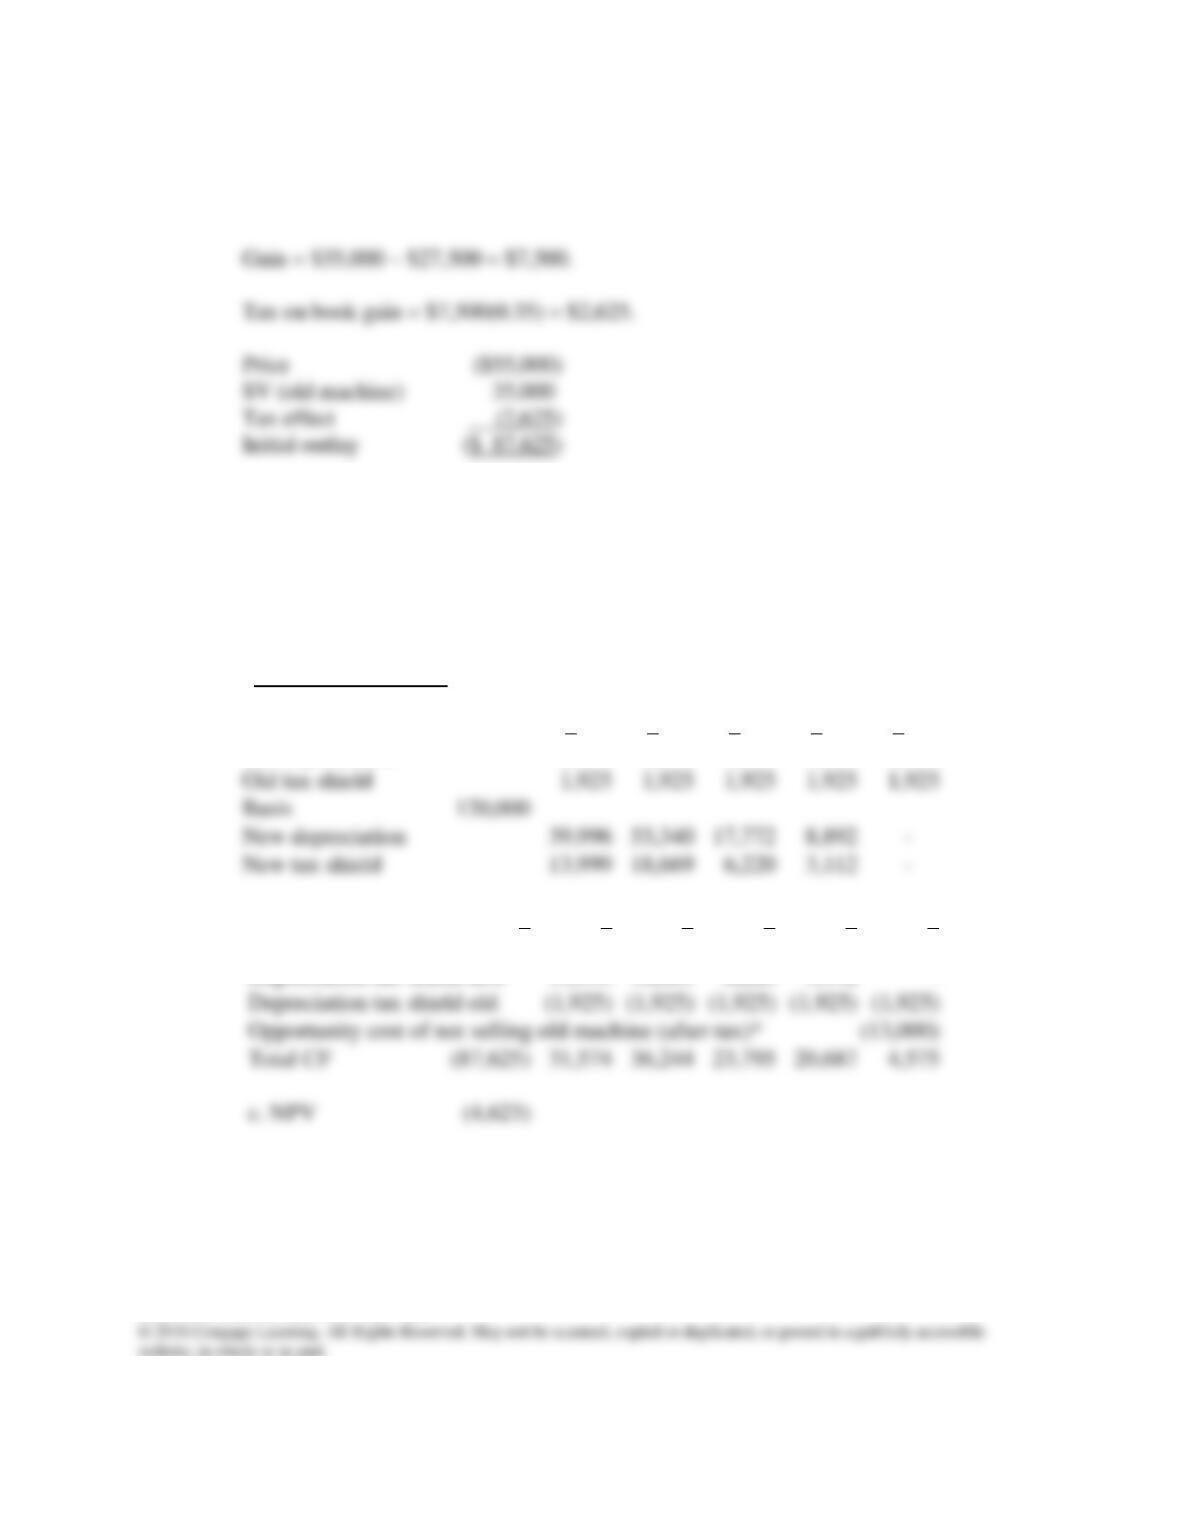
13–13 a. Old depreciation = $5,500 per year.
Book value = $55,000 – 5($5,500) = $27,500.
b.
1
2
3
4
5
Old depreciation
5,500
5,500
5,500
5,500
5,500
1,925
1,925
1,925
1,925
1,925
New depreciation
39,996
53,340
17,772
8,892
–
0
1
2
3
4
5
After tax savings
19,500
19,500
19,500
19,500
19,500
Depreciation tax shield new
13,999
18,669
6,220
3,112
–
Depreciation tax shield old
Opportunity cost of not selling old machine (after-tax)*
The NPV is negative therefore, the firm should not replace the old machine.
*After–tax opportunity cost of not being able to sell old machine at end of its useful life.
MACRS Rate
33.33%
44.45%
14.81%
7.41%
0.00%
Answers and Solutions: 13 – 24
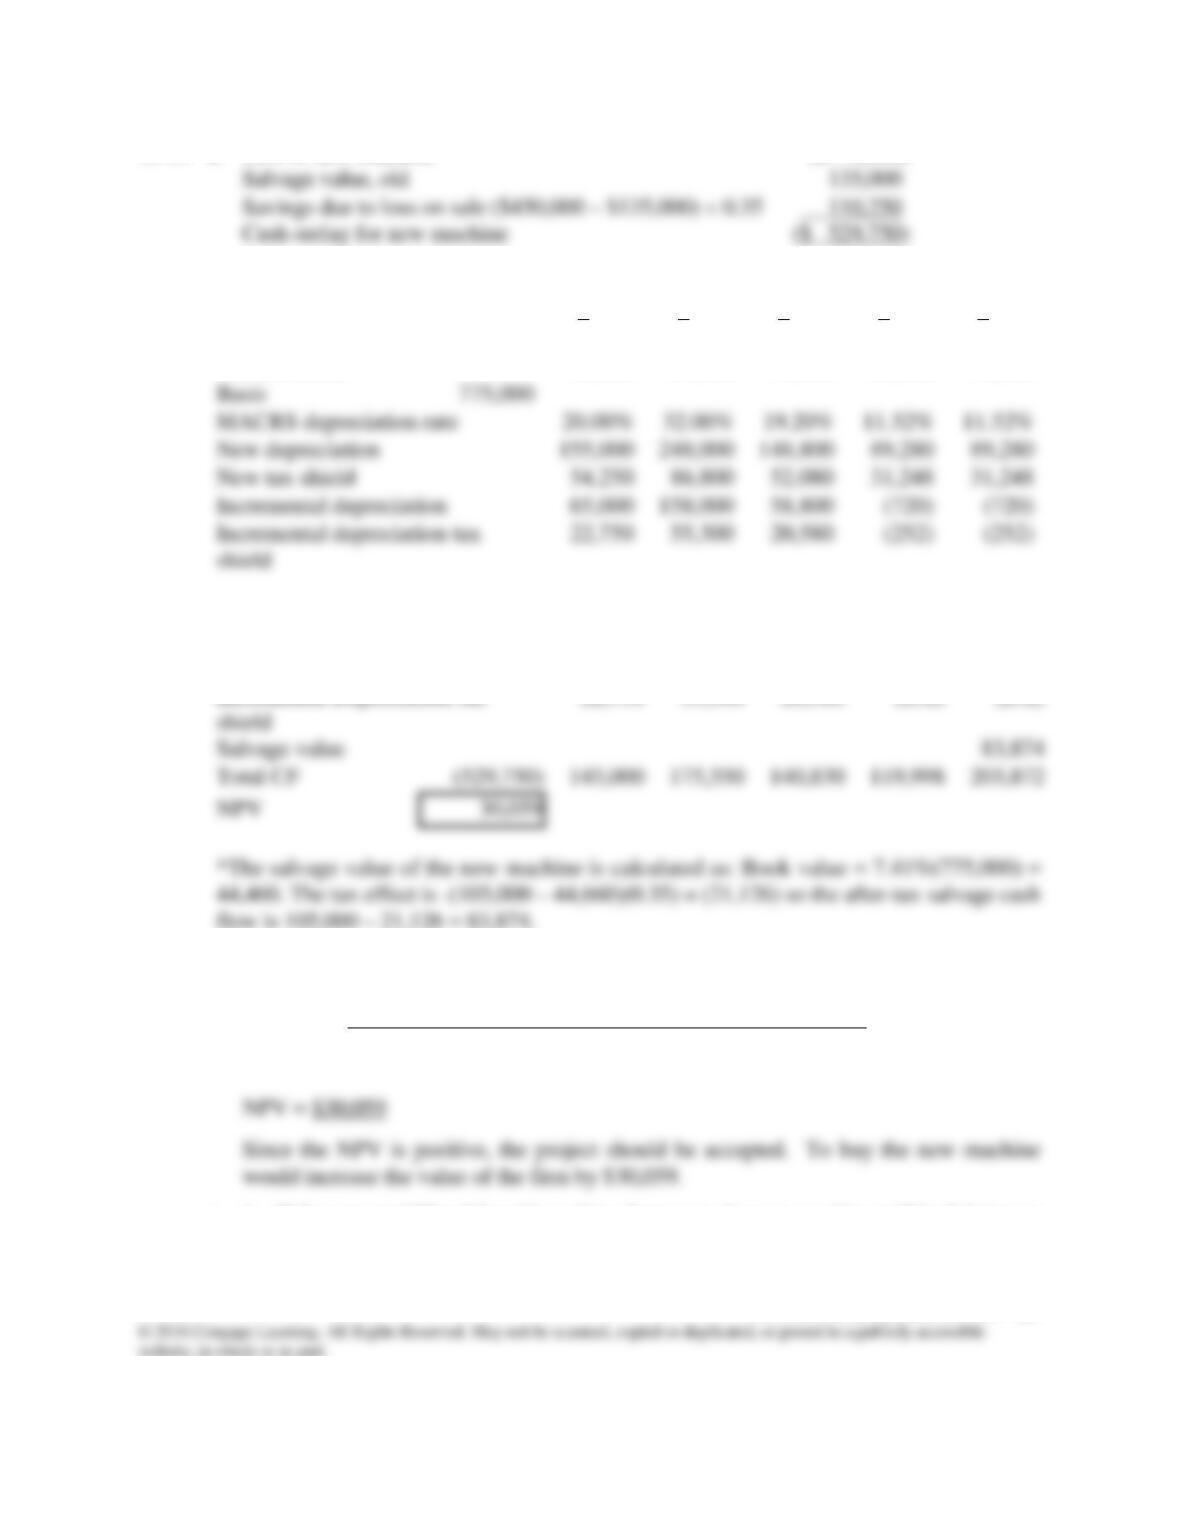
13–14 a. Cost of new machine ($775,000)
b. Recovery Depreciable Depreciation Depreciation Change in
1
2
3
4
5
Old depreciation
90,000
90,000
90,000
90,000
90,000
Old tax shield
31,500
31,500
31,500
31,500
31,500
MACRS depreciation rate
New tax shield
54,250
86,800
52,080
31,248
31,248
Incremental depreciation
158,000
58,800
Incremental depreciation tax
22,750
55,300
(252)
(252)
c. CFt = (∆Operating expenses)(1 – T) + (∆Depreciation)(T).
0
1
2
3
4
5
After tax cost savings
120,250
120,250
120,250
120,250
120,250
Salvage value
Incremental Depreciation tax
22,750
55,300
20,580
(252)
(252)
d. A time line of the cash flows looks like this:
0 1 2 3 4 5
| | | | | |
(529,750) 143,000 175,550 140,830 119,998 203,872
e. 1. If the expected life of the old machine decreases, the new machine will look better as
cash flows attributable to the new machine would increase. On the other hand, a
12%
Answers and Solutions: 13 – 25
2. The higher capital cost should be used in the analysis.
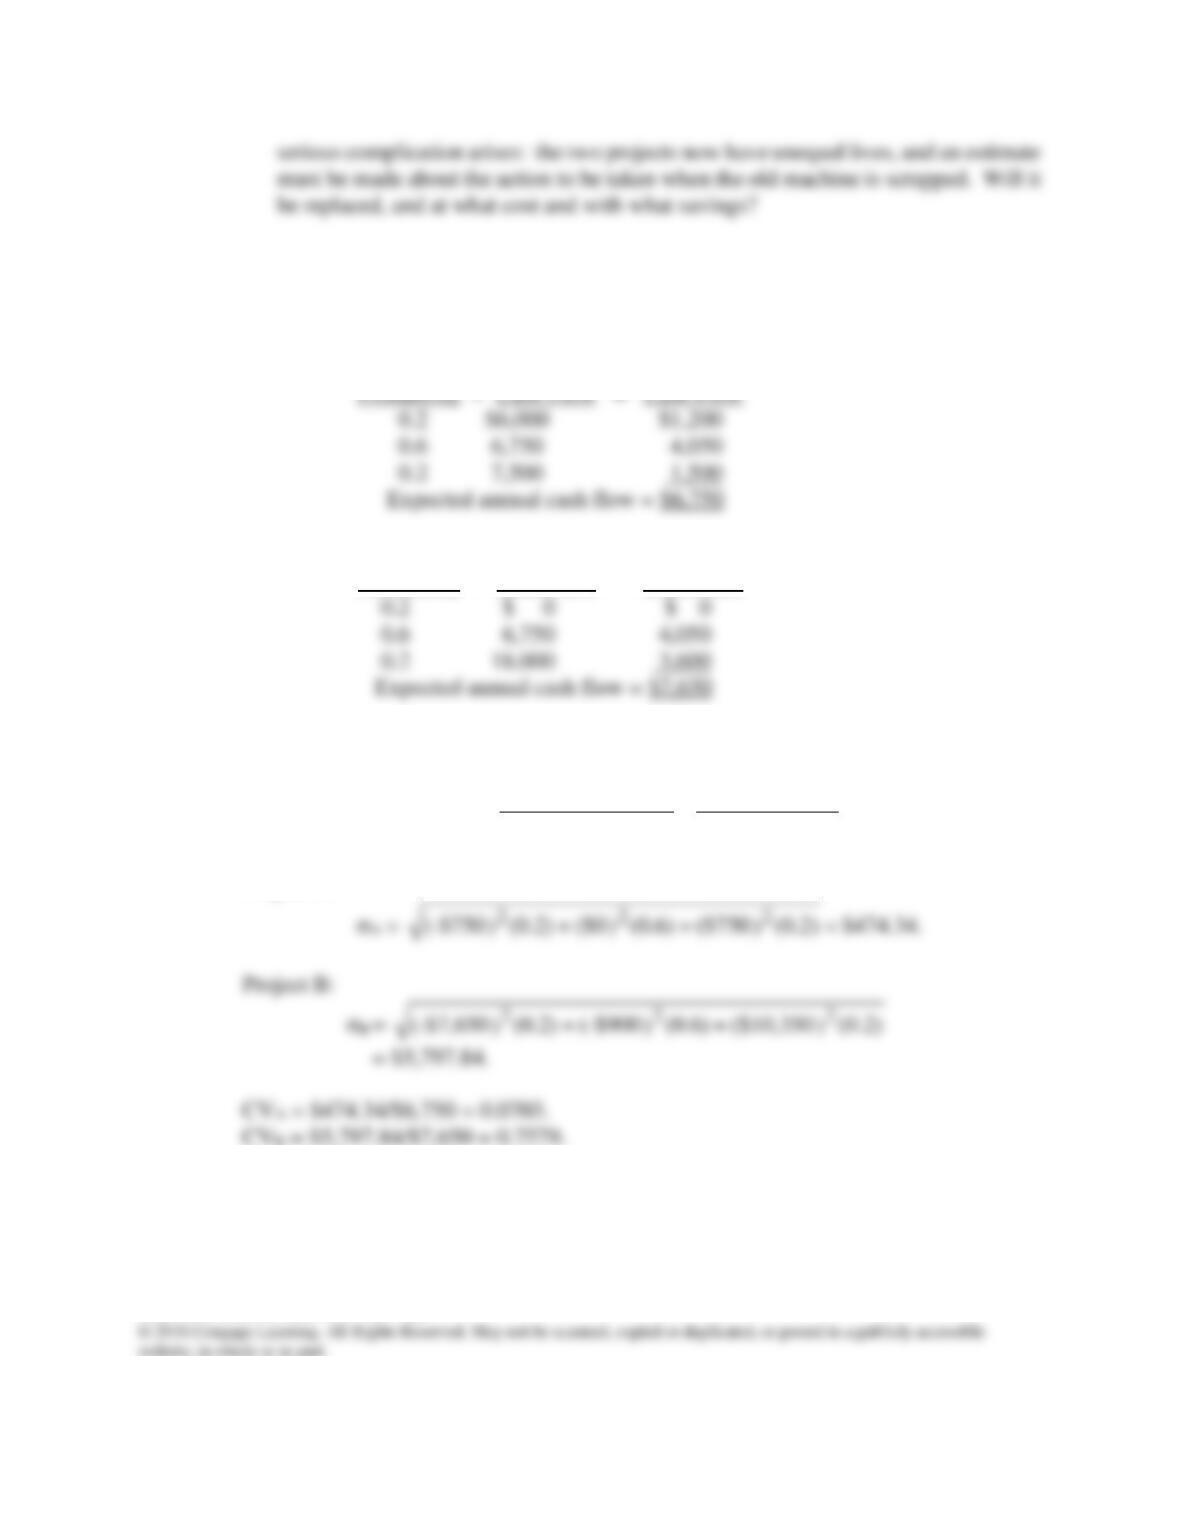
13-15 a. Expected annual cash flows:
Project A: Probable
Project B: Probable
Probability × Cash Flow = Cash Flow
Coefficient of variation:
CV =
Project A:
NPV Expected
=
valueExpected
deviation Standard NPV
σ
Answers and Solutions: 13 – 26
b. Project B is the riskier project because it has the greater variability in its probable cash
flows, whether measured by the standard deviation or the coefficient of variation.
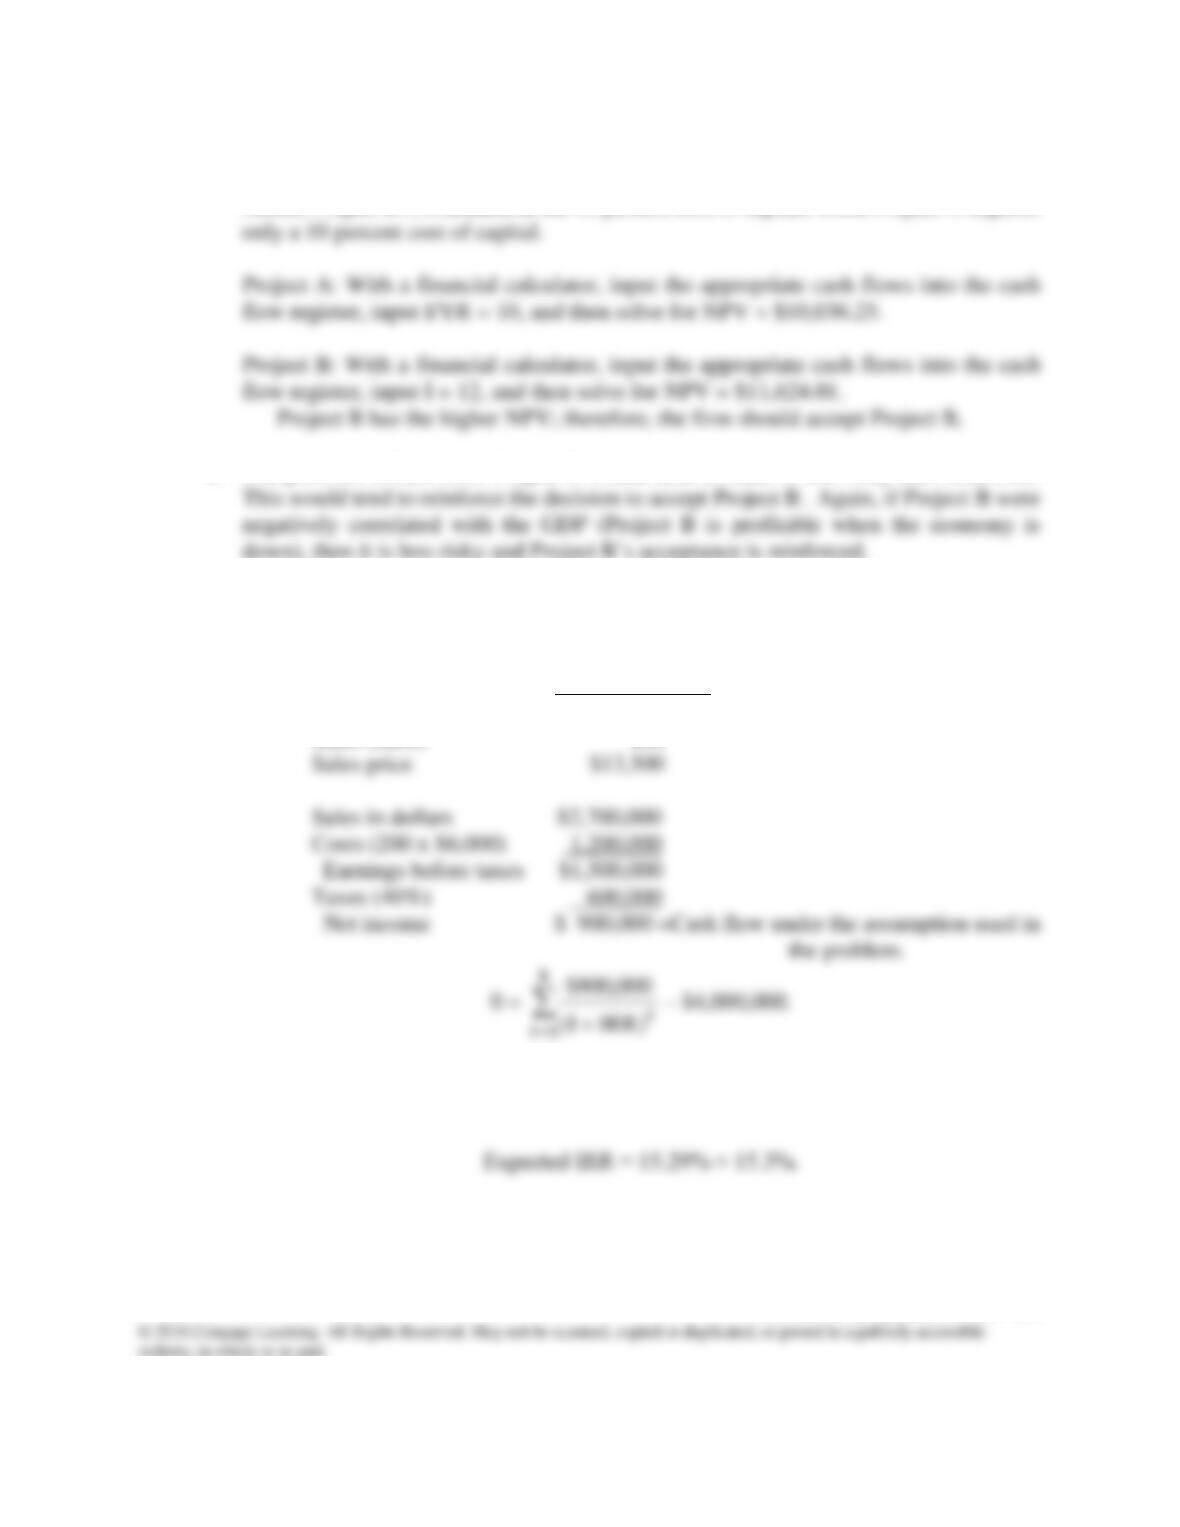
Hence, Project B is evaluated at the 12 percent cost of capital, while Project A requires
c. The portfolio effects from Project B would tend to make it less risky than otherwise.
down), then it is less risky and Project B’s acceptance is reinforced.
13-16 a. First, note that with symmetric probability distributions, the middle value of each
distribution is the expected value. Therefore,
Expected Values
Sales (units) 200
Using a financial calculator, input the following: CF0 = -4000000, CF1 = 900000, and
Nj = 8, to solve for IRR = 15.29%.
Answers and Solutions: 13 – 27
b. Using a financial calculator, input the following: CF0 = -4000000, CF1 = 900000, Nj =
8, and I/YR = 15 to solve for NPV = $38,589.36. Again, there is no easy way to
estimate σNPV.
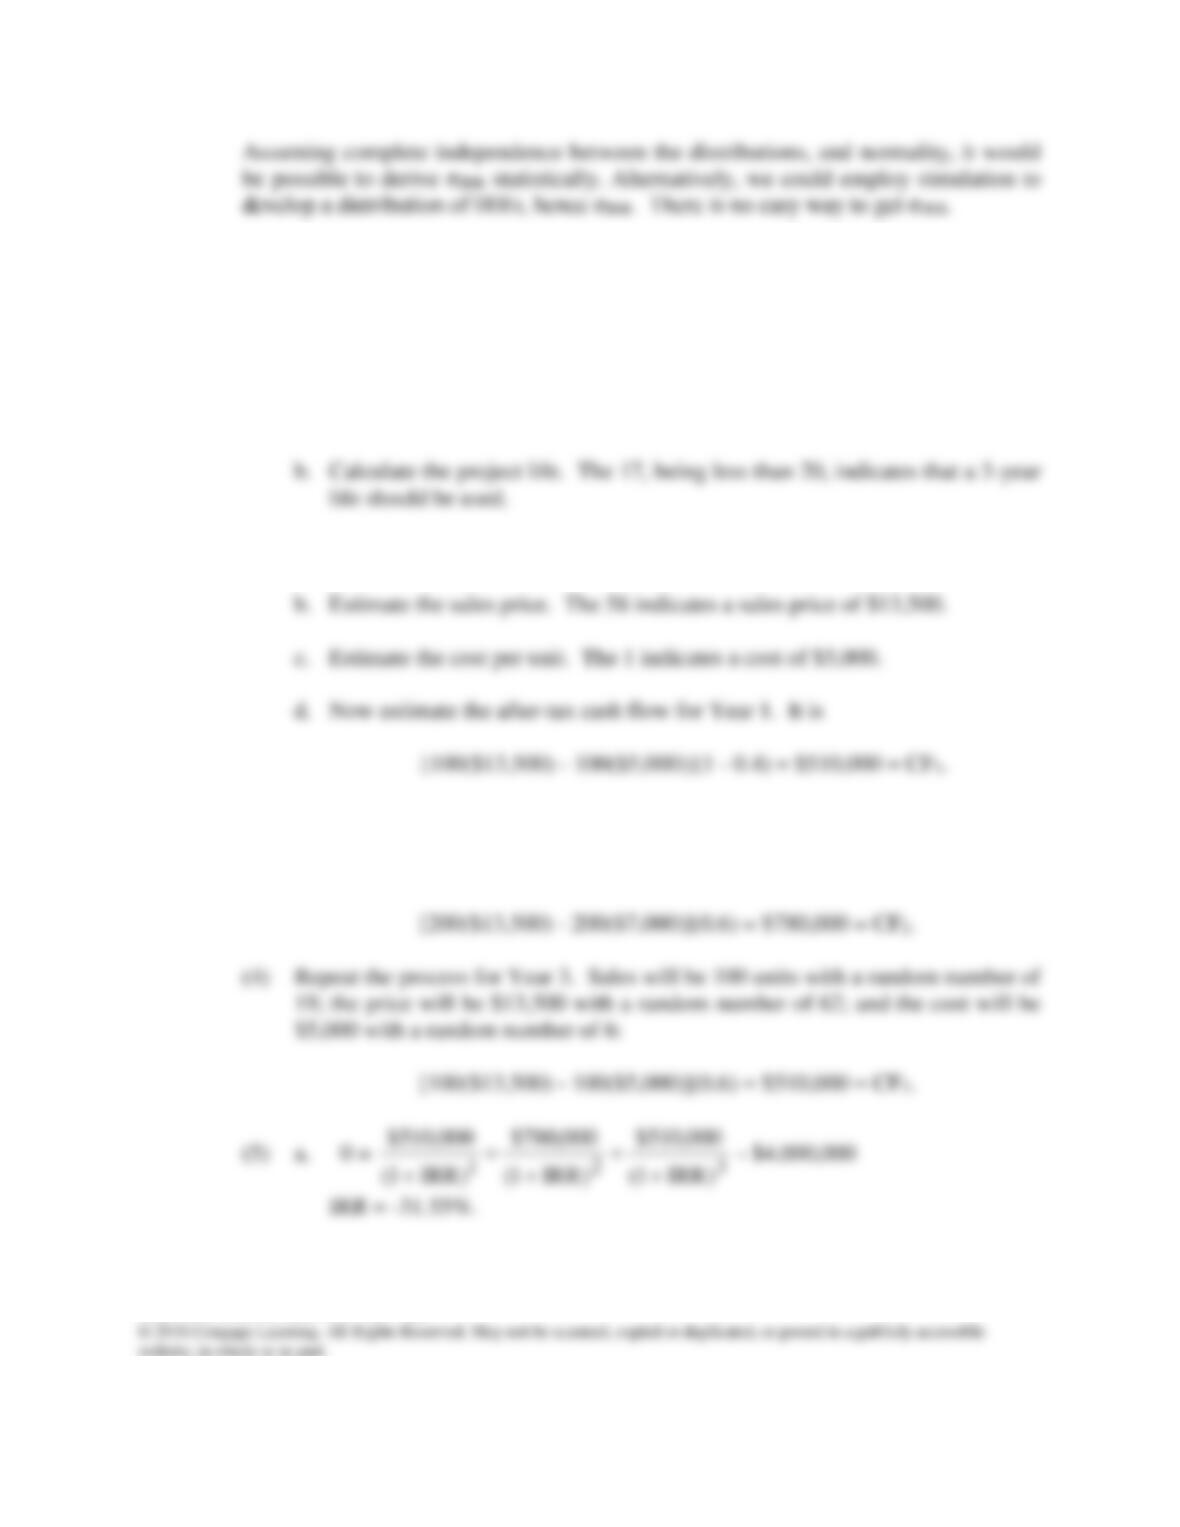
c. (1) a. Calculate developmental costs. The 44 random number value, coming
between 30 and 70, indicates that the costs for this run should be taken to be
$4 million.
(2) a. Estimate unit sales. The 16 indicates sales of 100 units.
(3) Repeat the process for Year 2. Sales will be 200 with a random number of 79;
the price will be $13,500 with a random number of 83; and the cost will be $7,000
with a random number of 86:
Answers and Solutions: 13 – 28
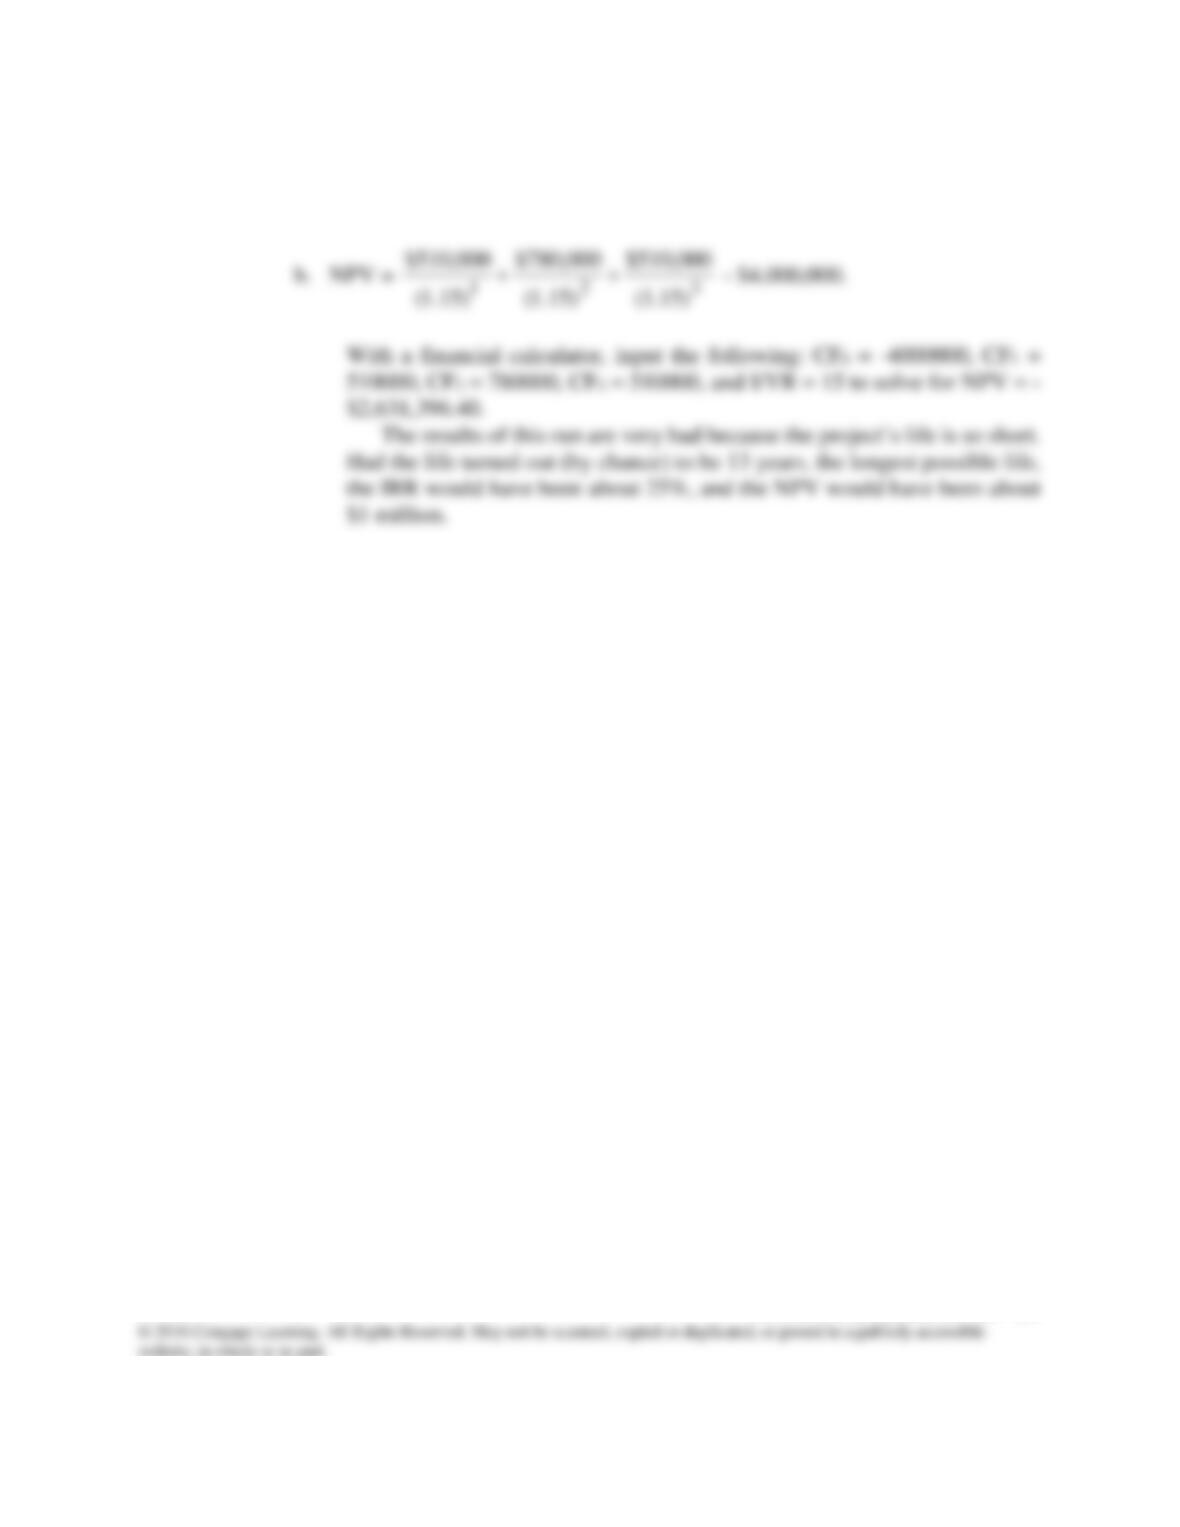
Alternatively, with a financial calculator, input the following: CF0 = –
4000000, CF1 = 510000, CF2 = 780000, CF3 = 510000, and solve for IRR = –
31.55%.
Answers and Solutions: 13 – 29
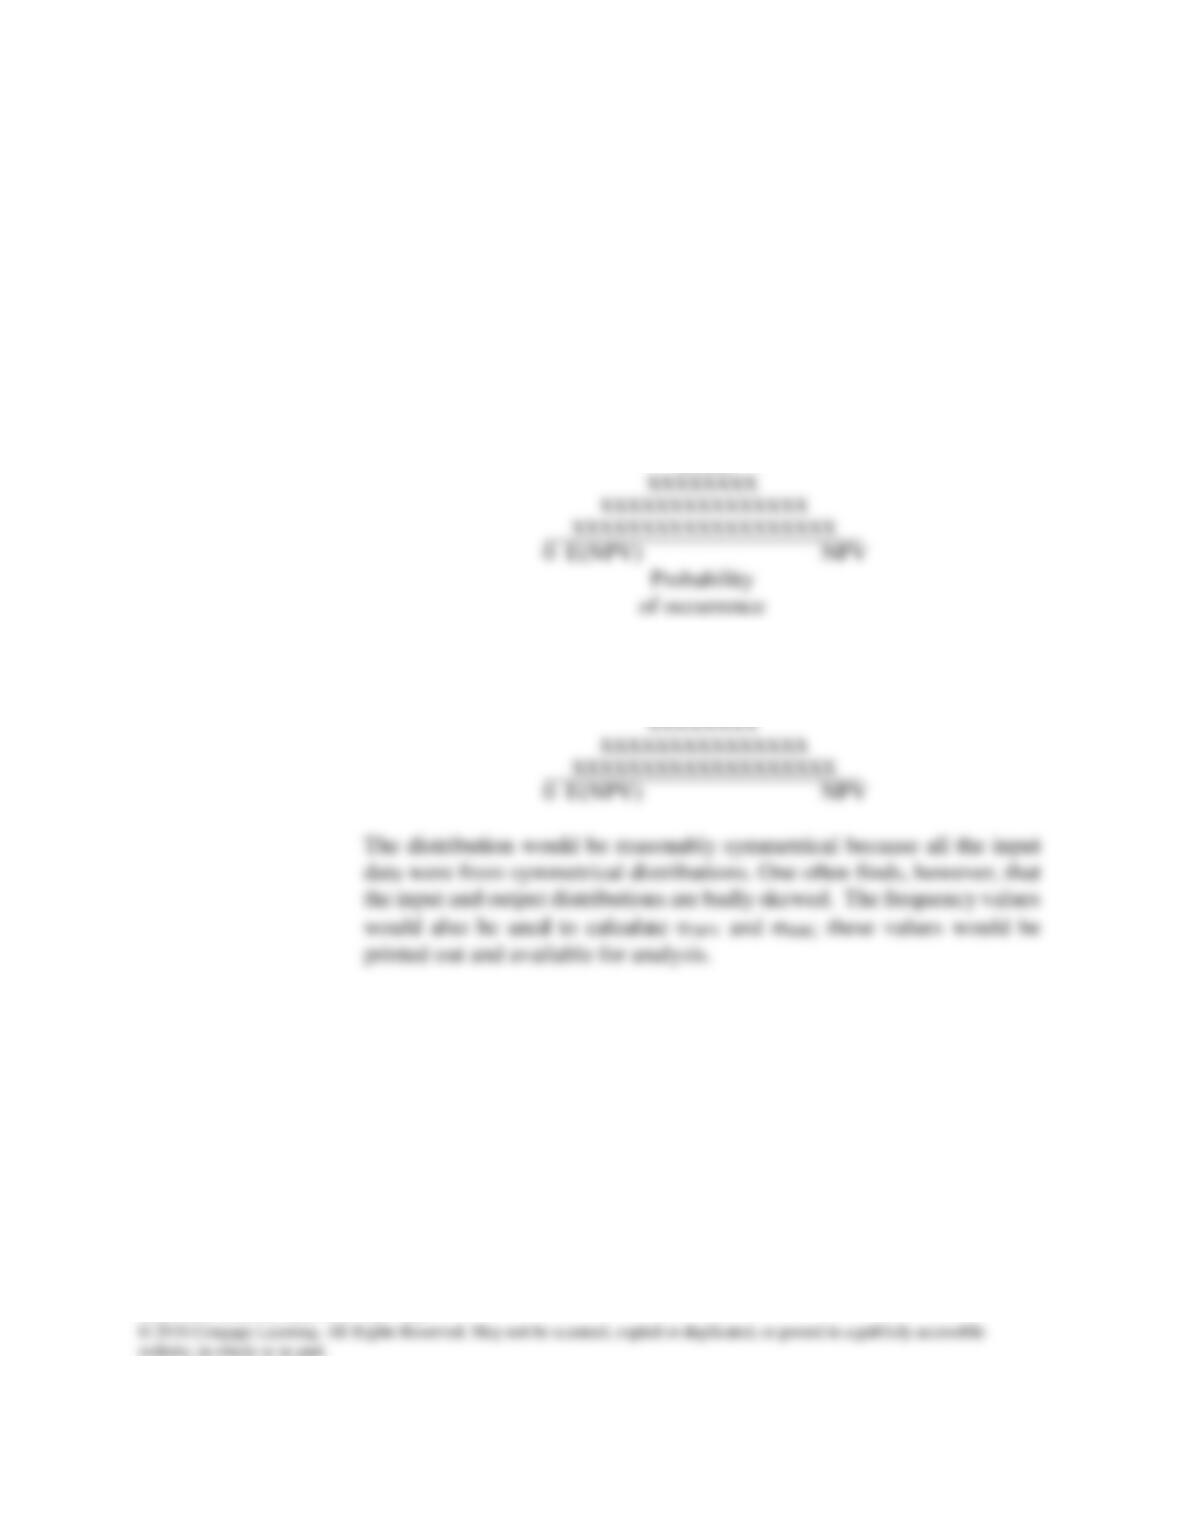
(6) & (7) The computer would store σNPVs and σIRRs for the different trials, then
display them as frequency distributions:
Probability
of occurrence
X
XX
XXXX
X
XX
XXXX
Answers and Solutions: 13 – 30
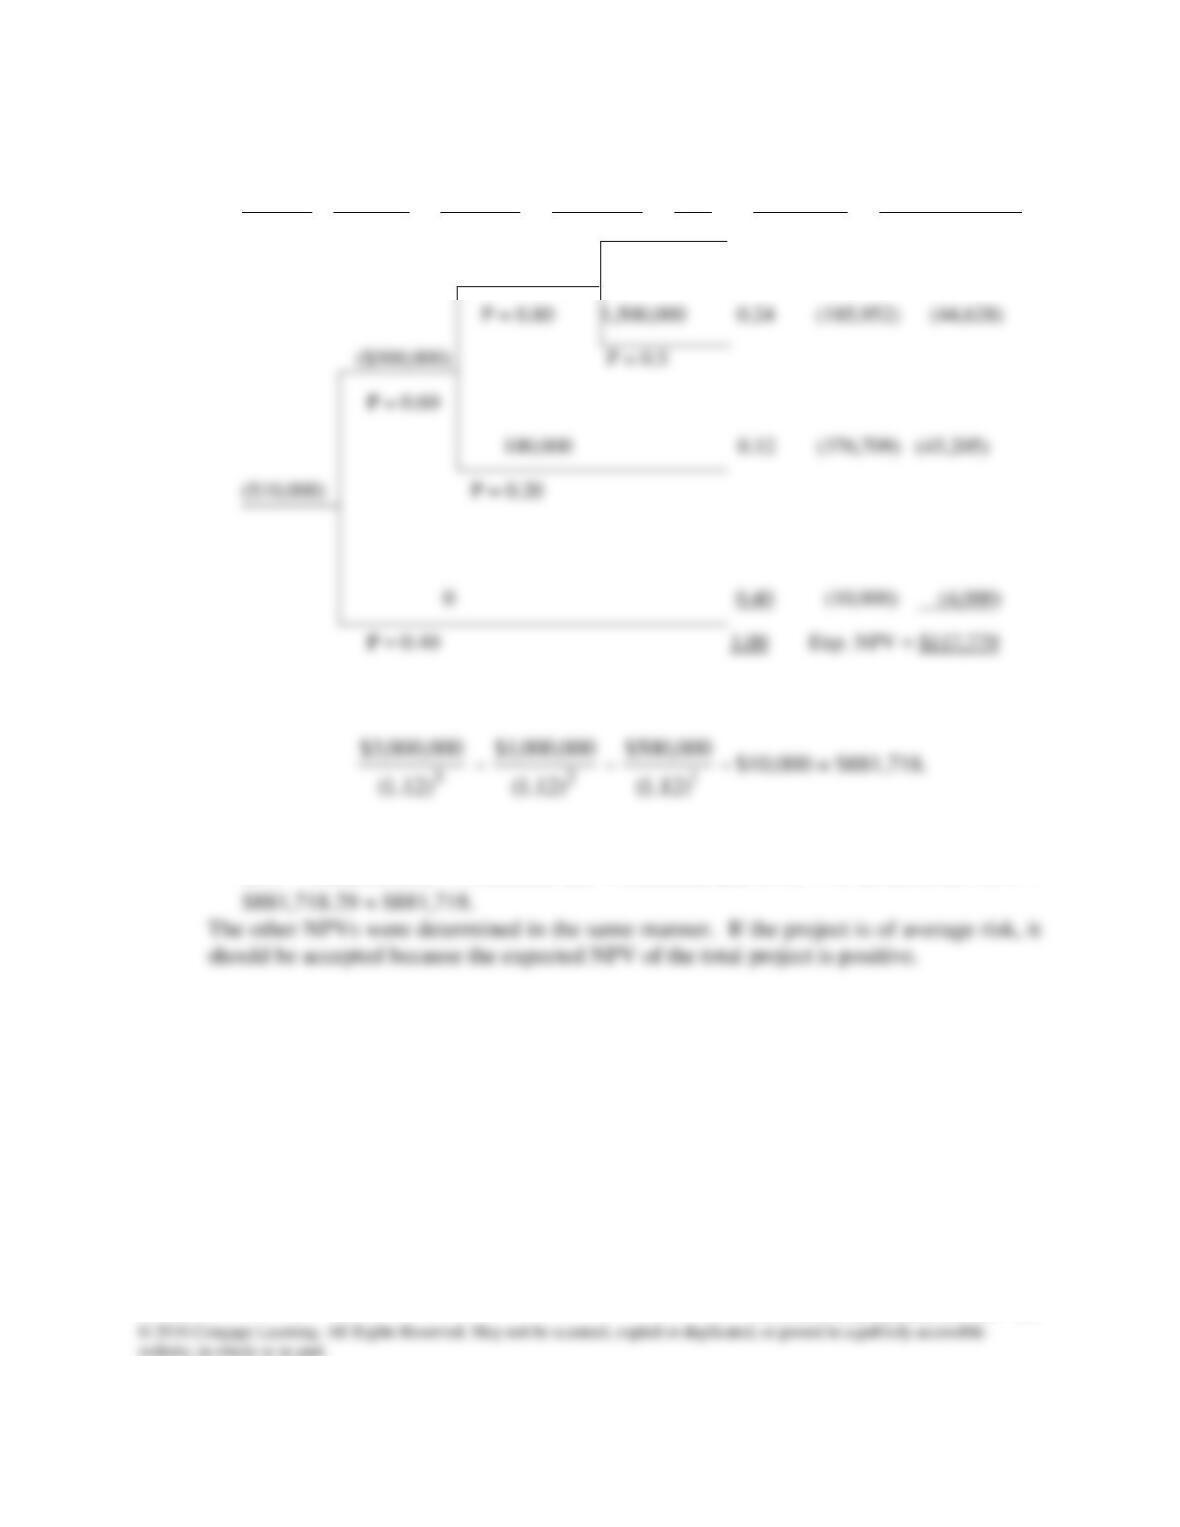
13-17 a. The resulting decision tree is:
NPV
t = 0 t = 1 t = 2 t = 3 P NPV Product
$3,000,000 0.24 $881,718 $211,612
($1,000,000) P = 0.5
The NPV of the top path is:
Using a financial calculator, input the following: CF0 = -10000,
CF1 = –500000, CF2 = -1000000, = 3000000, and I/YR = 12 to solve for NPV =
CF
3
Answers and Solutions: 13 – 31
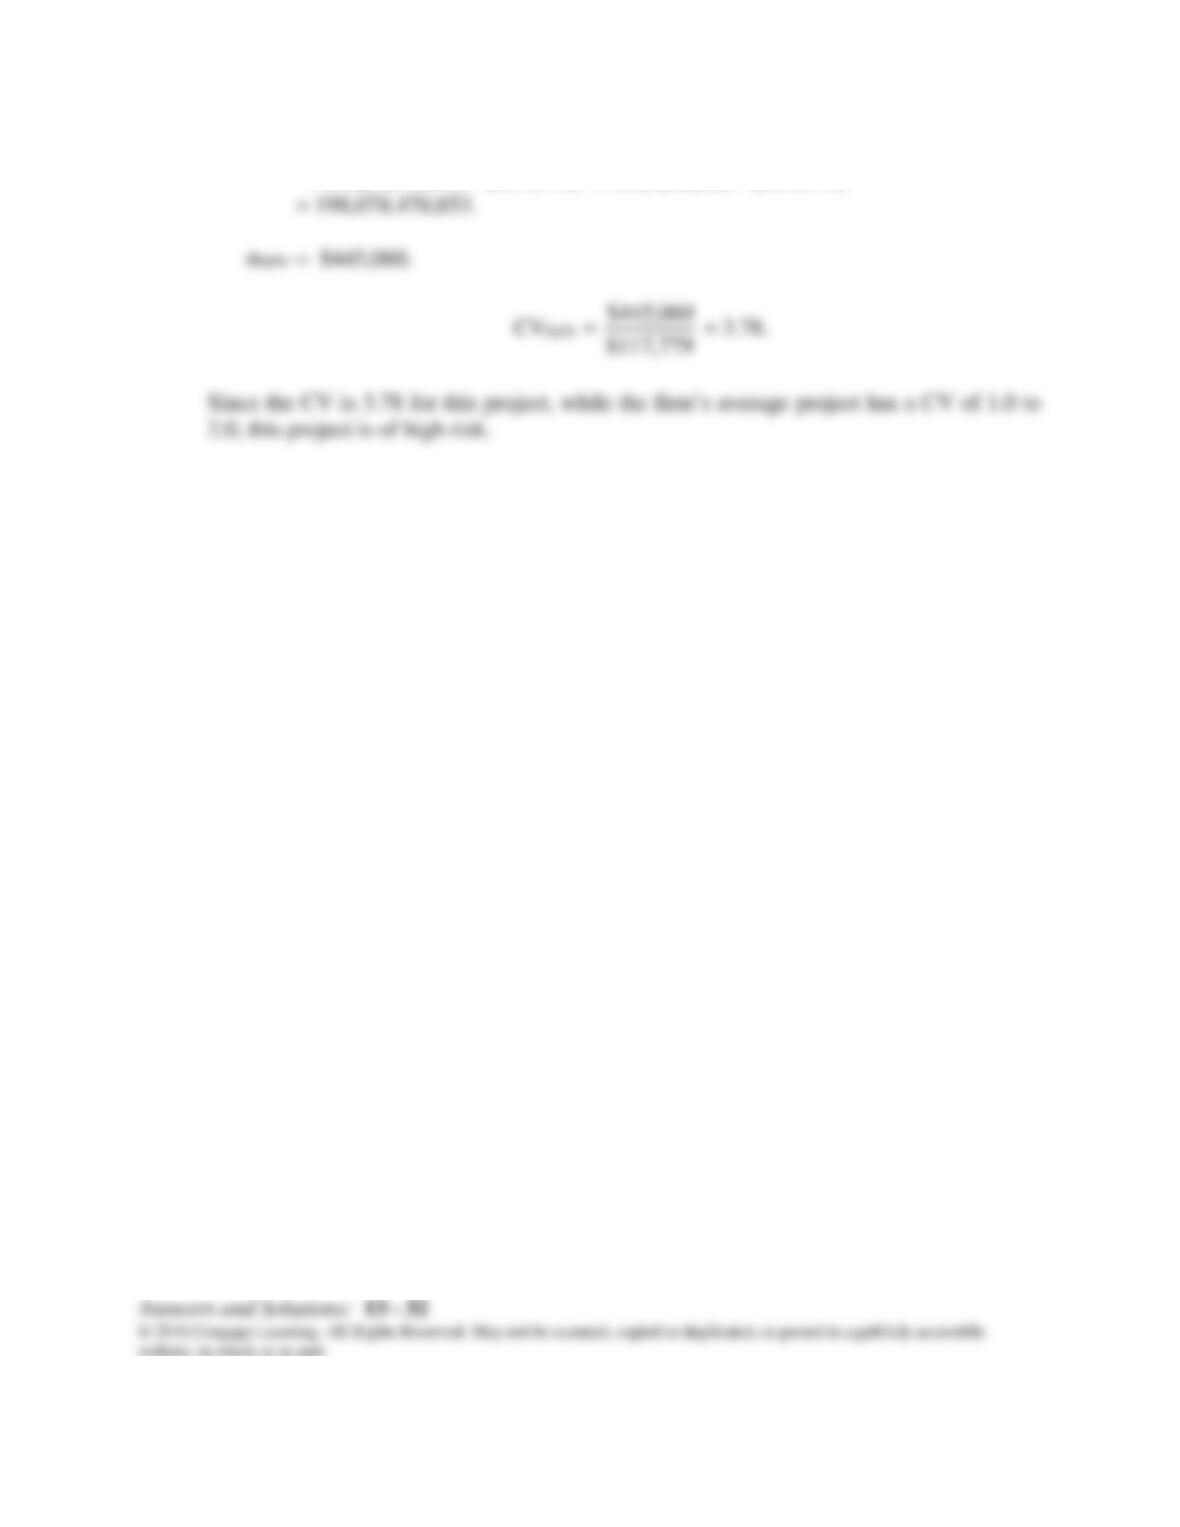
b. σ2NPV = 0.24($881,718 – $117,779)2 + 0.24(-$185,952 – $117,779)2
+ 0.12(-$376,709 – $117,779)2 + 0.4(-$10,000 – $117,779)2
SOLUTION TO SPREADSHEET PROBLEM
13-18 The detailed solution for the problem is available in the file Ch 13 P18 Build a Model