190
Chapter 13
Investor Behavior and Capital Market
Efficiency
13–1. Assume that all investors have the same information and care only about expected return and
volatility. If new information arrives about one stock, can this information affect the price and
return of other stocks? If so, explain why.
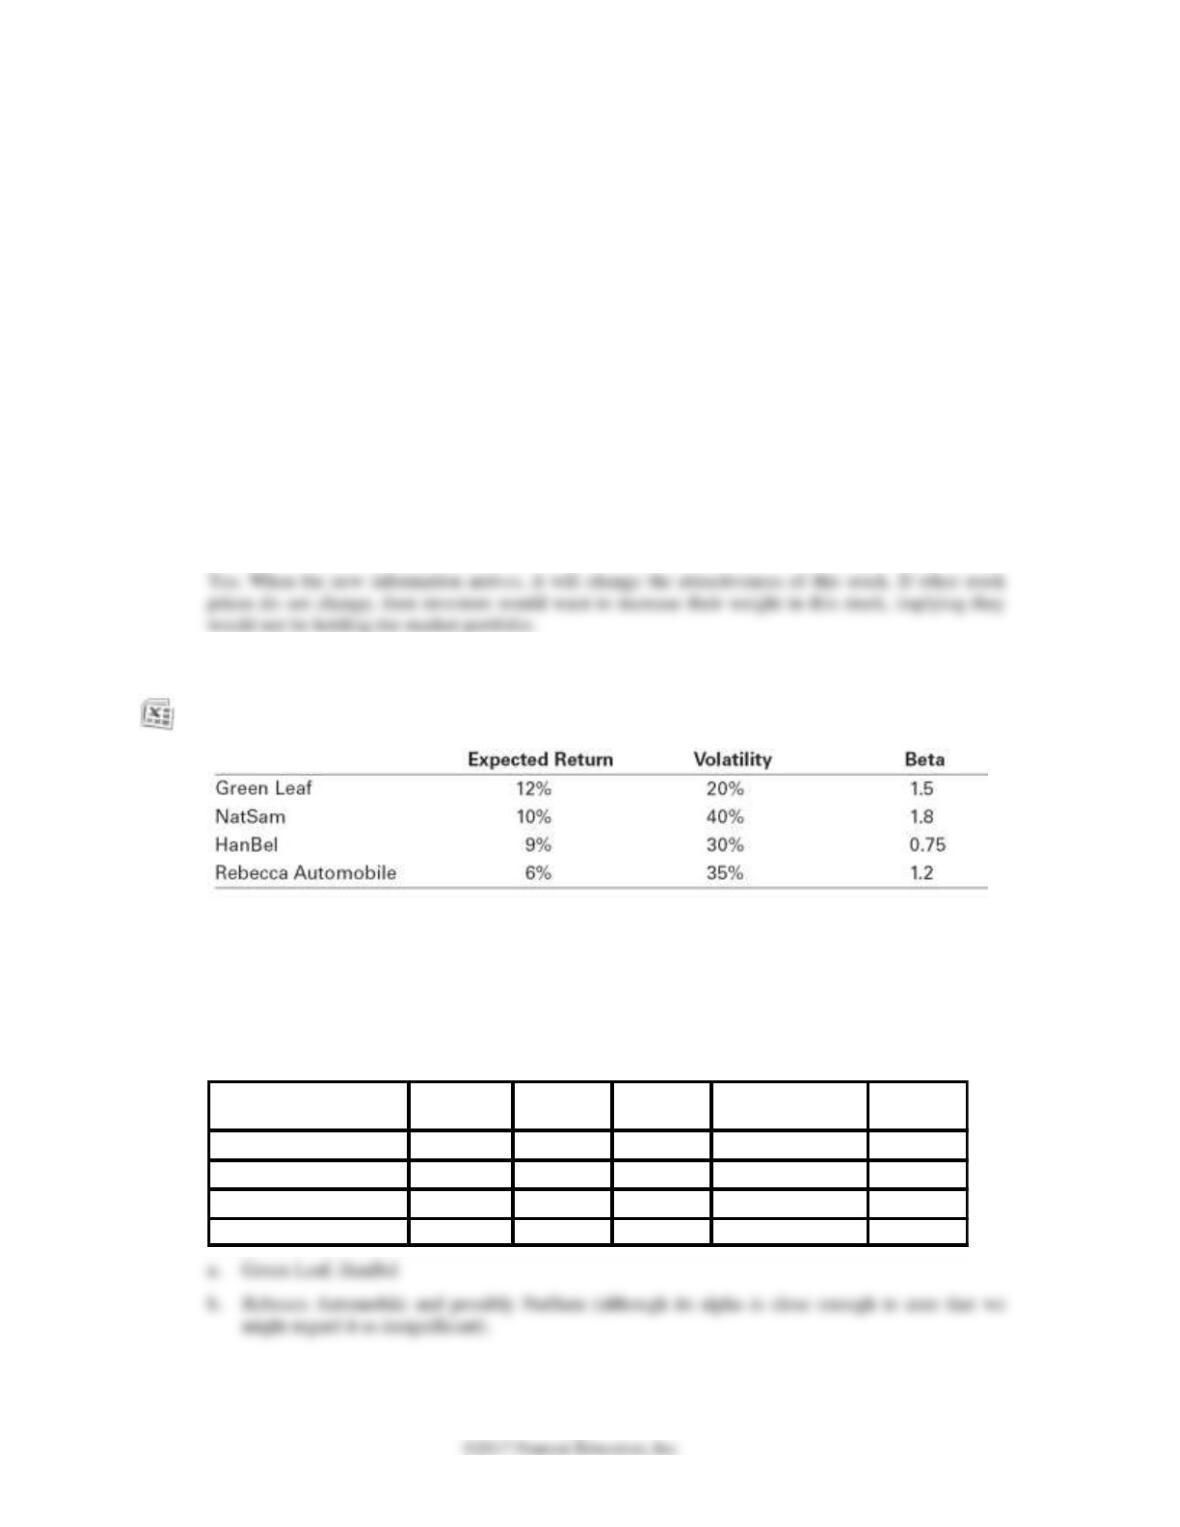
13–2. Assume that the CAPM is a good description of stock price returns. The market expected return
is 7% with 10% volatility and the risk-free rate is 3%. New news arrives that does not change
any of these numbers but it does change the expected return of the following stocks:
a. At current market prices, which stocks represent buying opportunities?
b. On which stocks should you put a sell order in?
According to the CAPM, we should hold the market portfolio. But once new news arrives and we
update our expectations, we may find profitable trading opportunities if we can trade before prices
fully adjust to the news. Assuming we initially hold the market portfolio, we can improve gain by
investing more in stocks with positive alphas and less in stocks with negative alphas.
Expected
Return
Volatility Beta
Required Return
(CAPM)
Alpha
Green Leaf 12% 20% 1.5 9.0% 3.0%
NatSam 10% 40% 1.8 10.2% -0.2%
HanBel 9% 30% 0.75 6.0% 3.0%
Rebecca Automobile 6% 35% 1.2 7.8% -1.8%
13–3. Suppose the CAPM equilibrium holds perfectly. Then the risk–free interest rate increases, and
nothing else changes.
a. Is the market portfolio still efficient?
b. If your answer to part (a) is yes, explain why. If not, describe which stocks would be buying
opportunities and which stocks would be selling opportunities.
13–4. You know that there are informed traders in the stock market, but you are uninformed.
Describe an investment strategy that guarantees that you will not lose money to the informed
13–5. What are the only conditions under which the market portfolio might not be an efficient
portfolio?
The market portfolio can be inefficient (so it is possible to beat the market) only if a significant number
of investors either:
13–6. Explain what the following sentence means: The market portfolio is a fence that protects the
sheep from the wolves, but nothing can protect the sheep from themselves.
13–7. You are trading in a market in which you know there are a few highly skilled traders who are
better informed than you are. There are no transaction costs. Each day you randomly choose five
stocks to buy and five stocks to sell (by, perhaps, throwing darts at a dartboard).
a. Over the long run will your strategy outperform, underperform, or have the same return as
a buy and hold strategy of investing in the market portfolio?
b. Would your answer to part (a) change if all traders in the market were equally well
informed and were equally skilled?
13–8. Why does the CAPM imply that investors should trade very rarely?
13–9. Your brother Joe is a surgeon who suffers badly from the overconfidence bias. He loves to trade
stocks and believes his predictions with 100% confidence. In fact, he is uninformed like most
investors. Rumors are that Vital Signs (a startup that makes warning labels in the medical
industry) will receive a takeover offer at $20 per share. Absent the takeover offer, the stock will
trade at $15 per share. The uncertainty will be resolved in the next few hours. Your brother
believes that the takeover will occur with certainty and has instructed his broker to buy the stock
at any price less than $20. In fact, the true probability of a takeover is 50%, but a few people are
informed and know whether the takeover will actually occur. They also have submitted orders.
Nobody else is trading in the stock.
a. Describe what will happen to the market price once these orders are submitted if in fact the
takeover will occur in a few hours. What will your brother’s profits be: positive, negative or
zero?
b. What range of possible prices could result once these orders are submitted if the takeover
does not occur? What will your brother’s profits be: positive, negative or zero?
c. What are your brother’s expected profits?
13-10. To put the turnover of Figure 13.3 into perspective, let’s do a back of the envelope calculation of
what an investor’s average turnover per stock would be were he to follow a policy of investing in
the S&P 500 portfolio. Because the portfolio is value weighted, the trading would be required
when Standard and Poor’s changes the constituent stocks. (Let’s ignore additional, but less
important reasons like new share issuances and repurchases.) Assuming they change 23 stocks a
year (the historical average since 1962) what would you estimate the investor’s per stock share
turnover to be? Assume that the average total number of shares outstanding for the stocks that
are added or deleted from the index is the same as the average number of shares outstanding for
S&P 500 stocks.
13-11. How does the disposition effect impact investors’ tax obligations?
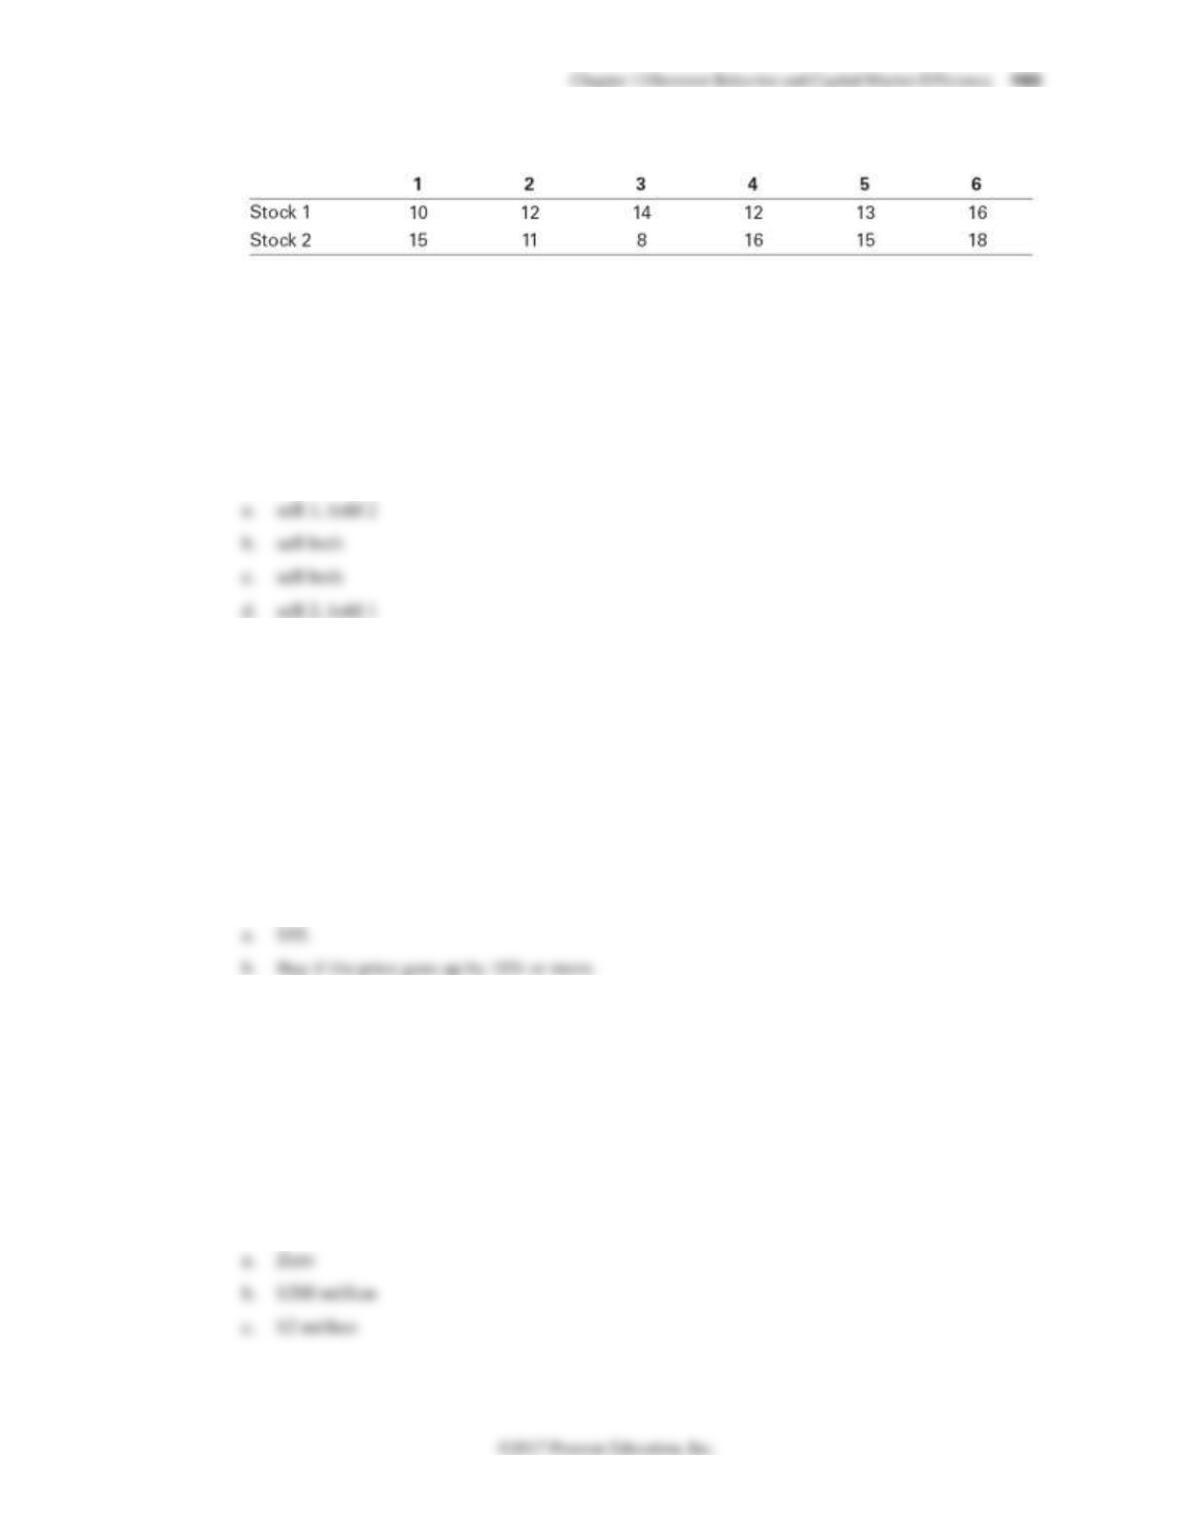
13-12. Consider the price paths of the following two stocks over six time periods:
Neither stock pays dividends. Assume you are an investor with the disposition effect and you
bought at time 1 and right now it is time 3. Assume throughout this question that you do no
trading (other than what is specified) in these stocks.
a. Which stock(s) would you be inclined to sell? Which would you be inclined to hold onto?
b. How would your answer change if right now is time 6?
c. What if you bought at time 3 instead of 1 and today is time 6?
d. What if you bought at time 3 instead of 1 and today is time 5?
13-13. Suppose that all investors have the disposition effect. A new stock has just been issued at a price
of $50, so all investors in this stock purchased the stock today. A year from now the stock will be
taken over, for a price of $60 or $40 depending on the news that comes out over the year. The
stock will pay no dividends. Investors will sell the stock whenever the price goes up by more than
10%.
a. Suppose good news comes out in 6 months (implying the takeover offer will be $60). What
equilibrium price will the stock trade for after the news comes out, that is, the price that
equates supply and demand?
b. Assume that you are the only investor who does not suffer from the disposition effect and
your trades are small enough to not affect prices. Without knowing what will actually
transpire, what trading strategy would you instruct your broker to follow?
13-14. Davita Spencer is a manager at Half Dome Asset Management. She can generate an alpha of 2%
a year up to $100 million. After that her skills are spread too thin, so she cannot add value, and
her alpha is zero. Half Dome charges a fee of 1% per year on the total amount of money under
management (at the beginning of each year). Assume that there are always investors looking for
positive alpha and no investor would invest in a fund with a negative alpha. In equilibrium, that
is, when no investor either takes out money or wishes to invest new money,
a. What alpha do investors in Davita’s fund expect to receive?
b. How much money will Davita have under management?
c. How much money will Half Dome generate in fee income?
13-15. Allison and Bill are both mutual fund managers, although Allison is more skilled than Bill. Both
have $100 million in assets under management and charge a fee of 1%/year. Allison is able to
generate a 2% alpha before fees and Bill is able to generate a 1% alpha before fees.
a. What is the alpha investors earn in each fund (that is, the alpha after fees are taken out)?
b. Which fund will experience an inflow of funds?
c. Assume that both managers have exhausted the supply of good investment opportunities and
so they will choose to invest any new funds received in the market portfolio and so those
funds will earn a zero alpha. How much new capital will flow into each fund?
d. Once the new funds have stopped flowing, what is the alpha before and after fees of each
fund? Which fund will be larger?
e. Calculate each manager’s compensation once the capital has stopped flowing. Which
manager has higher compensation?
13–16. Assume the economy consisted of three types of people. 50% are fad followers, 45% are passive
investors (they have read this book and so hold the market portfolio), and 5% are informed
traders. The portfolio consisting of all the informed traders has a beta of 1.5 and an expected
return of 15%. The market expected return is 11%. The risk-free rate is 5%.
a. What alpha do the informed traders make?
b. What is the alpha of the passive investors?
c. What is the expected return of the fad followers?
d. What alpha do the fad followers make?
13–17. Explain what the size effect is.
13–18. Assume all firms have the same expected dividends. If they have different expected returns, how
will their market values and expected returns be related? What about the relation between their
dividend yields and expected returns?
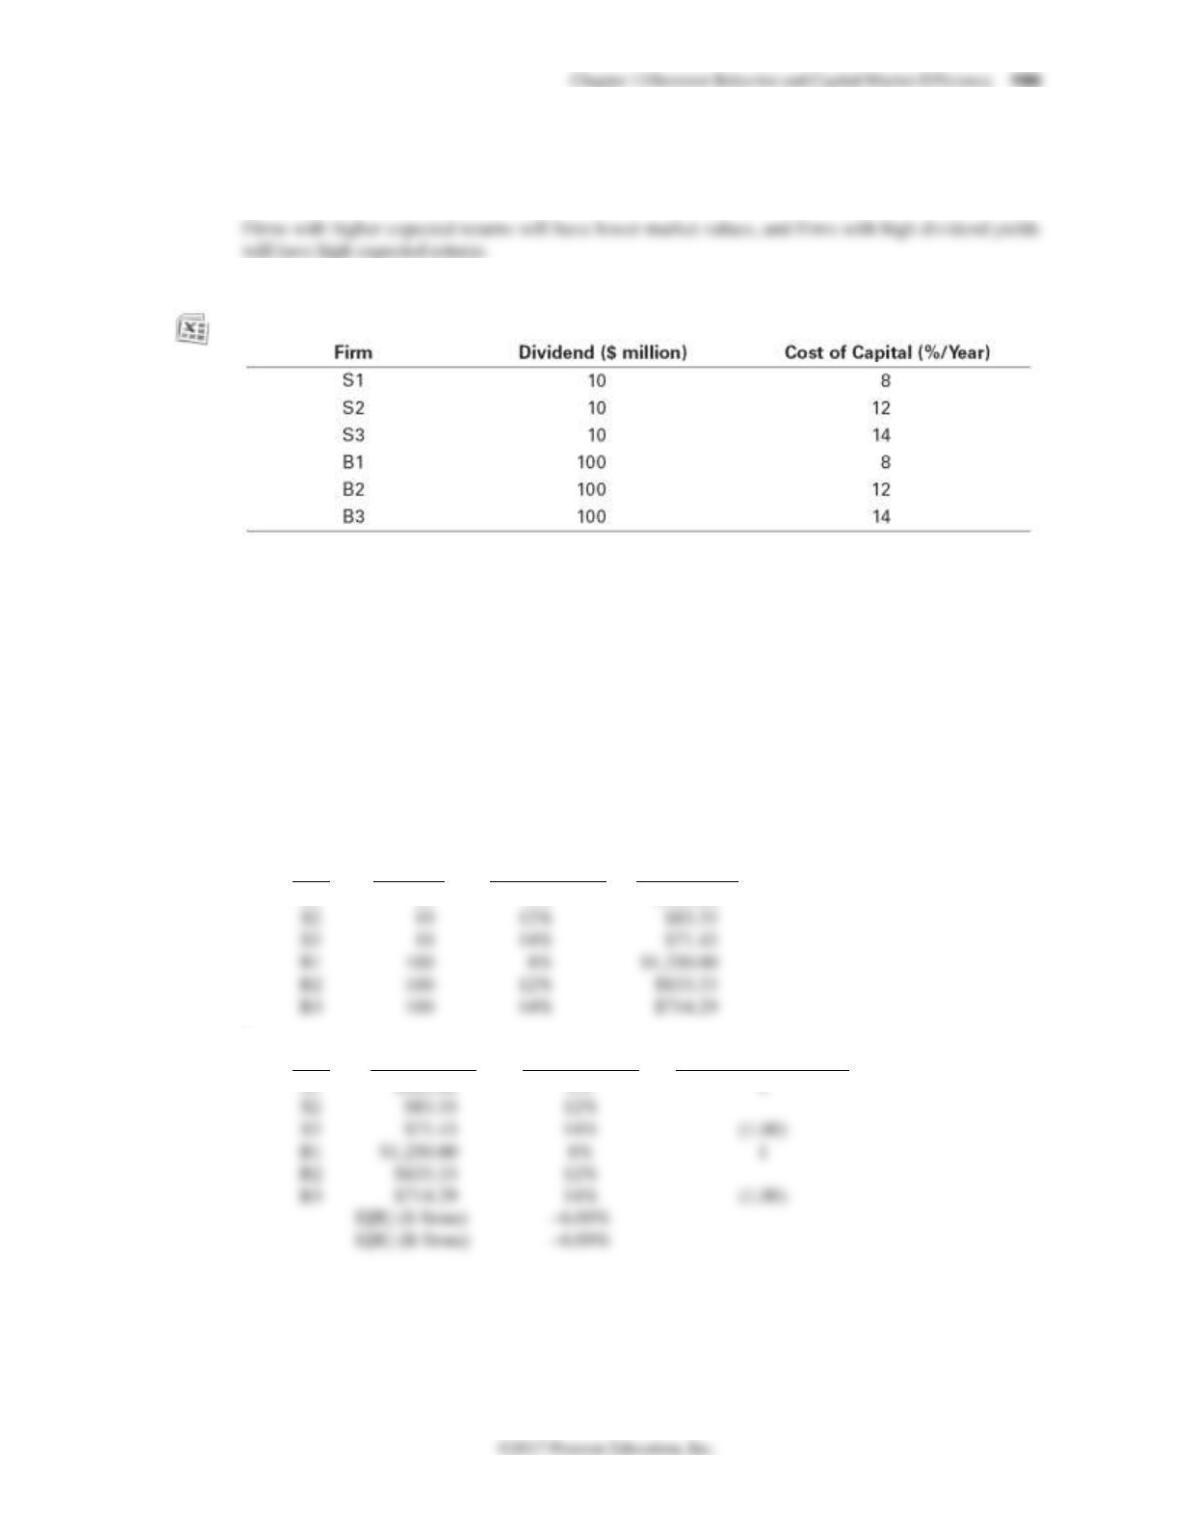
13–19. Each of the six firms in the table below is expected to pay the listed dividend payment every year
in perpetuity.
a. Using the cost of capital in the table, calculate the market value of each firm.
b. Rank the three S firms by their market values and look at how their cost of capital is
ordered. What would be the expected return for a self–financing portfolio that went long on
the firm with the largest market value and shorted the firm with the lowest market value?
(The expected return of a self-financing portfolio is the weighted average return of the
constituent securities.) Repeat using the B firms.
c. Rank all six firms by their market values. How does this ranking order the cost of capital?
What would be the expected return for a self-financing portfolio that went long on the firm
with the largest market value and shorted the firm with the lowest market value?
d. Repeat part (c) but rank the firms by the dividend yield instead of the market value. What
can you conclude about the dividend yield ranking compared to the market value ranking?
a.
Firm
Dividend
Cost of Capital
Market value
S1
10
8%
$125.00
S2
10
S3
10
8%
$1,250.00
$833.33
$714.29
b.
Firm
Market Value
Cost of Capital
Self financing weights
S1
$125.00
8%
1
S2
S3
8%
1
$833.33
$714.29
196 Berk/DeMarzo, Corporate Finance, Fourth Edition
c.
Firm
Market Value
Cost of Capital
Self financing weights
B1
$1,250.00
8%
1
B2
$833.33
B3
$714.29
S1
$125.00
8%
S2
S3
d.
Firm
Market Value
Dividend
yield/Cost of
Capital
Self financing weights
S1
$125.00
8%
(1.00)
B1
$1,250.00
8%
S2
B2
$833.33
S3
B3
$714.29
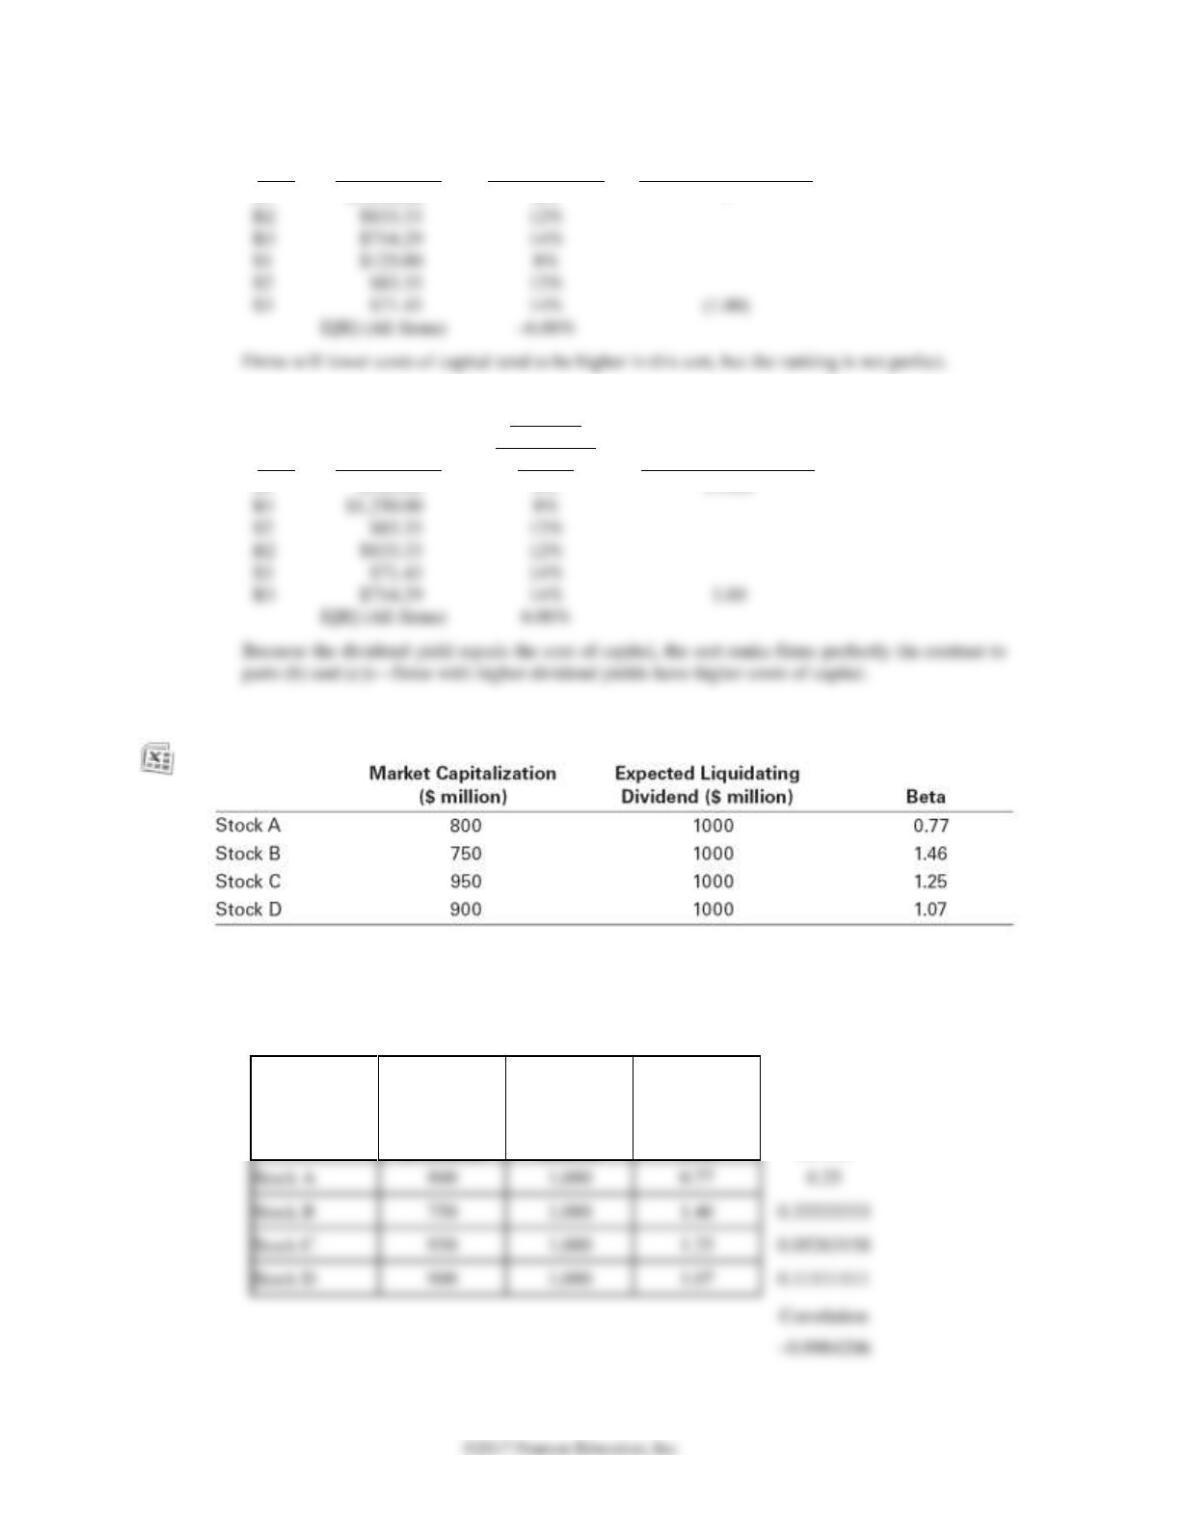
13–20. Consider the following stocks, all of which will pay a liquidating dividend in a year and nothing
in the interim:
a. Calculate the expected return of each stock.
b. What is the sign of correlation between the expected return and market capitalization of the
stocks?
Market
Capitalization
($ million)
Total
Liquidating
Dividend ($
million)
Beta
Expected
Return
Correlation
Chapter 13/Investor Behavior and Capital Market Efficiency 197
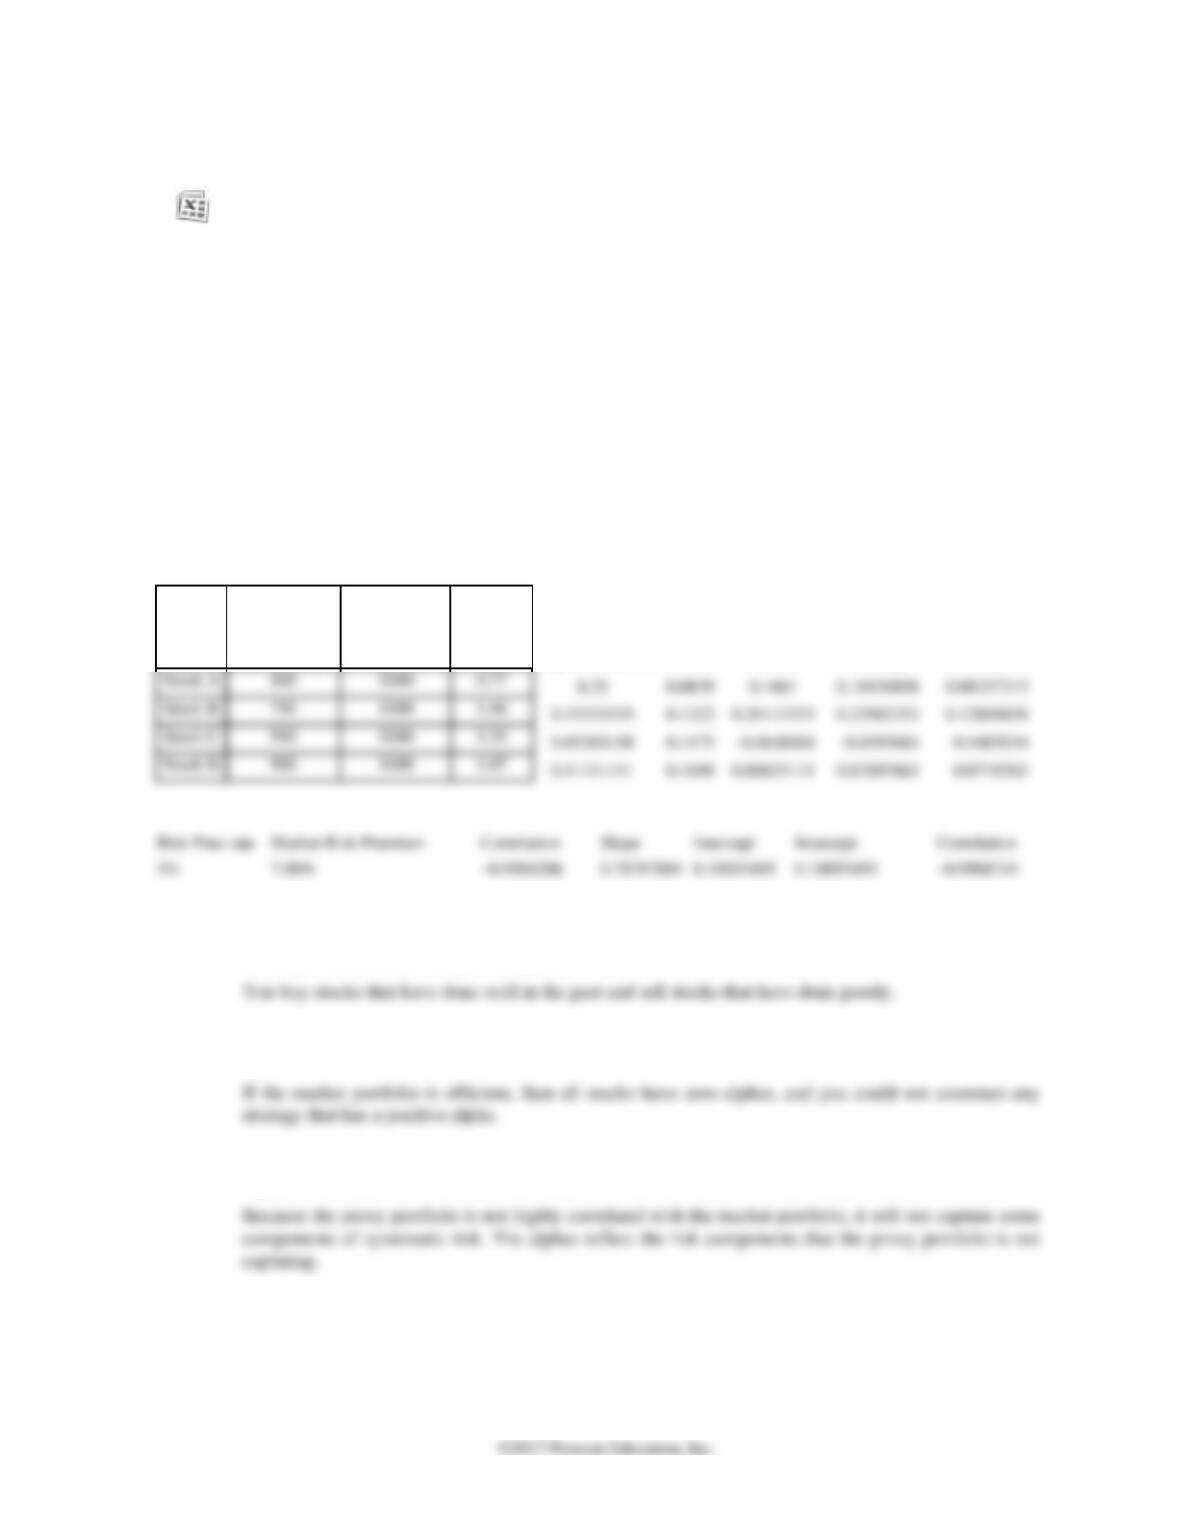
13–21. In Problem 19, assume the risk-free rate is 3% and the market risk premium is 7%.
a. What does the CAPM predict the expected return for each stock should be?
b. Clearly, the CAPM predictions are not equal to the actual expected returns so the CAPM
does not hold. You decide to investigate this further. To see what kind of mistakes the
CAPM is making, you decide to regress the actual expected return onto the expected return
predicted by the CAPM. What is the intercept and slope coefficient of this regression?
c. What are the residuals of the regression in (d)? That is, for each stock, compute the
difference between the actual expected return and the best fitting line given by the intercept
and slope coefficient in (b).
d. What is the sign of the correlation between the residuals you calculated in (e) and market
capitalization?
e. What can you conclude from your answers to part (b) of the previous problem and part (d)
of this problem about the relation between firm size (market capitalization) and returns?
(The results do not depend on the particular numbers in this problem. You are welcome to
verify this for yourself by redoing the problems with another value for the market risk
premium, and by picking the stock betas and market capitalizations randomly.)
Market
Capitalization
($ million)
Total
Liquidating
Dividend ($
million)
Beta
Expected Return
CAPM
Error
Residual +
Intercept
Just Residual
Risk Free rate
Market Risk Premium
Correlation
Slope
Intercept
Intercept
Correlation
7.00%
0.78297881
0.10093495
0.10093495
13–22. Explain how to construct a positive-alpha trading strategy if stocks that have had relatively high
returns in the past tend to have positive alphas, and stocks that have had relatively low returns
in the past tend to have negative alphas.
13–23. If you can use past returns to construct a trading strategy that makes money (has a positive
alpha), it is evidence that market portfolio is not efficient. Explain why.
13–24. Explain why you might expect stocks to have nonzero alphas if the market proxy portfolio is not
highly correlated with the true market portfolio, even if the true market portfolio is efficient.
13–25. Explain why, if some investors are subject to systematic behavioral biases while others pick
efficient portfolios, the market portfolio will not be efficient.
13–26. Explain why an employee who cares only about expected return and volatility will likely
underweight the amount of money he invests in his own company’s stock relative to an investor
who does not work for his company.
For Problems 27–29, refer to the following table of estimated factor betas based on data from 2005-2015.
Factor
MSFT
XOM
GE
MKT
0.965
0.808
1.183
HML
0.196
0.965
PR1YR
0.089
0.376
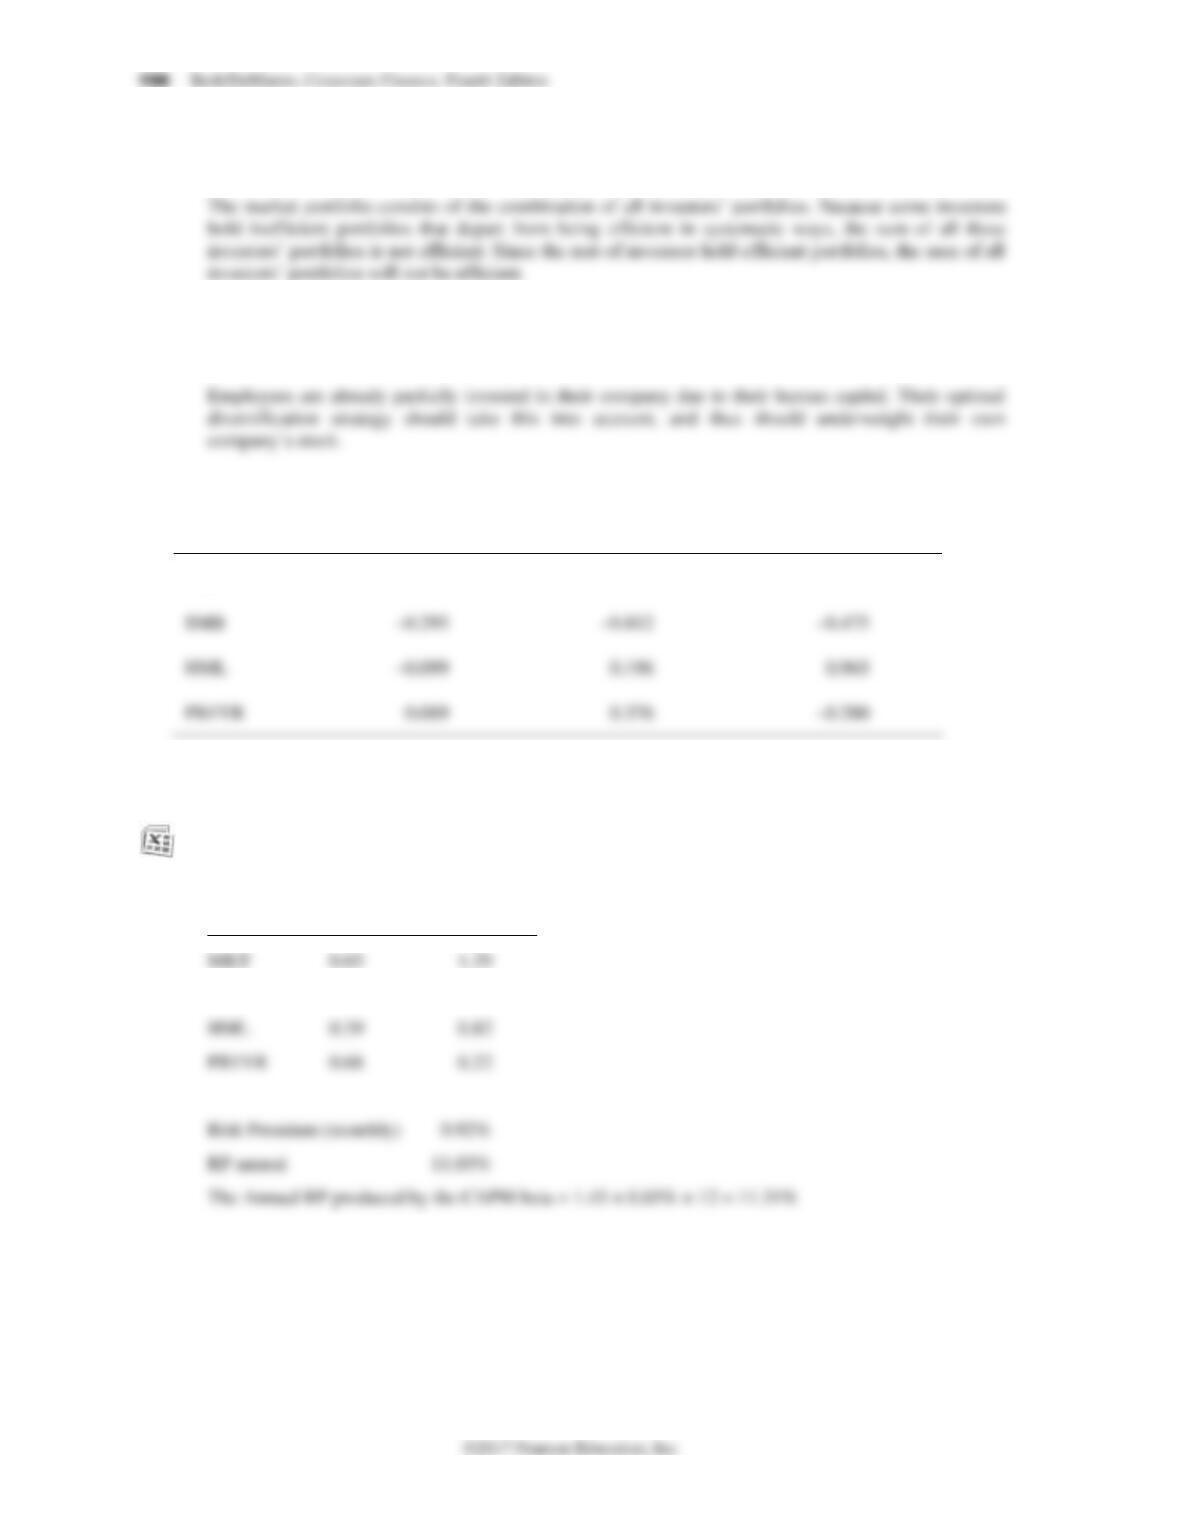
13–27. Using the factor beta estimates in the table shown here and the monthly expected return
estimates in Table 13.1, calculate the risk premium of General Electric stock (ticker: GE) using
the FFC factor specification. (Annualize your result by multiplying by 12.) GE’s CAPM beta
over the same time period was 1.45. How does the risk premium you would estimate from the
CAPM compare?
Factor GE
SMB 0.23 –0.39
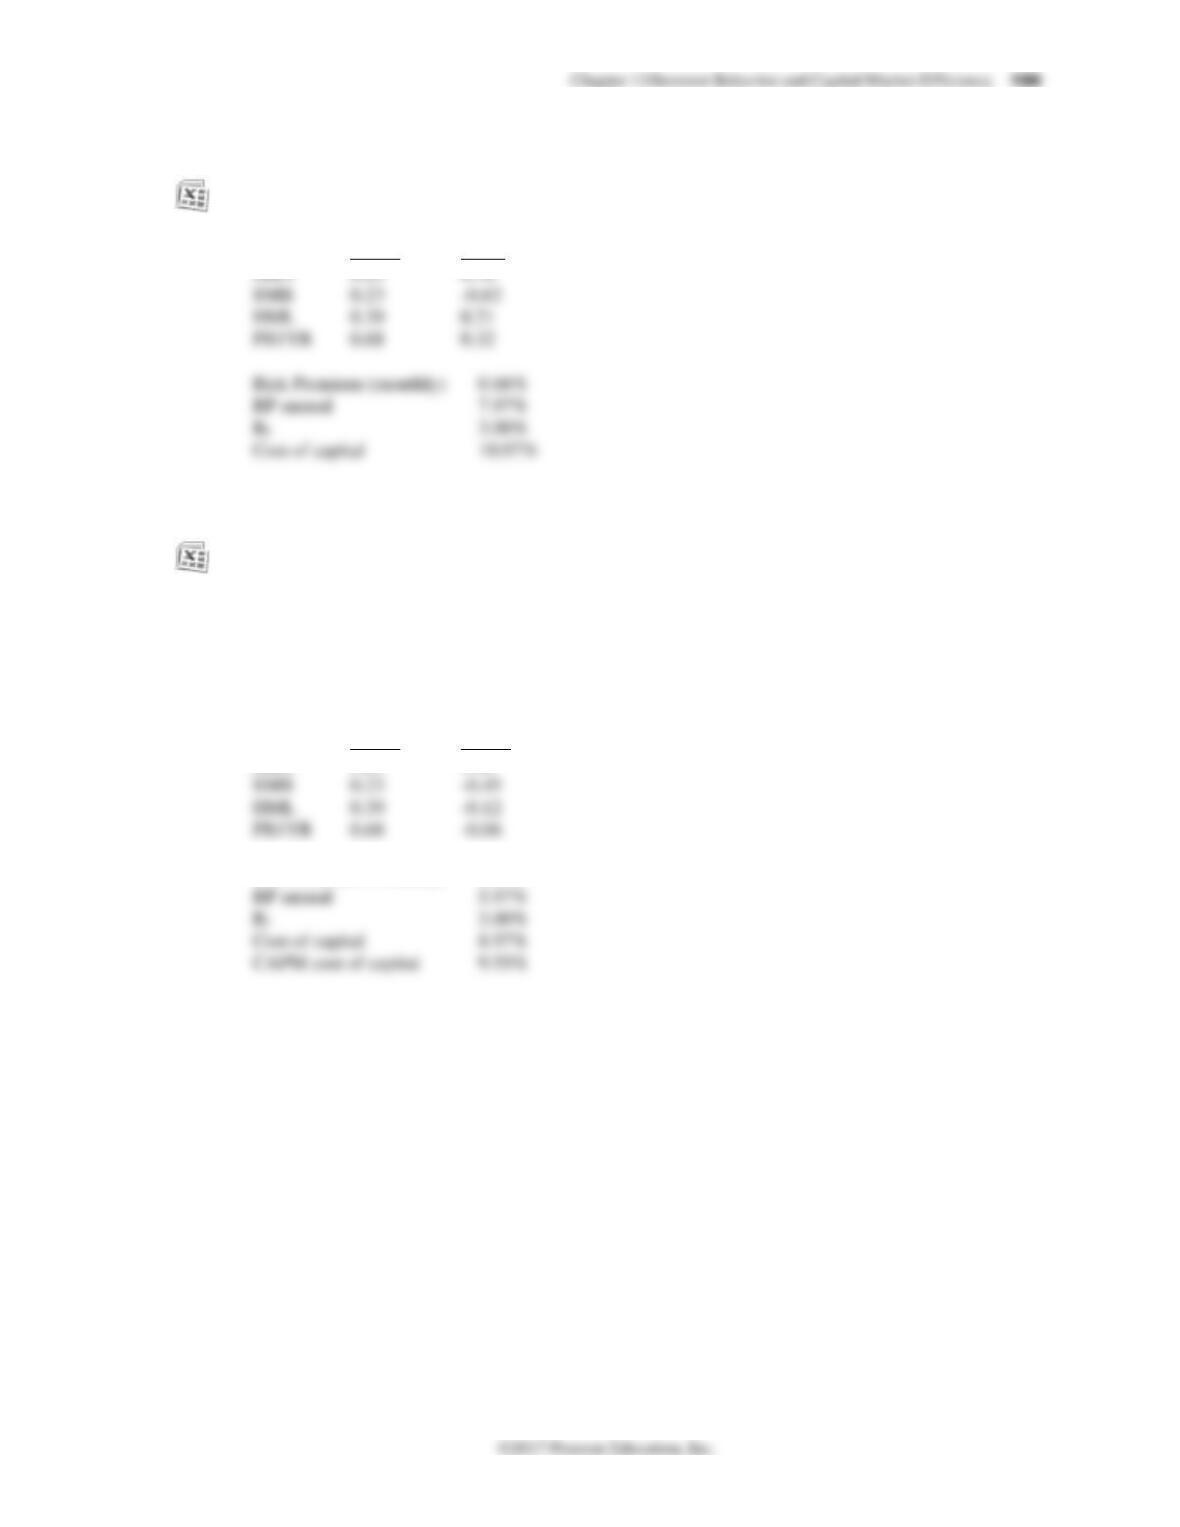
13–28. You are currently considering an investment in a project in the energy sector. The investment
has the same riskiness as Exxon Mobil stock (ticker: XOM). Using the data in Table 13.1 and the
table above, calculate the cost of capital using the FFC factor specification if the current risk-free
rate is 3% per year.
Factor
XOM
MKT
0.65
0.78
SMB
0.23
HML
0.39
0.21
PR1YR
0.68
0.32
Risk Premium (monthly)
0.66%
RP annual
7.97%
3.00%
Cost of capital
10.97%
13–29. You work for Microsoft Corporation (ticker: MSFT), and you are considering whether to
develop a new software product. The risk of the investment is the same as the risk of the
company.
a. Using the data in Table 13.1 and in the table above, calculate the cost of capital using the
FFC factor specification if the current risk-free rate is 3% per year.
b. Microsoft’s CAPM beta over the same period was 0.84. What cost of capital would you
estimate using CAPM?
Factor
MSFT
MKT
0.65
1.06
SMB
0.23
-0.45
HML
0.39
-0.12
PR1YR
0.68
-0.06
Risk Premium (monthly)
0.50%
RP annual
5.97%
3.00%
Cost of capital
8.97%
CAPM cost of capital
9.55%