Chapter 12
Corporate Valuation and Financial Planning
ANSWERS TO END-OF-CHAPTER QUESTIONS
12-1 a. The operating plan provides detailed implementation guidance designed to accomplish
corporate objectives. It details who is responsible for what particular function, and
when specific tasks are to be accomplished. The financial plan details the financial
aspects of the corporation’s operating plan.
b. Spontaneous liabilities are the first source of expansion capital as these accounts
increase automatically through normal business operations. Examples of spontaneous
liabilities include accounts payable, accrued wages, and accrued taxes. No interest is
normally paid on these spontaneous liabilities; however, their amounts are limited due
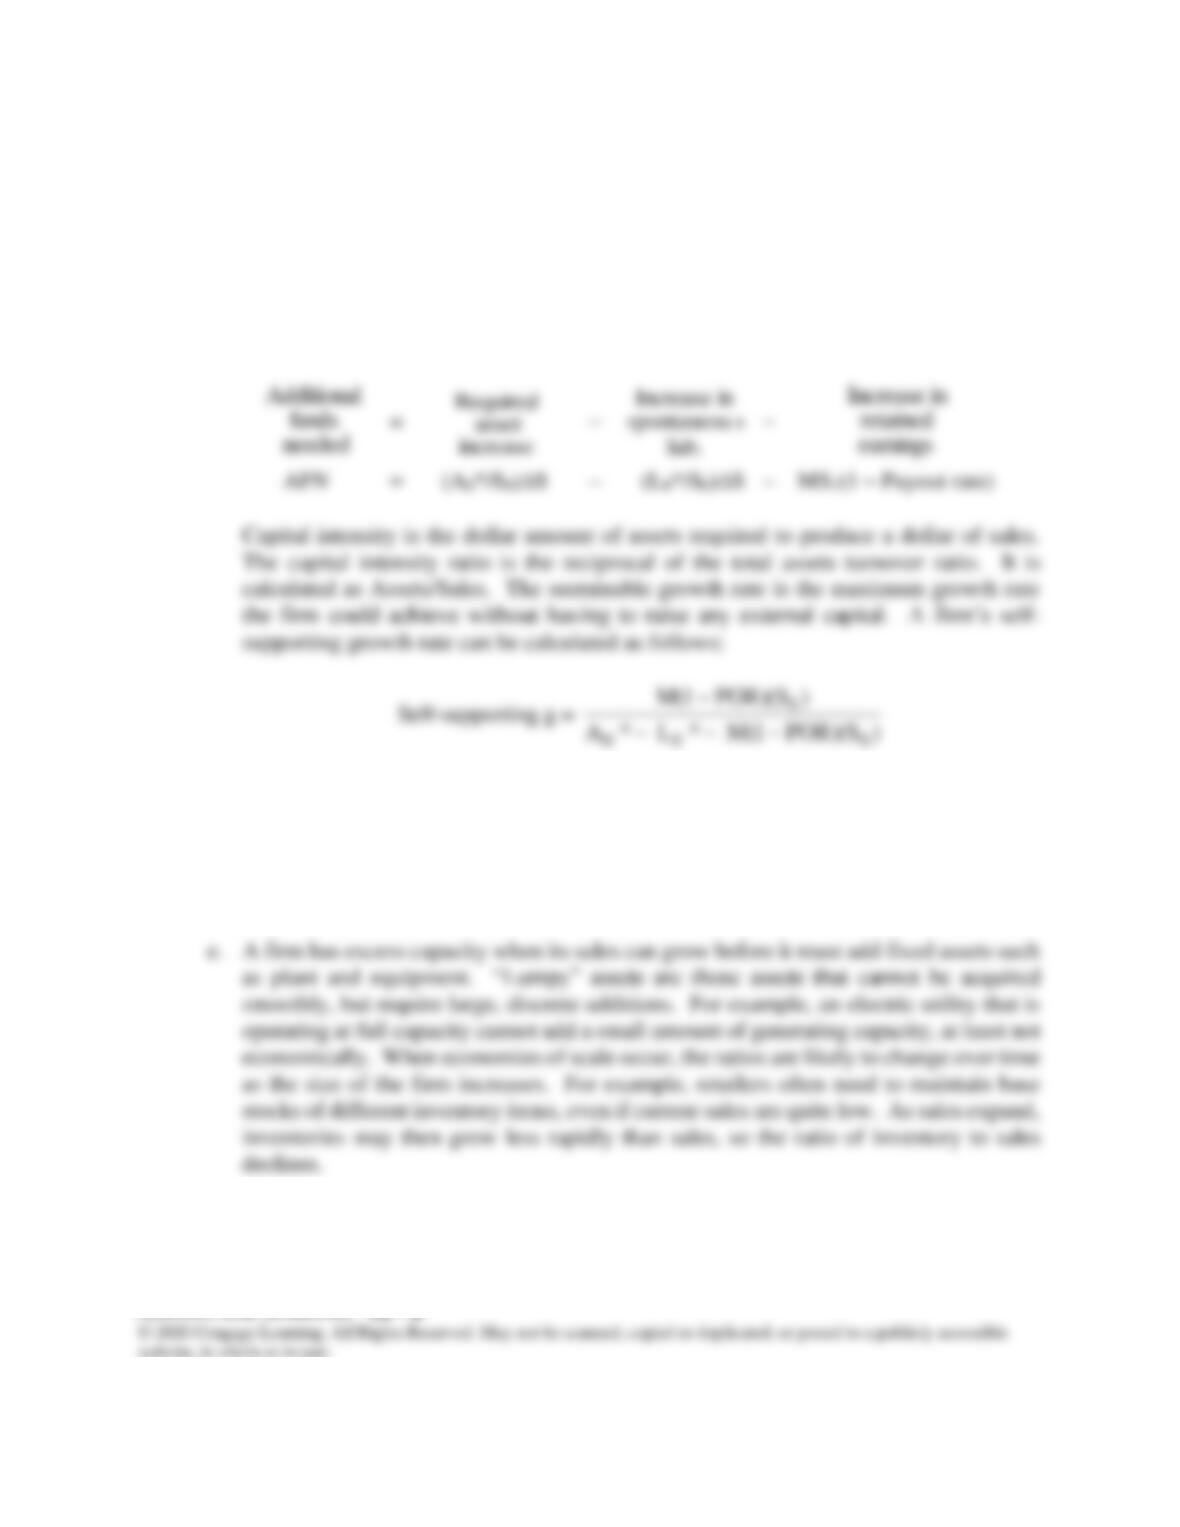
c. Additional funds needed (AFN) are those funds required from external sources to
increase the firm’s assets to support a sales increase. A sales increase will normally
require an increase in assets. However, some of this increase is usually offset by a
spontaneous increase in liabilities as well as by earnings retained in the firm. Those
funds that are required but not generated internally must be obtained from external
sources. Although most firms’ forecasts of capital requirements are made by
developing forecasted financial statements, the AFN formula is sometimes used as an
approximation of financial requirements. It is written as follows:
d. The forecasted financial statement approach using percent of sales develops a complete
set of financial statements that can be used to calculate projected EPS, free cash flow,
various other financial ratios, and a projected stock price. This approach first forecasts
sales, the required assets, the funds that will be spontaneously generated, and then net
income, dividends, and retained earnings.
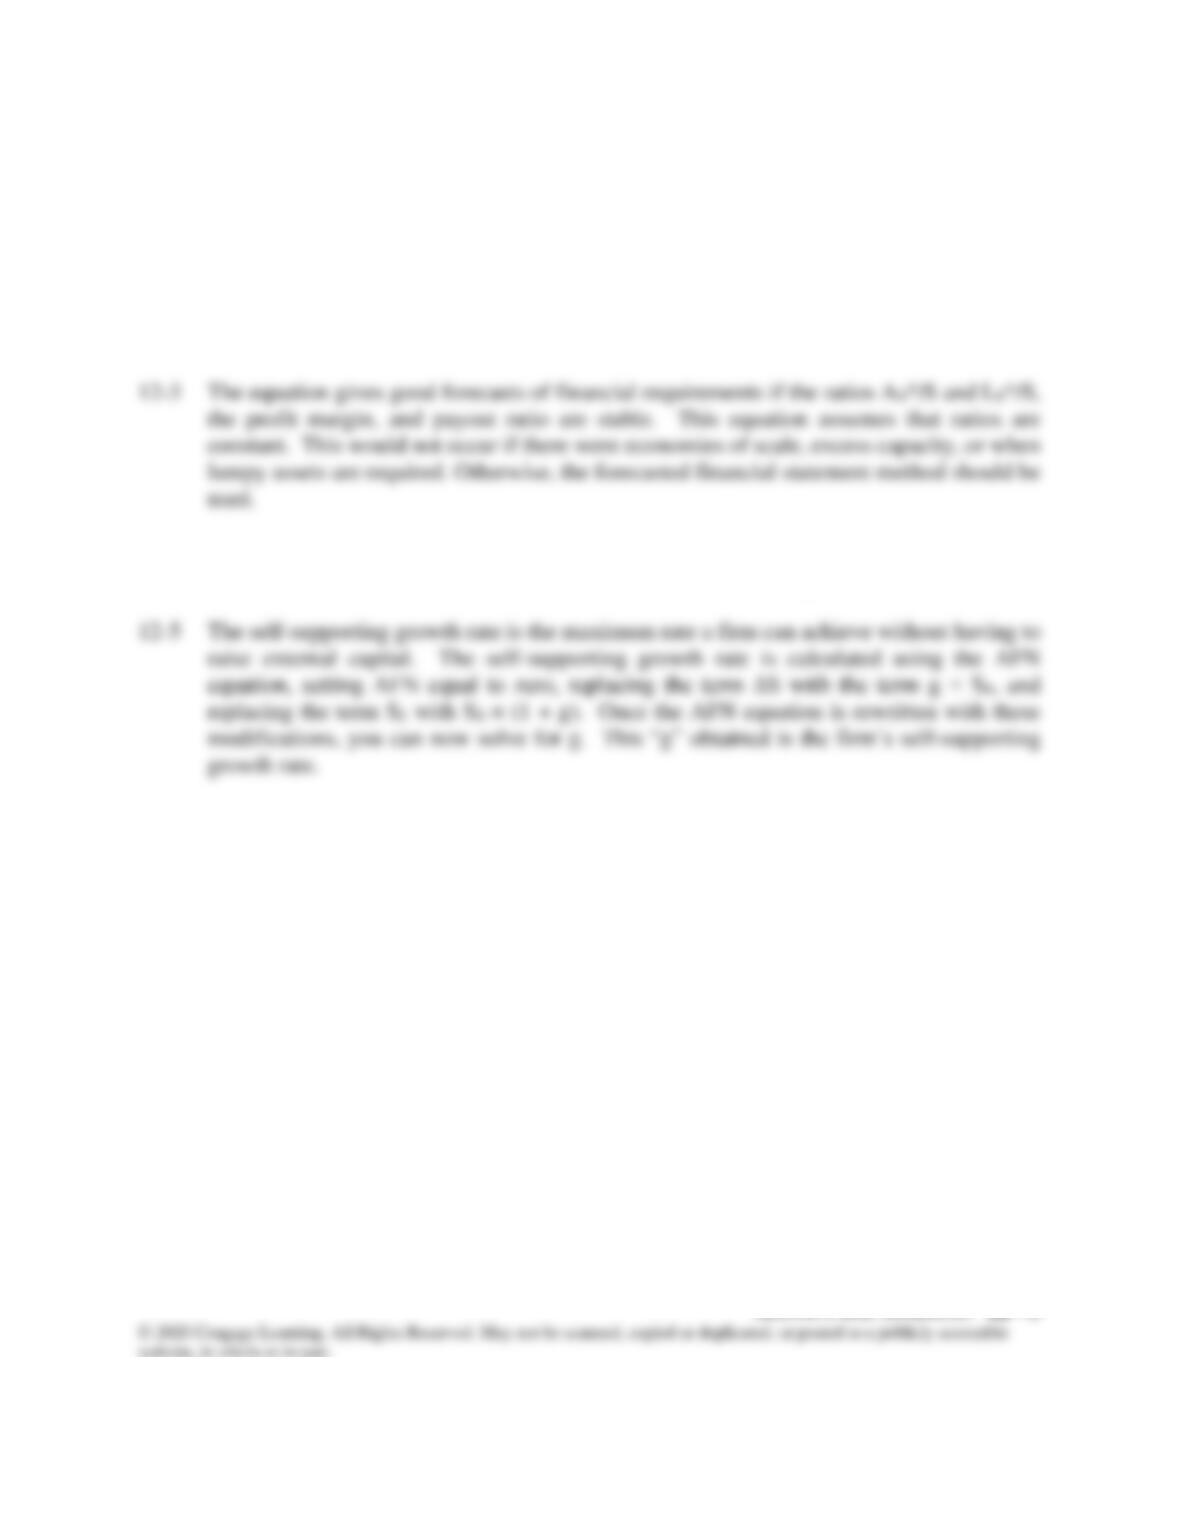
f. Full capacity sales are calculated as actual sales divided by the percentage of capacity
at which fixed assets were operated. The target fixed assets to sales ratio is calculated
as actual fixed assets divided by full capacity sales. The required level of sales is
calculated as the target fixed assets to sales ratio multiplied by the projected sales level.
12-2 Accounts payable, accrued wages, and accrued taxes increase spontaneously. Retained
earnings may or may not increase, depending on profitability and dividend payout policy.
12-4 The five key factors that impact a firm’s external financing requirements are: Sales growth,
capital intensity, spontaneous liabilities-to-sales ratio, profit margin, and payout ratio.
12-6 a. +.
b. +. It reduces spontaneous funds; however, it may eventually increase retained earnings.
c. +.
d. +.
e. –.
f. –.
SOLUTIONS TO END-OF-CHAPTER PROBLEMS
12-2 Cash/Sales = $100/$1,000 = 10.0%
AR/Sales = $200/$1,000 = 20.0%
Inventories/Sales = $200/$1,000 = 20.0%
Net fixed assets = $500/$1,000 = 50.0%
Projected sales = (1 + 0.1)($1,000) = $1,100
Projections:
Cash = 10.0% $1,100 = $110
Accounts receivable = 20.0% $1,100 = $220
Inventories = 20.0% $1,100 = $220
Net fixed assets = 50.0% $1,100 = $550
Total operating assets = $1,100
12-3 AP/Sales = $1,000/$10,000 = 10%
Accruals/Sales = $1,000/$10,000 = 10%
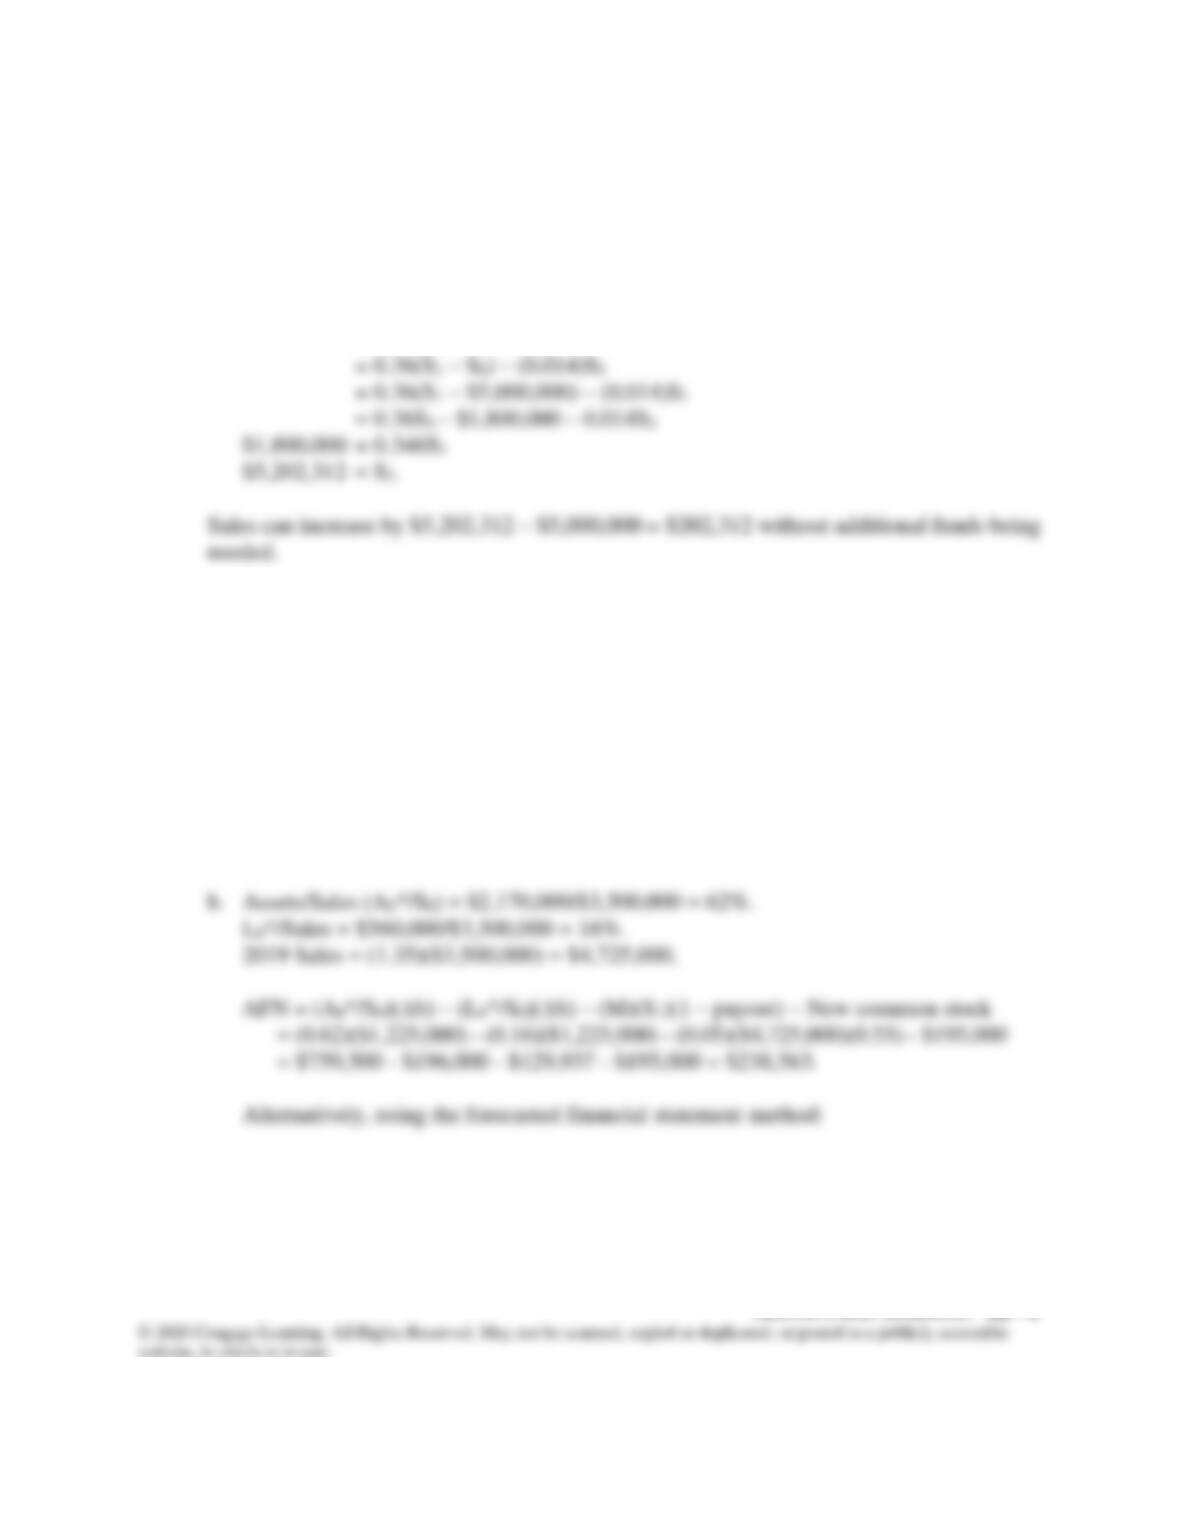
12-4 S0 = $5,000,000; A0* = $2,500,000; CL = $700,000; NP = $300,000; AP = $500,000;
Accruals = $200,000; M = 7%; payout ratio = 80%; A0*/S0 = 0.50; L0* = (AP +
Accruals)/S0 = ($500,000 + $200,000)/$5,000,000 = 0.14.
AFN = (A0*/S0)∆S – (L0*/S0)∆S – (M)(S1)(1 – payout rate)
= (0.50)∆S – (0.14) ∆S – (0.07)(S1)(1 – 0.8)
= (0.50)∆S – (0.14)∆S – (0.014)S1
= (0.36)∆S – (0.014)S1
12-5 a.
equity and
liab. Total
=
payable
Accounts
+
debt
term–Long
+
stock
Common
+
earnings
Retained
$2,170,000 = $560,000 + Long-term debt + $625,000 + $395,000
Long-term debt = $590,000.
Total liab. = Accounts payable + Long-term debt
= $560,000 + $590,000 = $1,150,000.
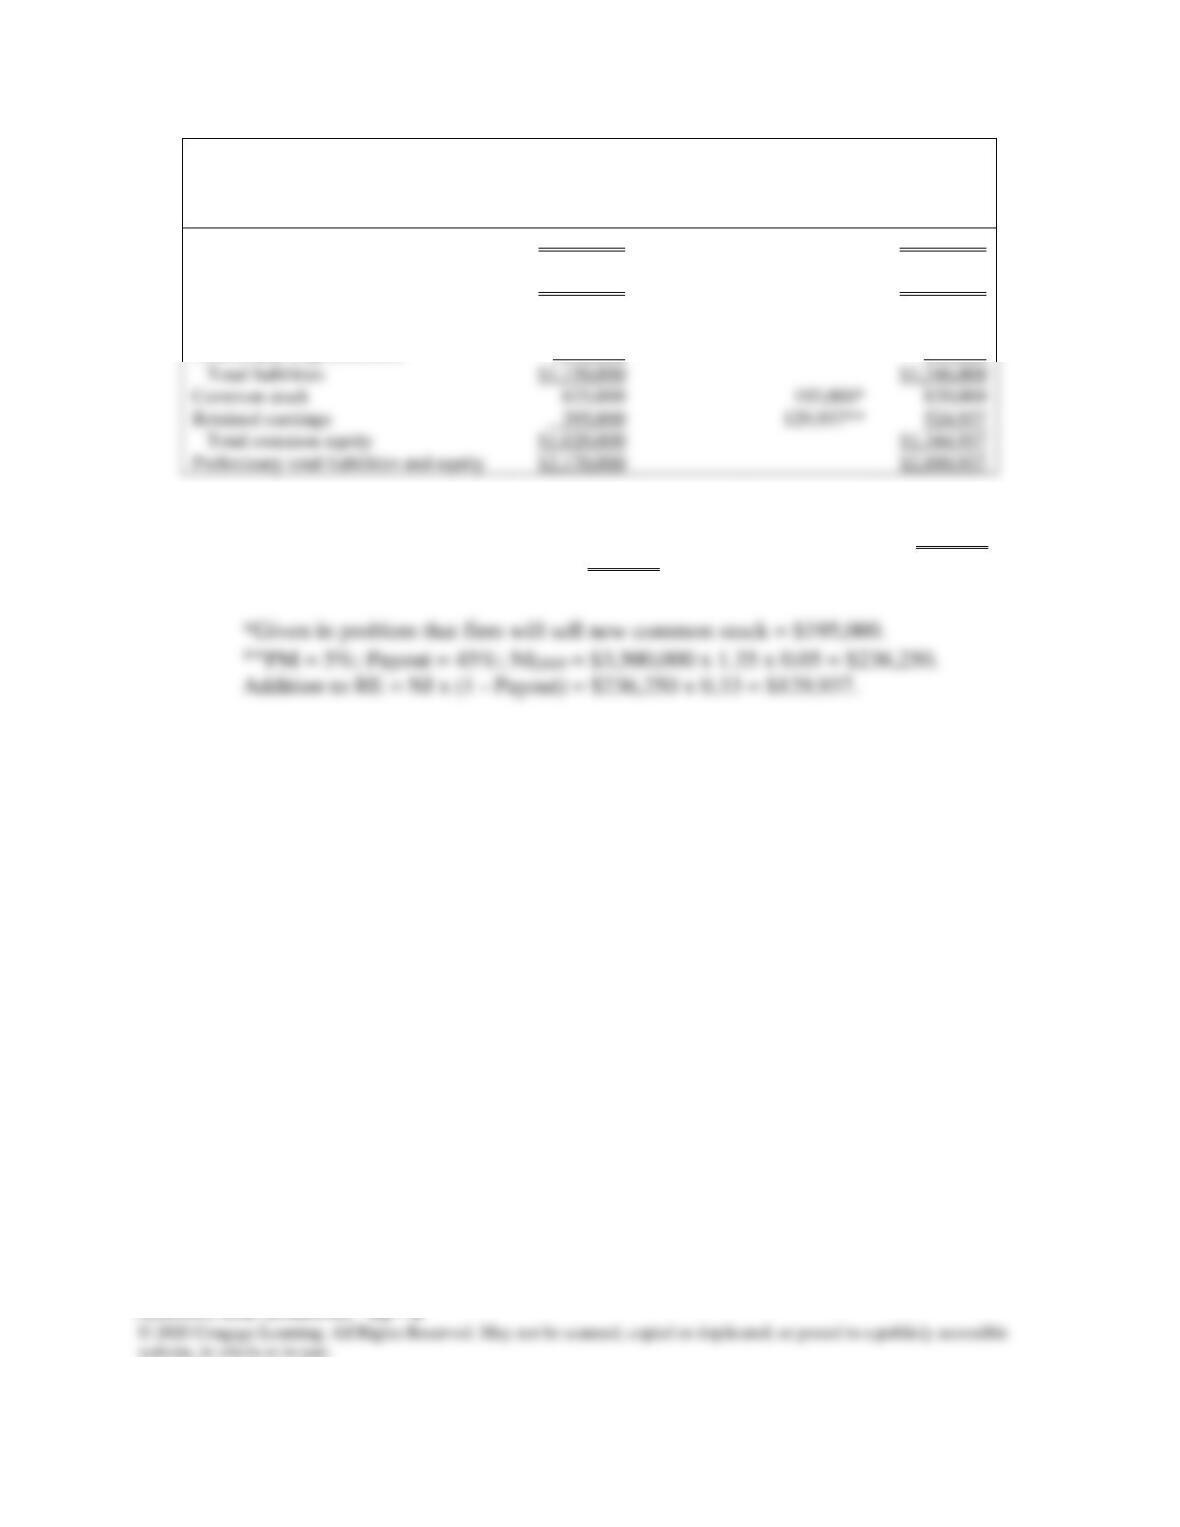
2019
Forecast
basis is %
of 2019
Sales
Additions
(New
Financing and
ΔRE)
2020
Sales
$3.500,000
$4,725,000
Total assets
$2,170,000
0.62
$2,929,500
Current liabilities
$ 560,000
0.16
$ 756,000
Preliminary long-term debt
$1,150,000
$1,346,000
Common stock
Retained earnings
$1,020,000
$1,344,937
Preliminary total liabilities and equity
$2,170,000
$2,690,937
AFN = Total assets – Preliminary total liabilities & equity = S2,929,500 – 2,690,937 = $238,563
AFN = Additional required long-term debt =$238,563
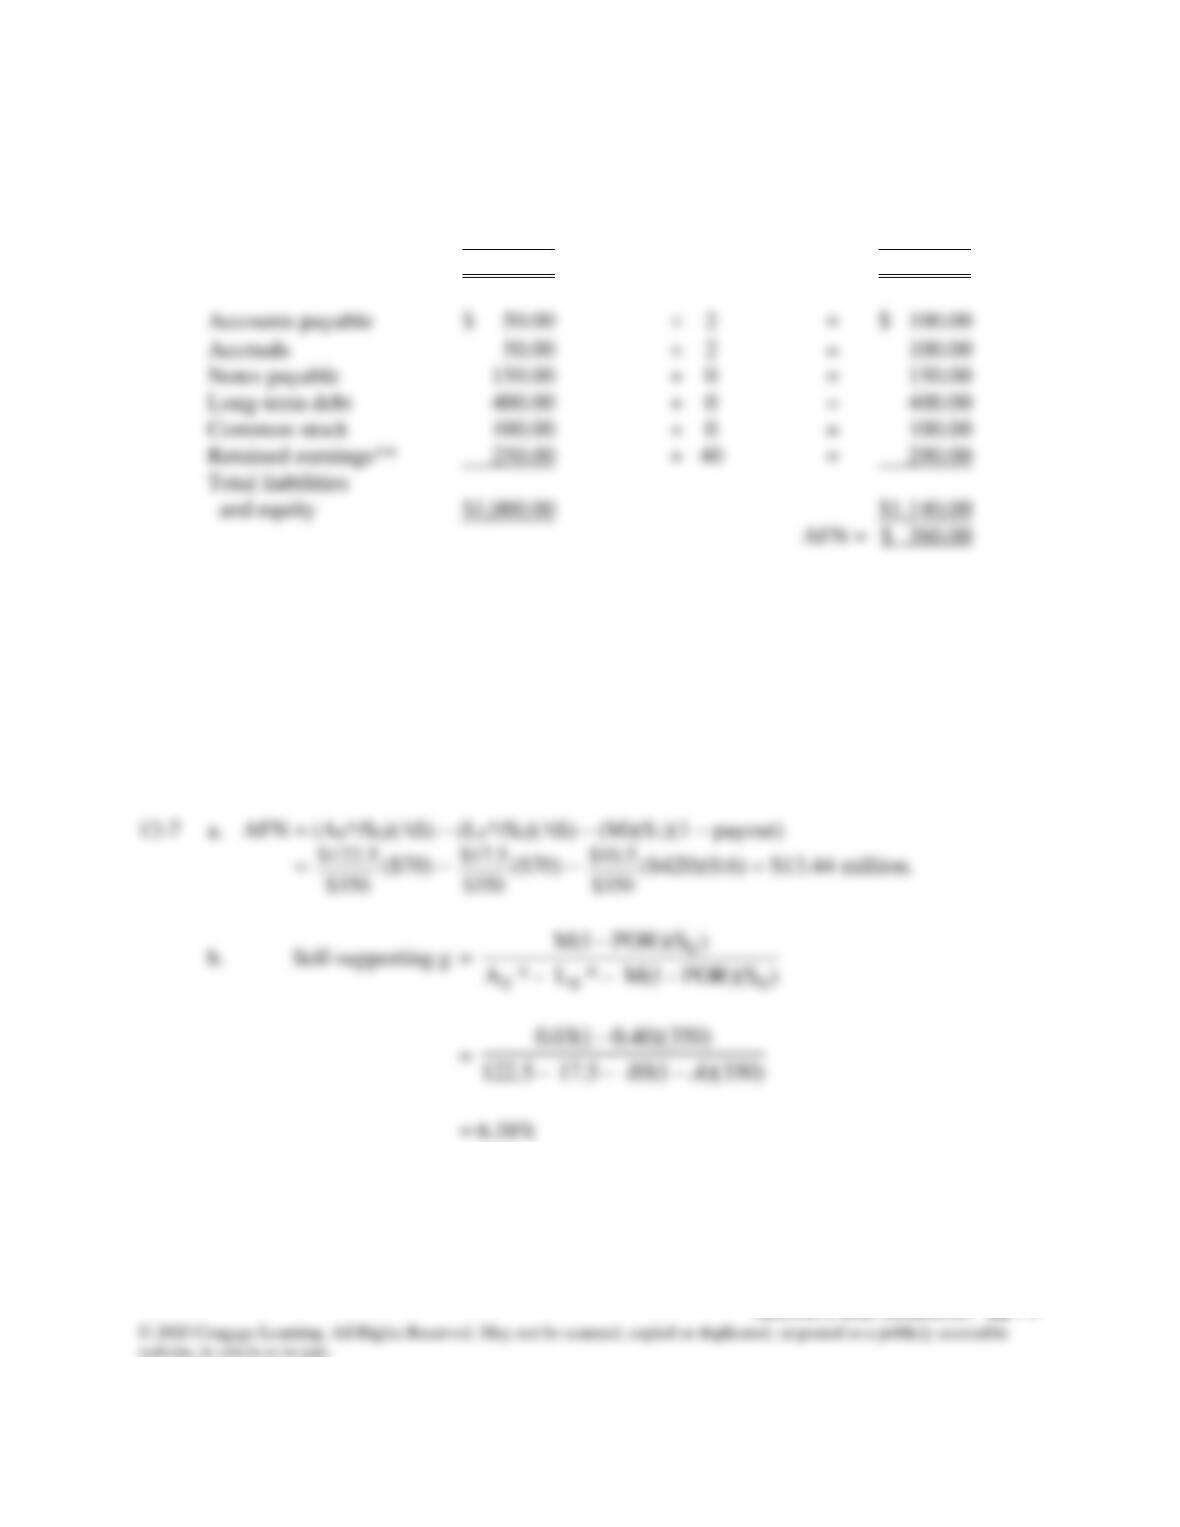
12-6 Cash $ 100.00 2.0 = $ 200.00
Accounts receivable 200.00 2.0 = 400.00
Inventories 200.00 2.0 = 400.00
Net fixed assets* 500.00 1.0 = 500.00
Total assets $1,000.00 $1,500.00
*Capacity sales = Sales/0.5 = $1,000/0.5 = $2,000 with respect to existing fixed assets.
Target FA/S ratio = $500/$2,000 = 0.25.
Target FA = 0.25($2,000) = $500 = Required FA. Since the firm currently has $500 of
fixed assets, no new fixed assets will be required.
**Addition to RE = (M)(S1)(1 – Payout ratio) = 0.05($2,000)(0.4) = $40.
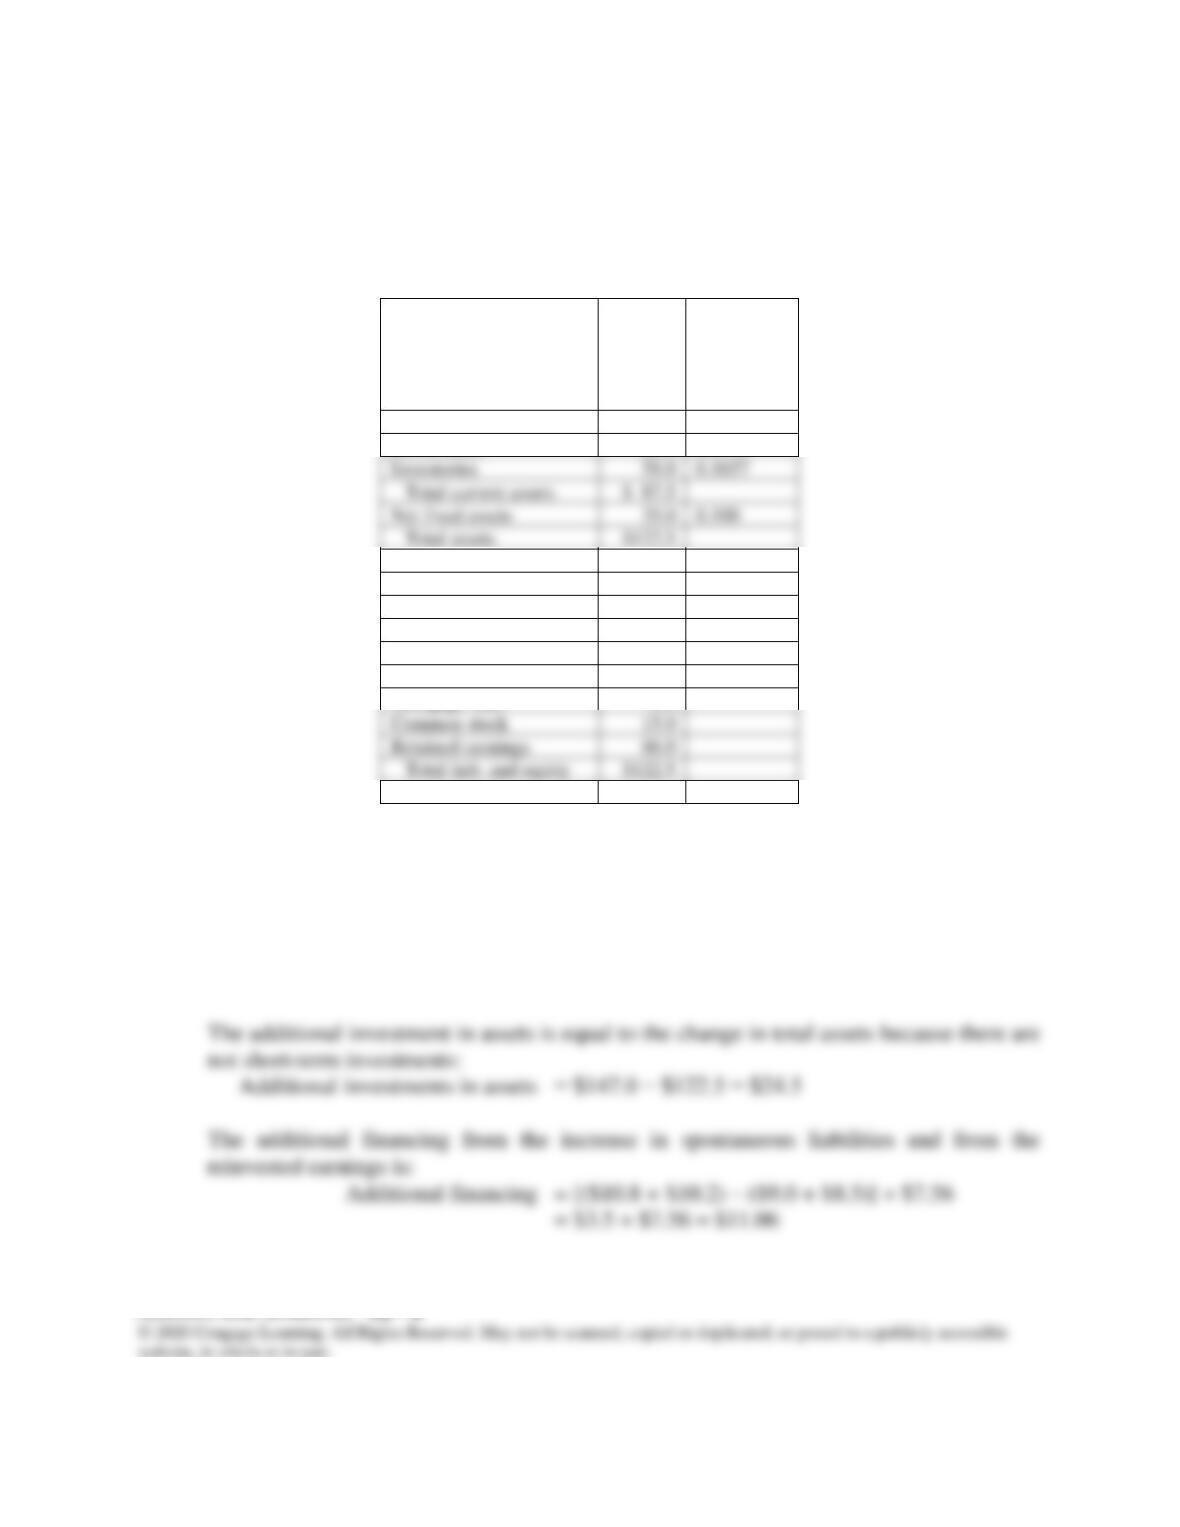
c.
Upton Computers
Pro Forma Balance Sheet
December 31, 2019
(Millions of Dollars)
2019
Forecast
Basis:
Percent of
forecasted
sales
Cash
$ 3.5
0.0100
Receivables
26.0
0.0743
Inventories
58.0
0.1657
Total current assets
$ 87.5
Net fixed assets
35.0
0.100
Total assets
Accounts payable
$ 9.0
0.0257
Notes payable
18.0
Line of credit
0.0
Accruals
8.5
0.0243
Total current liabilities
$ 35.5
Mortgage loan
6.0
Common stock
15.0
Retained earnings
66.0
Total liab. and equity
Forecasted sales = $420 million
Profit margin = M = $10.5/$350 = 3%.
Payout ratio = $4.2/$10.5 = 40%.
NI = Forecasted sales Profit margin = $350 1.2 0.03 = $12.6.
Dividends = NI(Payout ratio) = $12.6(40%) = $5.04.
Addition to RE = NI – DIV = $12.6 – $5.04 = $7.56.
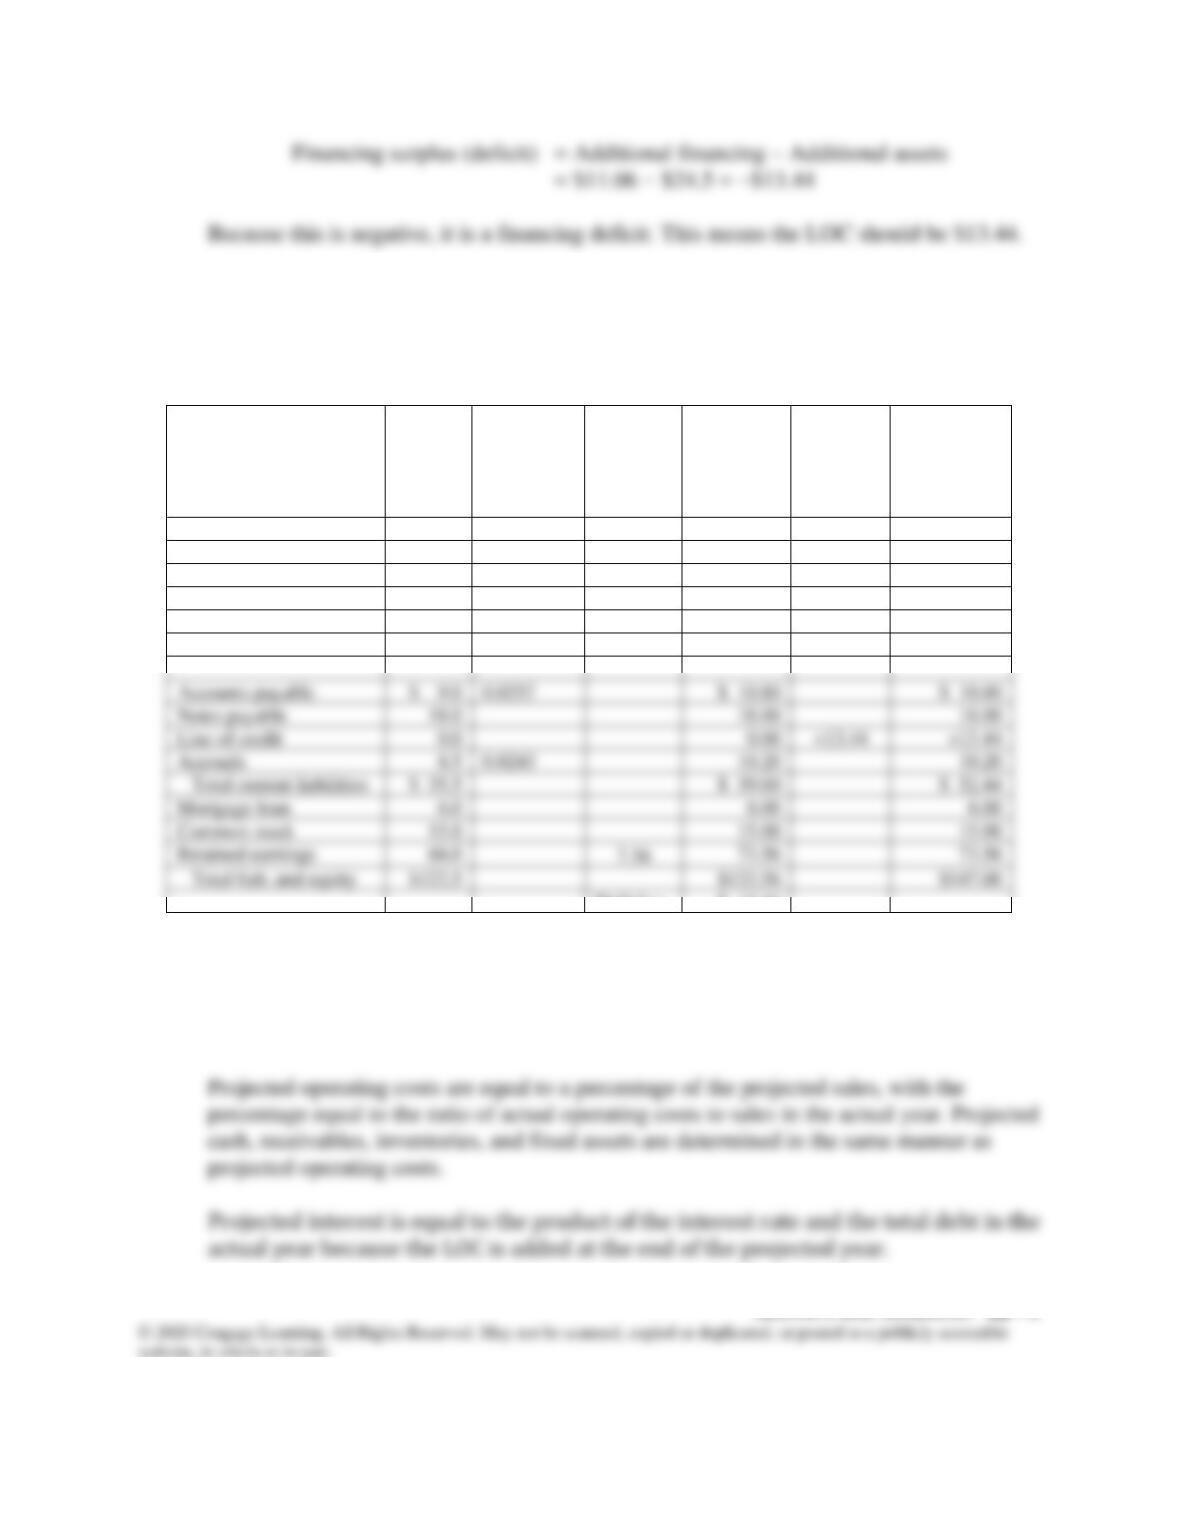
Upton Computers
Pro Forma Balance Sheet
December 31, 2020
(Millions of Dollars)
2019
Forecast
Basis:
Percent of
forecasted
sales
Additions
2020 Pro
Forma
Financing
2020 Pro
Forma after
Financing
Cash
$ 3.5
0.0100
$ 4.20
$ 4.20
Receivables
26.0
0.0743
31.20
31.20
Inventories
58.0
0.1657
69.60
69.60
Total current assets
$ 87.5
$105.00
$105.00
Net fixed assets
35.0
0.100
42.00
42.00
Total assets
$122.5
$147.00
$147.00
Accounts payable
$ 9.0
0.0257
$ 10.80
$ 10.80
Notes payable
18.0
18.00
18.00
Line of credit
+13.44
Accruals
8.5
0.0243
10.20
10.20
Total current liabilities
$ 35.5
$ 39.00
$ 52.44
Mortgage loan
Common stock
15.0
15.00
15.00
Total liab. and equity
$122.5
$133.56
$147.00
Deficit =
$ 13.44
12-8
The first column shows the financial statement accounts and the method used for
projections. Projected sales are equal to the actual sales that grow at the specified growth
rate.
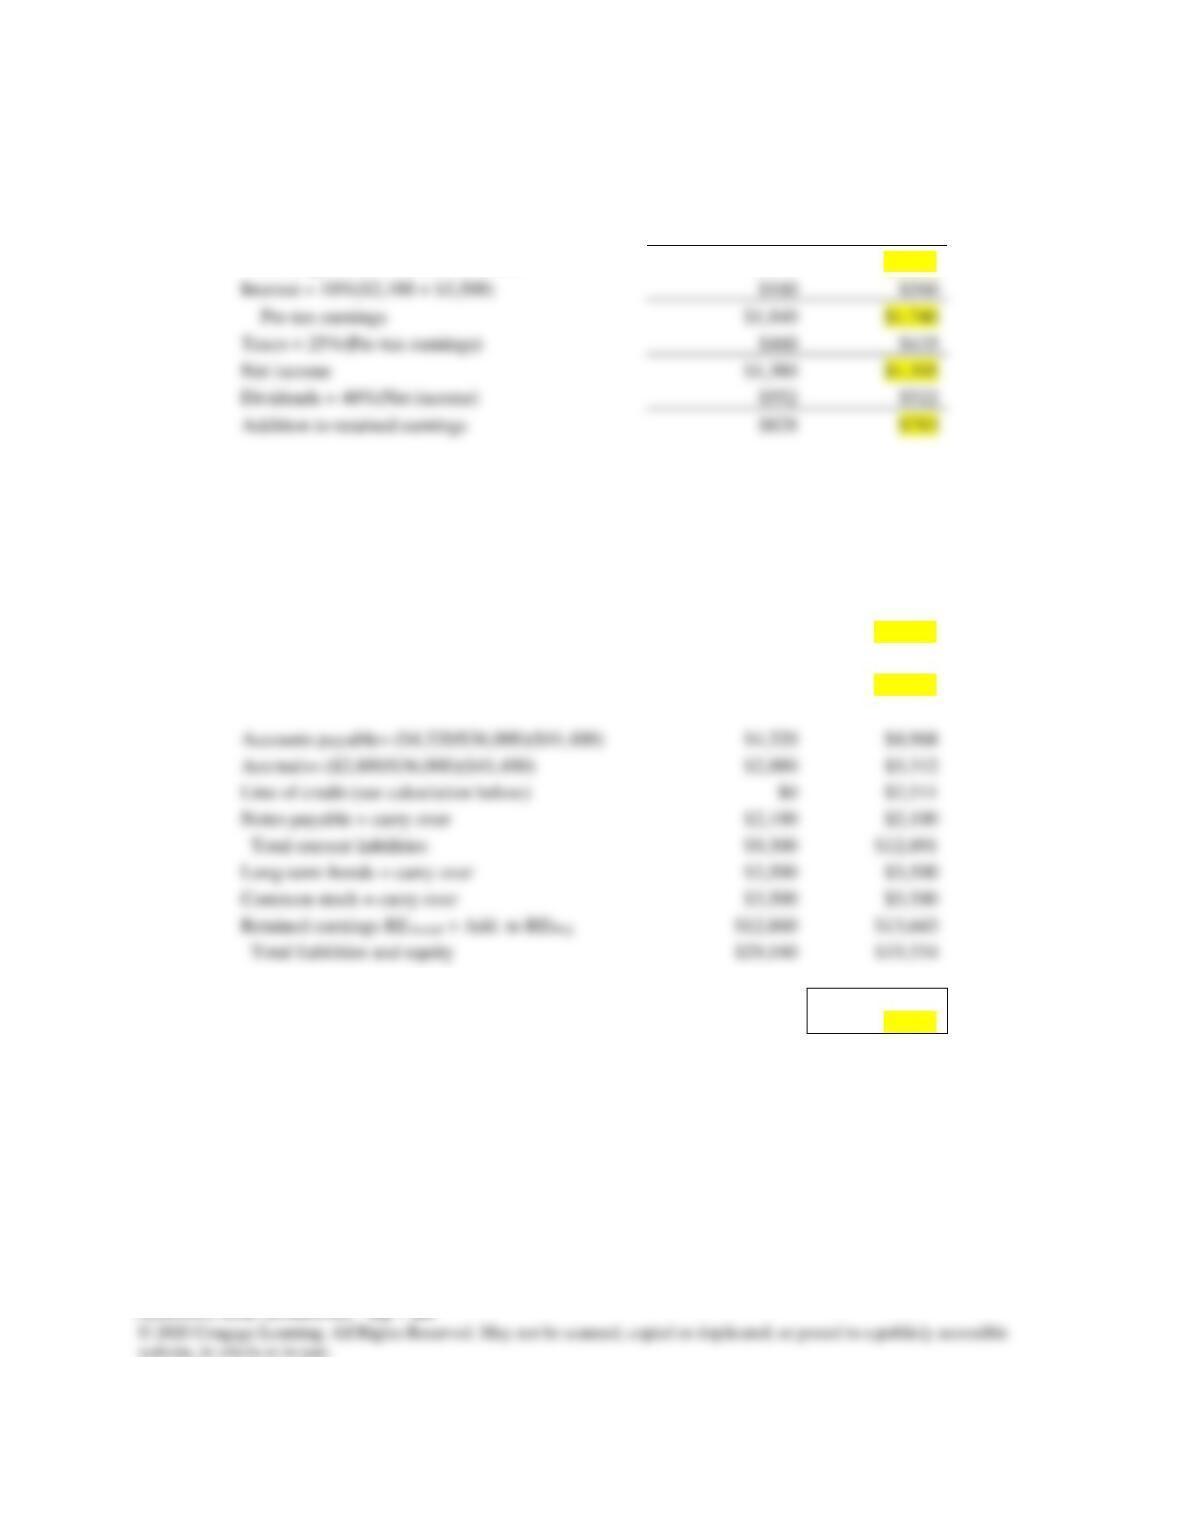
Income Statements (Thousands of Dollars)
Actual
Projected
Sales = $36,000(1.15)
$36,000
$41,400
Op. costs = ($34,000/$36,000)($41,400)
$34,000
$39,100
Earnings before interest and taxes
$2,000
$2,300
Interest = 10%($2,100 + $3,500)
Pre-tax earnings
$1,840
$1,740
Taxes = 25%(Pre-tax earnings)
Net income
$1,380
$1,305
Dividends = 40%(Net income)
Addition to retained earnings
Balance Sheets (Thousands of Dollars)
Actual
Projected
Cash= ($1,080/$36,000)($41,400)
$1,080
$1,242
Receivables= ($6,480/$36,000)($41,400)
$6,480
$7,452
Inventories= ($9,000/$36,000)($41,400)
$9,000
$10,350
Total current assets
$16,560
$19,044
Net fixed assets= ($12,600/$36,000)($41,400)
$12,600
$14,490
Total assets
$29,160
$33,534
Accounts payable= ($4,320/$36,000)($41,400)
$4,320
$4,968
Accruals= ($2,880/$36,000)($41,400)
$2,880
$3,312
Line of credit (see calculation below)
$2,511
Notes payable = carry over
$2,100
$2,100
Total current liabilities
$9,300
$12,891
Long-term bonds = carry over
$3,500
$3,500
Common stock = carry over
$3,500
$3,500
Retained earnings REActual + Add. to REProj.
$12,860
$13,643
Total liabilities and equity
$29,160
$33,534
LOC = TA – (AP + Accr. + Notes pay. + LT
bonds + com. stk + RE)
$2,511
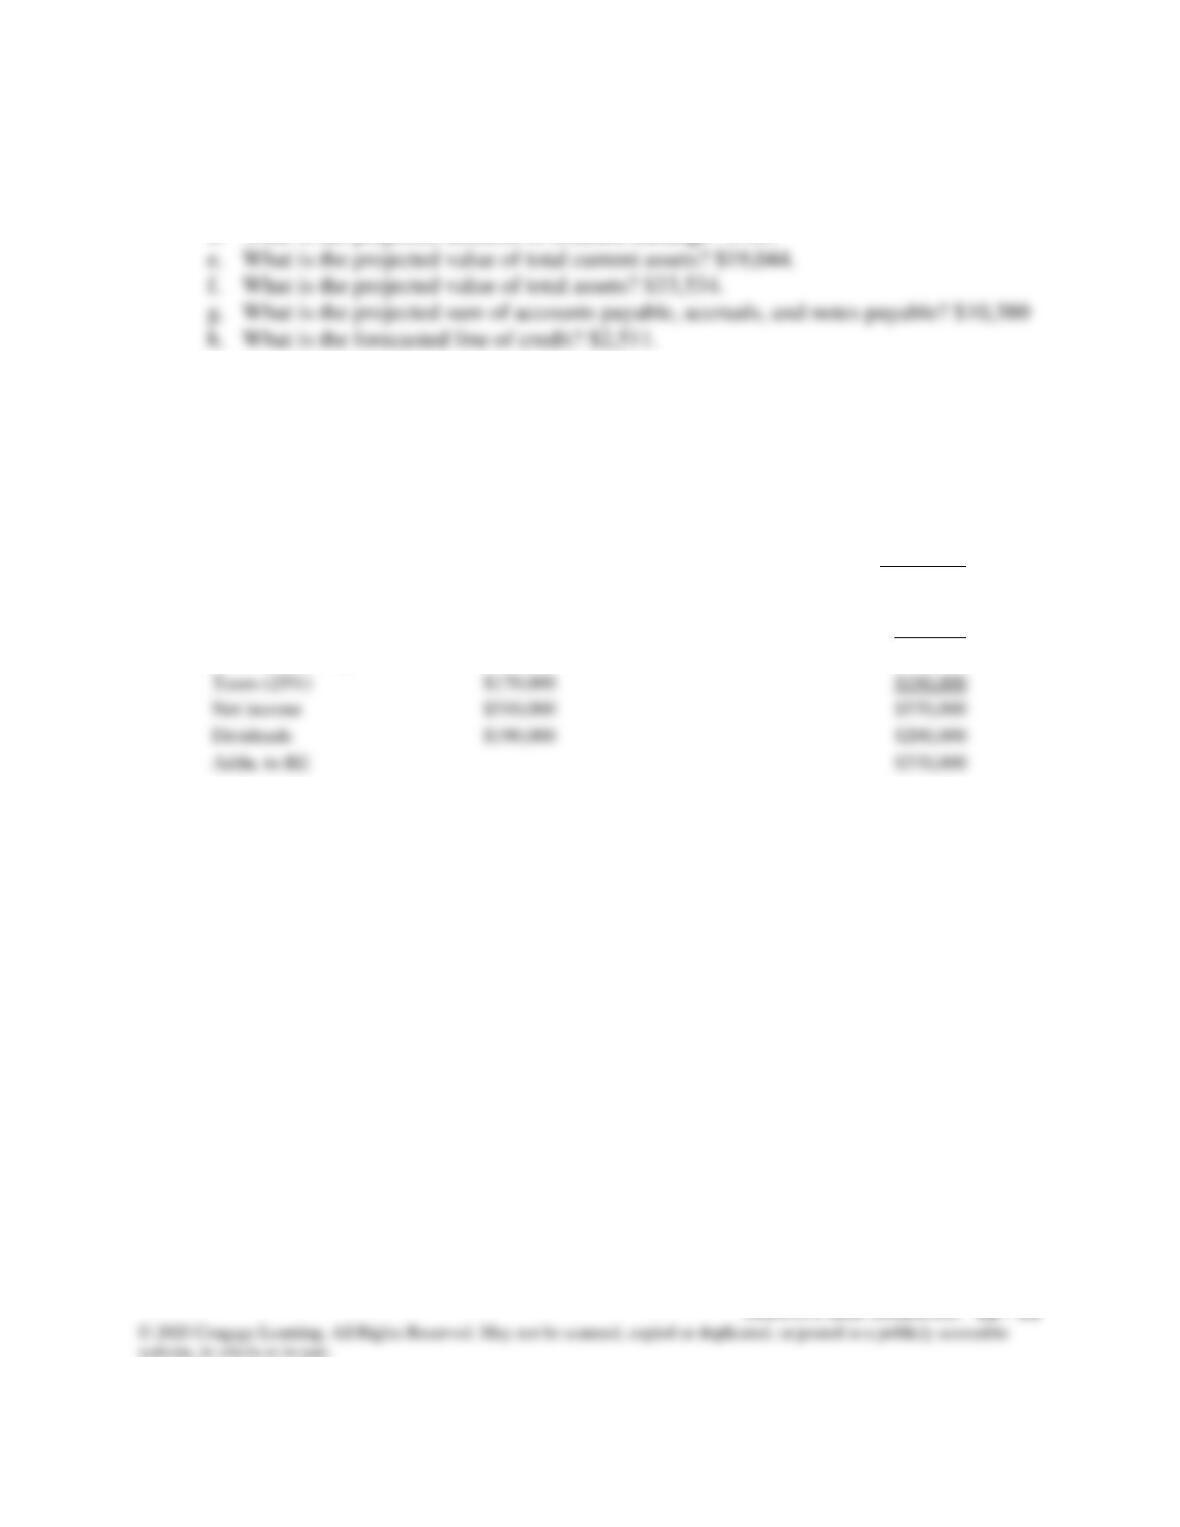
a. What is the projected value for earnings before interest and taxes? $2,300.
b. What is the projected value for pre-tax earnings? $1,740.
c. What is the projected net income? $1,305.
12-9
Income Statements for
December 31 in Current and
Projected Years
Current year
Current % of
Sales
Next year
Sales
$4,000,000
Given
$4,400,000
Operating costs
$3,200,000
80%
x Proj. Sales
$3,520,000
EBIT
$800,000
$880,000
Interest
$120,000
12% x LT
bonds
$120,000
Pre-tax earnings
$680,000
$760,000
Taxes (25%)
$170,000
$190,000
Net income
$510,000
$570,000
Dividends
$190,000
$200,000
Addn. to RE
$370,000
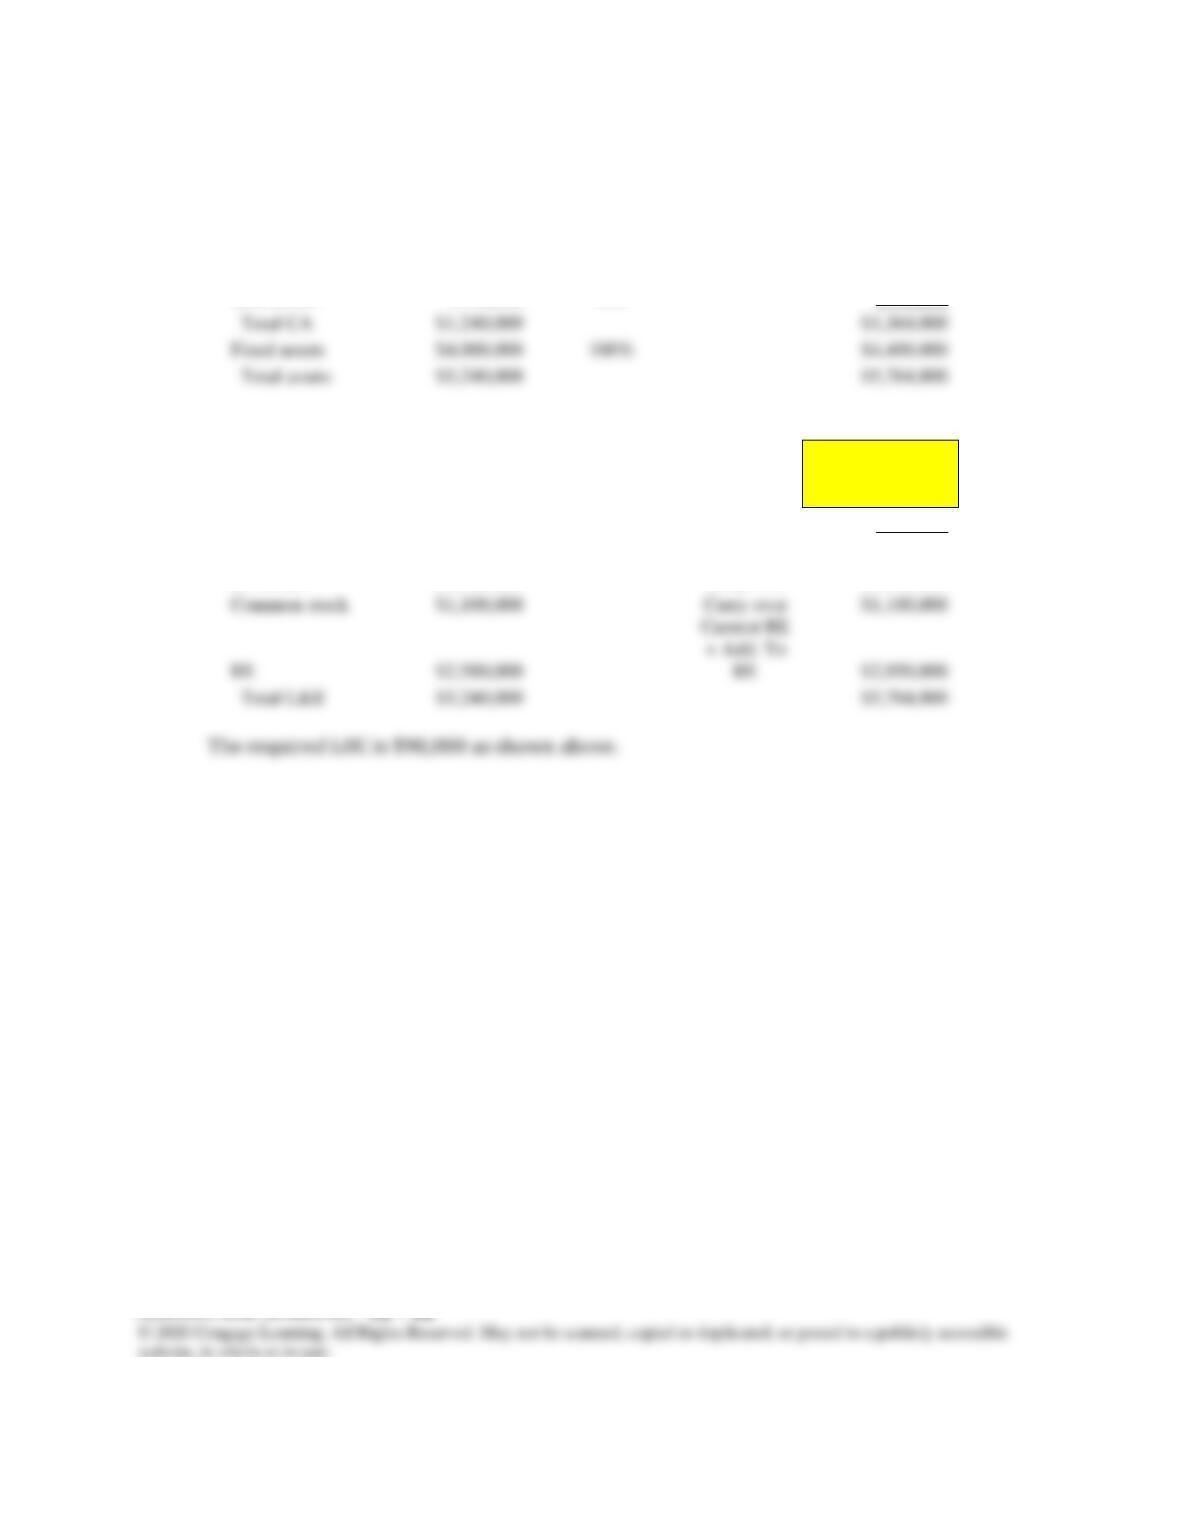
Balance Sheet as of
December 31 in
Current and Projected
Years
Cash
$160,000
4%
$176,000
Receivables
$360,000
9%
$396,000
Inventories
$720,000
$792,000
Total CA
$1,240,000
$1,364,000
Fixed assets
$4,000,000
$4,400,000
Total assets
$5,240,000
$5,764,000
Accounts payable
$360,000
9%
$396,000
Line of credit
$0
TA – AP -Accr.-
LT bonds – stk –
RE
$98,000
Accruals
$200,000
5%
$220,000
Total CL
$560,000
$714,000
LT bonds
$1,000,000
Carry over
$1,000,000
Common stock
$1,100,000
Carry over
$1,100,000
$2,580,000
$2,950,000
Total L&E
$5,240,000
$5,764,000

SOLUTION TO SPREADSHEET PROBLEMS
12-10 The detailed solution is available in the file Ch12 P10 Build a Model Solution.xlsx at the
textbook’s Web site.
12-11 The detailed solution for is available in the file Ch12 P11 Build a Model Solution.xlsx at
the textbook’s Web site.
MINI CASE
Hatfield Medical Supply’s stock price had been lagging its industry averages, so its
board of directors brought in a new CEO, Jaiden Lee. Lee had brought in Ashley Novak, a
finance MBA who had been working for a consulting company, to replace the old CFO, and
Lee asked Ashley to develop the financial planning section of the strategic plan. In her
previous job, Novak’s primary task had been to help clients develop financial forecasts, and
that was one reason Lee hired her.
Novak began as she always did, by comparing Hatfield’s financial ratios to the
industry averages. If any ratio was substandard, she discussed it with the responsible manager
to see what could be done to improve the situation. The following data shows Hatfield’s latest
financial statements plus some ratios and other data that Novak plans to use in her analysis.
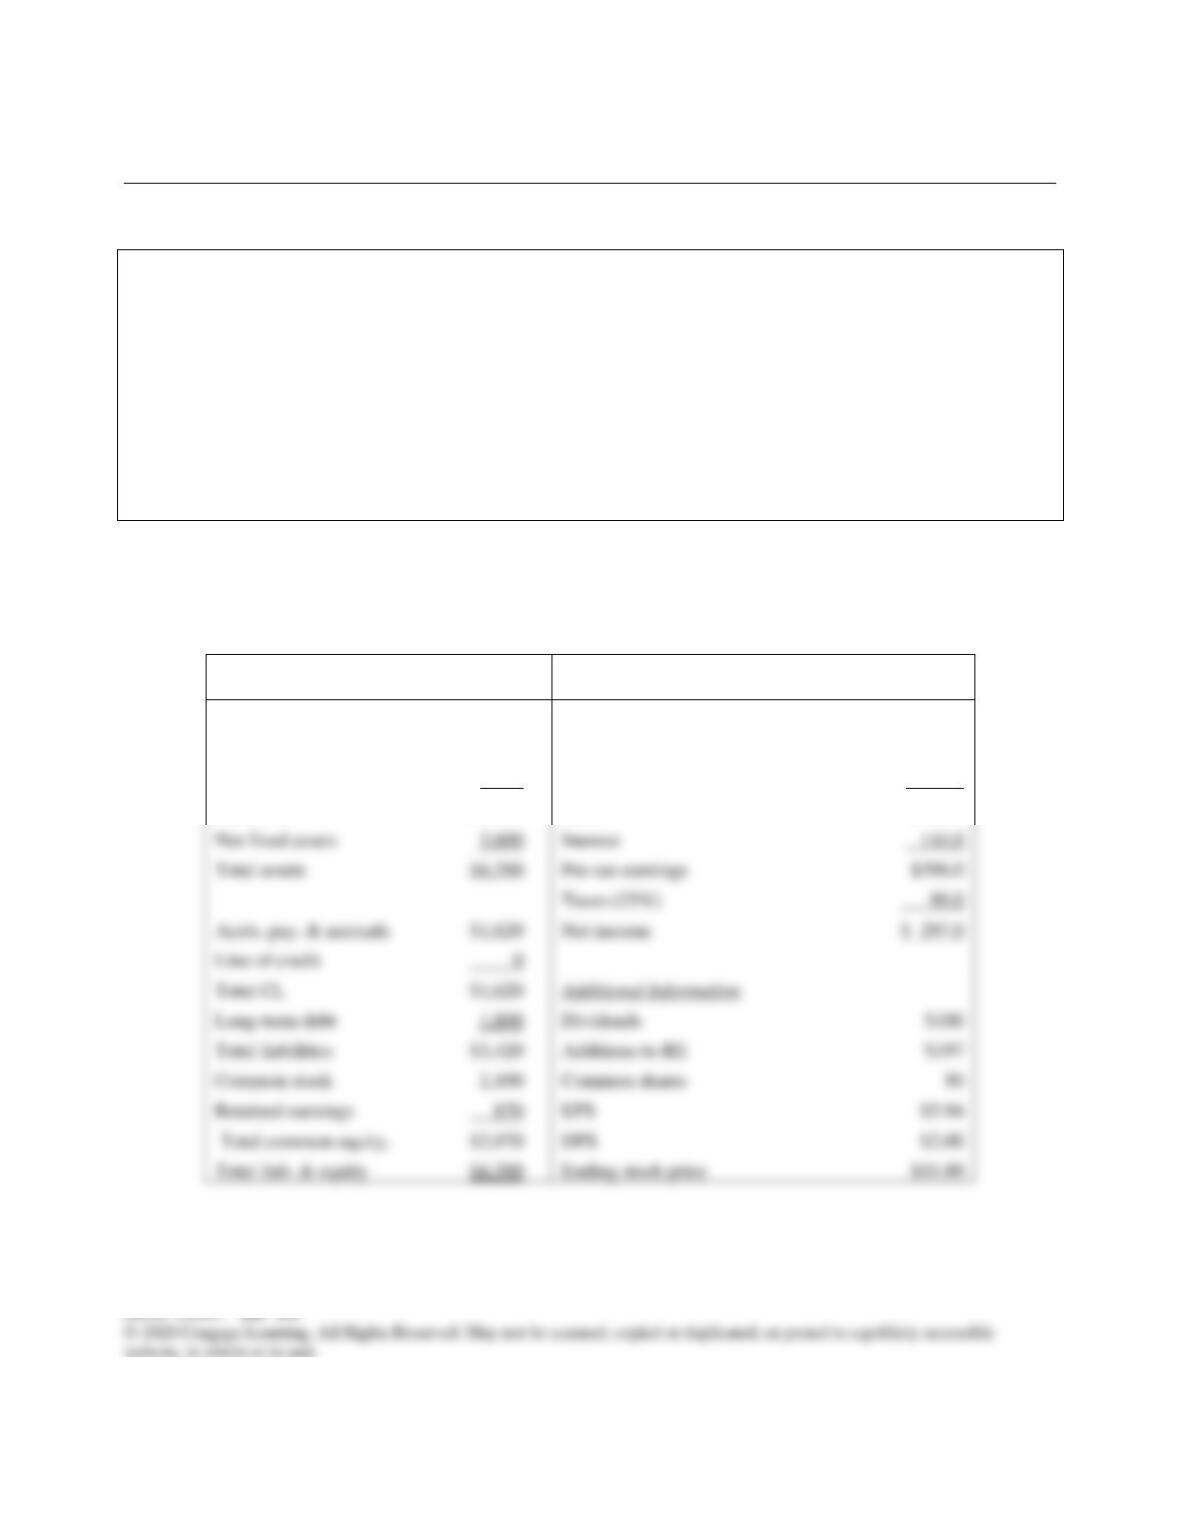
Hatfield Medical Supply (Millions of Dollars, Except per Share Data)
Balance Sheet,
12/31/2019
Income Statement, Year Ending
2019
Cash
$ 90
Sales
$9,000.9
Accounts receivable
1,260
Op costs (excl. depr.)
8,100.9
Inventories
1,440
Depreciation
360.0
Total CA
$2,790
EBIT
$540.0
Net fixed assets
3,600
Interest
144.0
Total assets
$6,390
Pre-tax earnings
$396.0
Taxes (25%)
Accts. pay. & accruals
$1,620
Net income
Line of credit
Total CL
$1,620
Long-term debt
1,800
Dividends
Total liabilities
$3,420
Additions to RE
Common stock
2,100
Common shares
Retained earnings
EPS
Total common equity.
$2,970
DPS
Total liab. & equity
$6,390
Ending stock price