Investing in Stocks and Bonds
Chapter 12
How Will This Affect Me?
Once you’ve figured out how much you need to invest to meet important financial goals, it’s
time to decide which specific investments to buy. This chapter describes the basic characteristics
of stocks and bonds, explains their potential returns and risks, and provides a framework for
choosing among stocks and bonds to meet your financial objectives. Care is taken to explore how
stock and bond prices behave and how to evaluate their performance over time. After reading
this chapter you should be able to choose the most appropriate stocks and bonds for your
portfolio in light of your goals and constraints.
LEARNING GOALS
12-1 Describe the various types of risks to which investors are exposed, as well as the
sources of return.
The goal here is learning terminology and understanding the trade-offs. Power points will be
sufficient.
12-2 Know how to search for an acceptable investment on the basis of risk, total return,
and yield.
12-3 Discuss the merits of investing in common stock and be able to distinguish among the
different types of stocks.
There are three basic reasons for investing in common stock: (1) to use the stock as a warehouse
of value, (2) to accumulate capital, and (3) to provide a source of income. Make no mistake, the
12-4 Become familiar with the various measures of performance and how to use them in
placing a value on stocks.
The classes of common stock [Blue-chip, growth, tech, income v speculative, cyclical and
12-5 Describe the basic issue characteristics of bonds, as well as how these securities are
used as investment vehicles.
Bonds provide investors with two kinds of income: (1) Most provide current income, and (2)
they can generate substantial capital gains. Exhibit 12.6 compares the performance of stocks and
12-6 Distinguish between the different types of bonds, gain an understanding of how bond
prices behave, and know how to compute different measures of yield.
Treasury bonds hold a special place for investments in bonds. The low risk is a plus for many
investors. The tax impact on municipal bonds [interest is tax exempt] needs to be understood.
Financial Facts or Fantasies?
These may be used as “teasers” to get the students on the right page with you. Also, they may be
used as quizzes after you covered the material or as “pre–test questions” to get their attention.
• A good investment is one that offers a positive rate of return.
Fantasy: A good investment is one that offers an expected return that equals or exceeds the
investor’s required rate of return, which is defined relative to the risk of the investment. Thus,
what might be a good return in one case may be totally inadequate in another.
• When interest rates go down, bond prices also go down because such securities become less
valuable.
Fantasy: Bond prices and interest rates move in the opposite direction. As a result, when interest
rates go down, bond prices go up.

Financial Facts or Fantasies?
These may be used as a quiz or as a pre-test to get the students interested.
1. True False A good investment is one that offers a positive rate of return.
2. True False Income stocks have relatively high dividend yields and, as such,
appeal to individuals who seek a high level of current income.
3. True False Putting your money into stocks that offer dividend reinvestment
plans is a great way of building up your investment capital.
4. True False When interest rates go down, bond prices also go down because
such securities become less valuable.
5. True False Convertible bonds are so named because they can be exchanged
for a set number of shares of common stock.
YOU CAN DO IT NOW
The “You Can Do It Now” cases may be assigned to the students as short cases or problems.
They will help make the topic more real or relevant to the students. In most cases, it will only
take about ten minutes to do, that is, until the student starts looking around at the web site. But
they will learn by doing so.
What’s the Market P/E Ratio Telling You?
Nobel Prize-winning Professor Robert Shiller came up with the Shiller P/E ratio, which is based
How Do Stock and Bond Market Returns Compare This Year?
If you want a broad sense of how stock and bond returns compare so far this year, take a look at
the returns on two broad-based exchange traded funds (ETFs, which we discuss in detail in

Financial Impact of Personal Choices
Read and think about the choices being made. Do you agree or not? Ask the students to discuss
the choices being made.
Brooke and Jose Like High Flying Stocks
Brooke and Jose Ramos are both 33 years old and invest 15 percent of their after-tax annual
income in stocks. They hate missing out on great returns when the stock of a company doing
great things starts going through the roof. For example, Brooke and Jose feel they should have
invested in Netflix in 2018 when it earned almost a 62 percent return! So any time a company
they know well earns more than 20 percent in a year, they try to invest in it. And because they
believe in the stocks they buy, the Ramos always hold their stocks until they at least break even.
What do you make of the Ramos’ approach to stock investing?
Applying Personal Finance
Choosing the Best Type of Stock
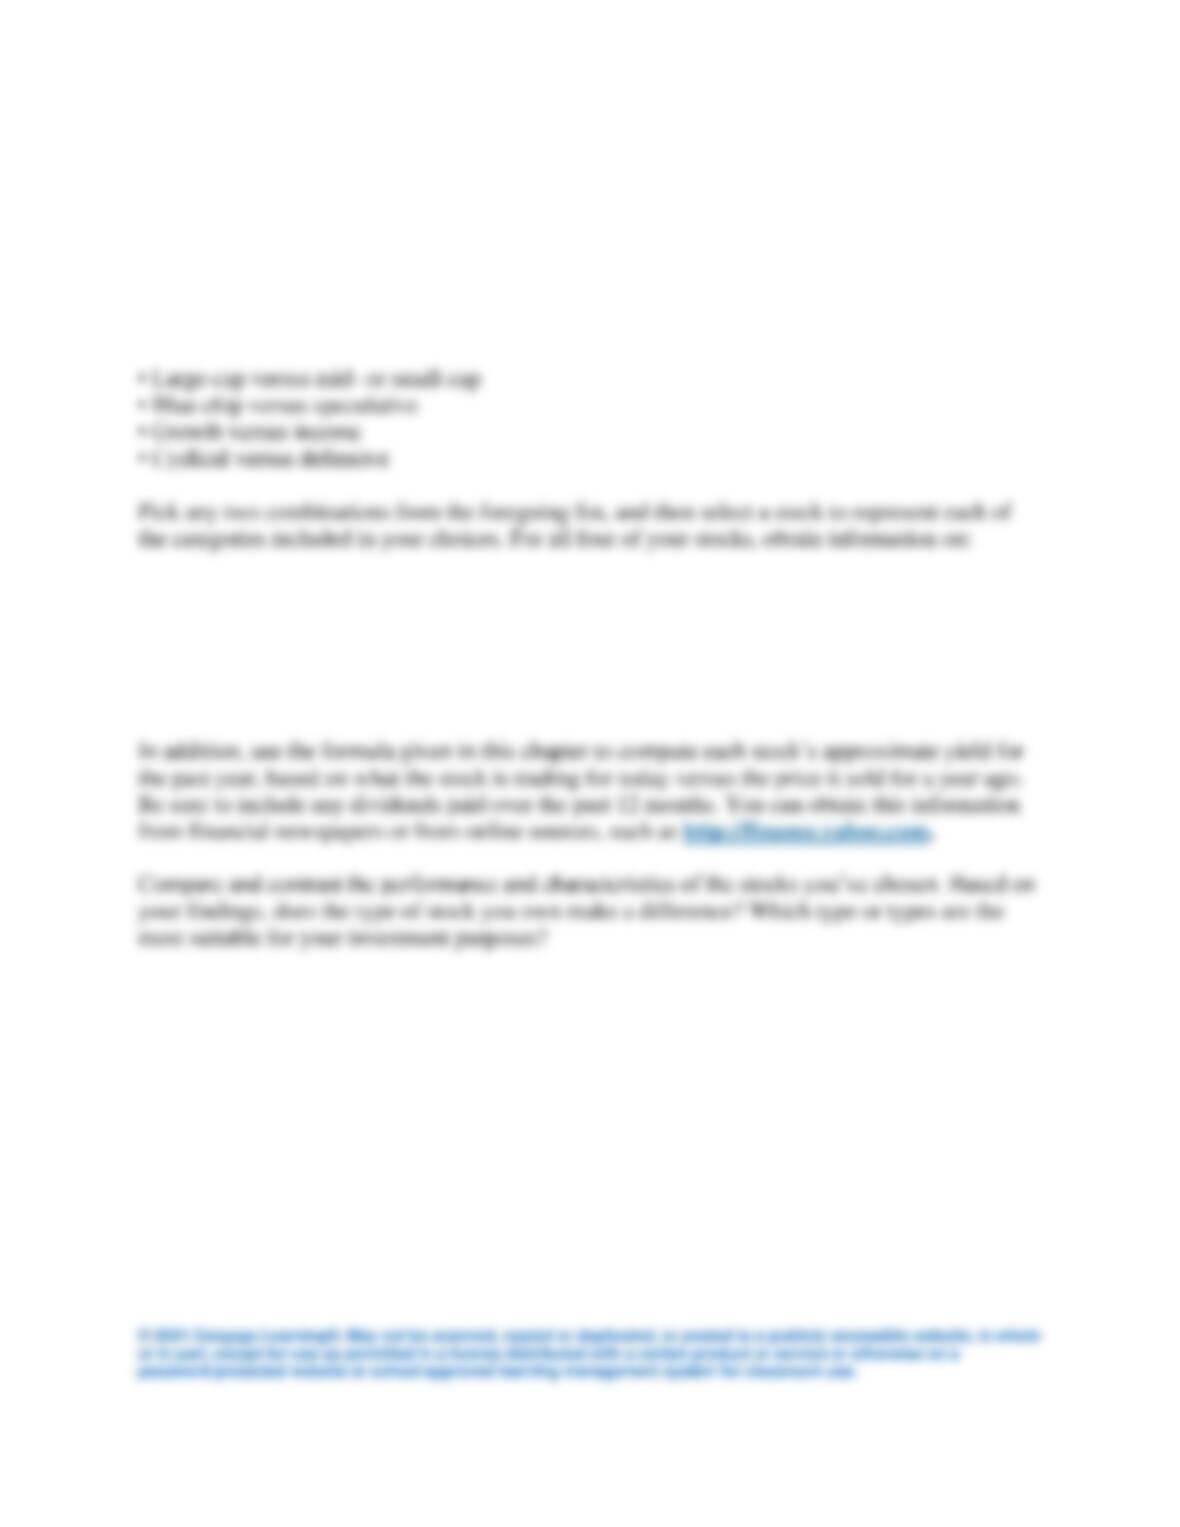
In this chapter, we learned that common stock is often placed into various categories—blue-chip,
growth, income, and so forth—and referred to by its size, such as large-, mid-, or small-cap. In
this project, you’ll examine and compare the returns on various types of common stock.
Common comparisons include:
• The company’s EPS
• Growth in dividends per share
• Dividend yield
• P/E ratio
• The stock’s beta
Solutions to Financial Planning Exercises
1. Ranking investments by expected returns. What makes for a good investment? Use the
approximate yield formula or a financial calculator to rank the following investments
according to their expected returns.
2
a. Buy a stock for $30 a share, hold it for 3 years, and then sell it for $60 a share (the stock
pays annual dividends of $2 a share).
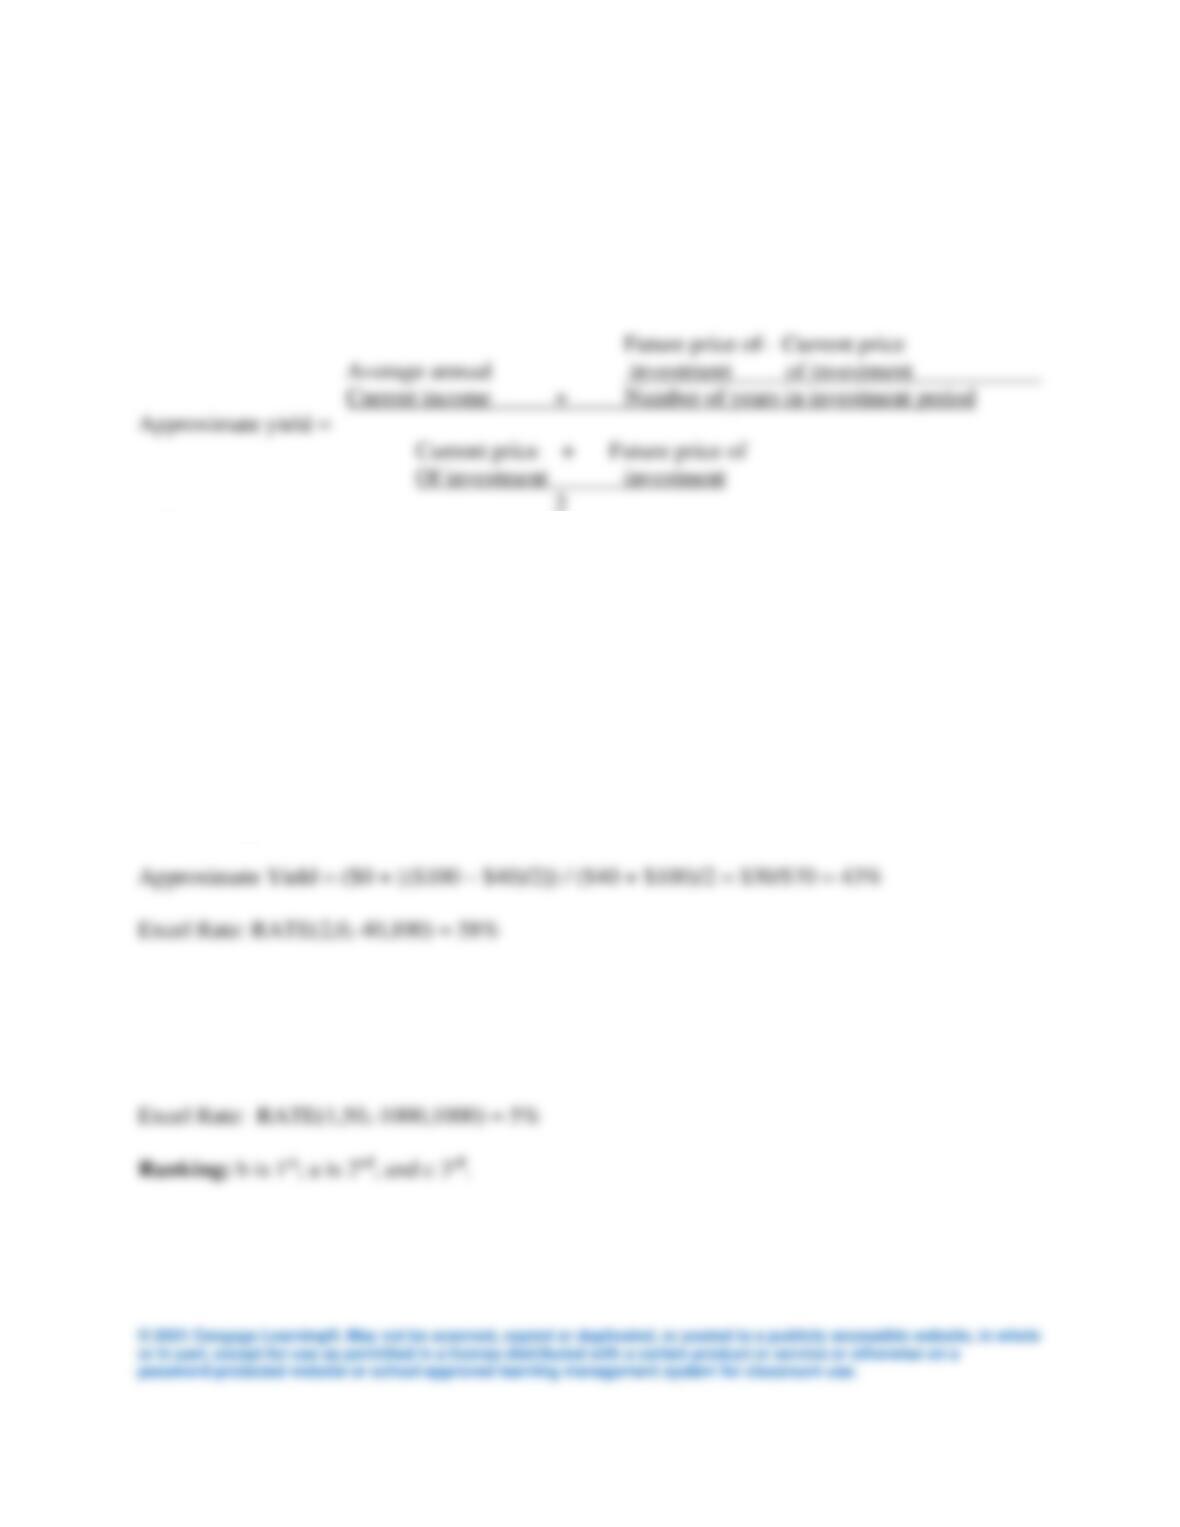
Approximate Yield = ($2 + [($60 – $30)/3]) / ($30 + $60)/2 = $12/$45 = 27%
Excel Rate RATE(number of years, dividends, purchase price, future price)
RATE(3,2,-30,60) = 31%
NOTE: Use of financial calculator gives same results as Excel RATE.
b. Buy a security for $40, hold it for 2 years, and then sell it for $100 (current income on
this security is zero).
c. Buy a 1-year, 5 percent note for $1,000 (assume that the note has a $1,000 par value and
that it will be held to maturity).
Approximate Yield = ($50 + [($1,000 – $1,000)/1] ) / ($1,000 + $1,000)/2 = $50/$1,000 = 5%
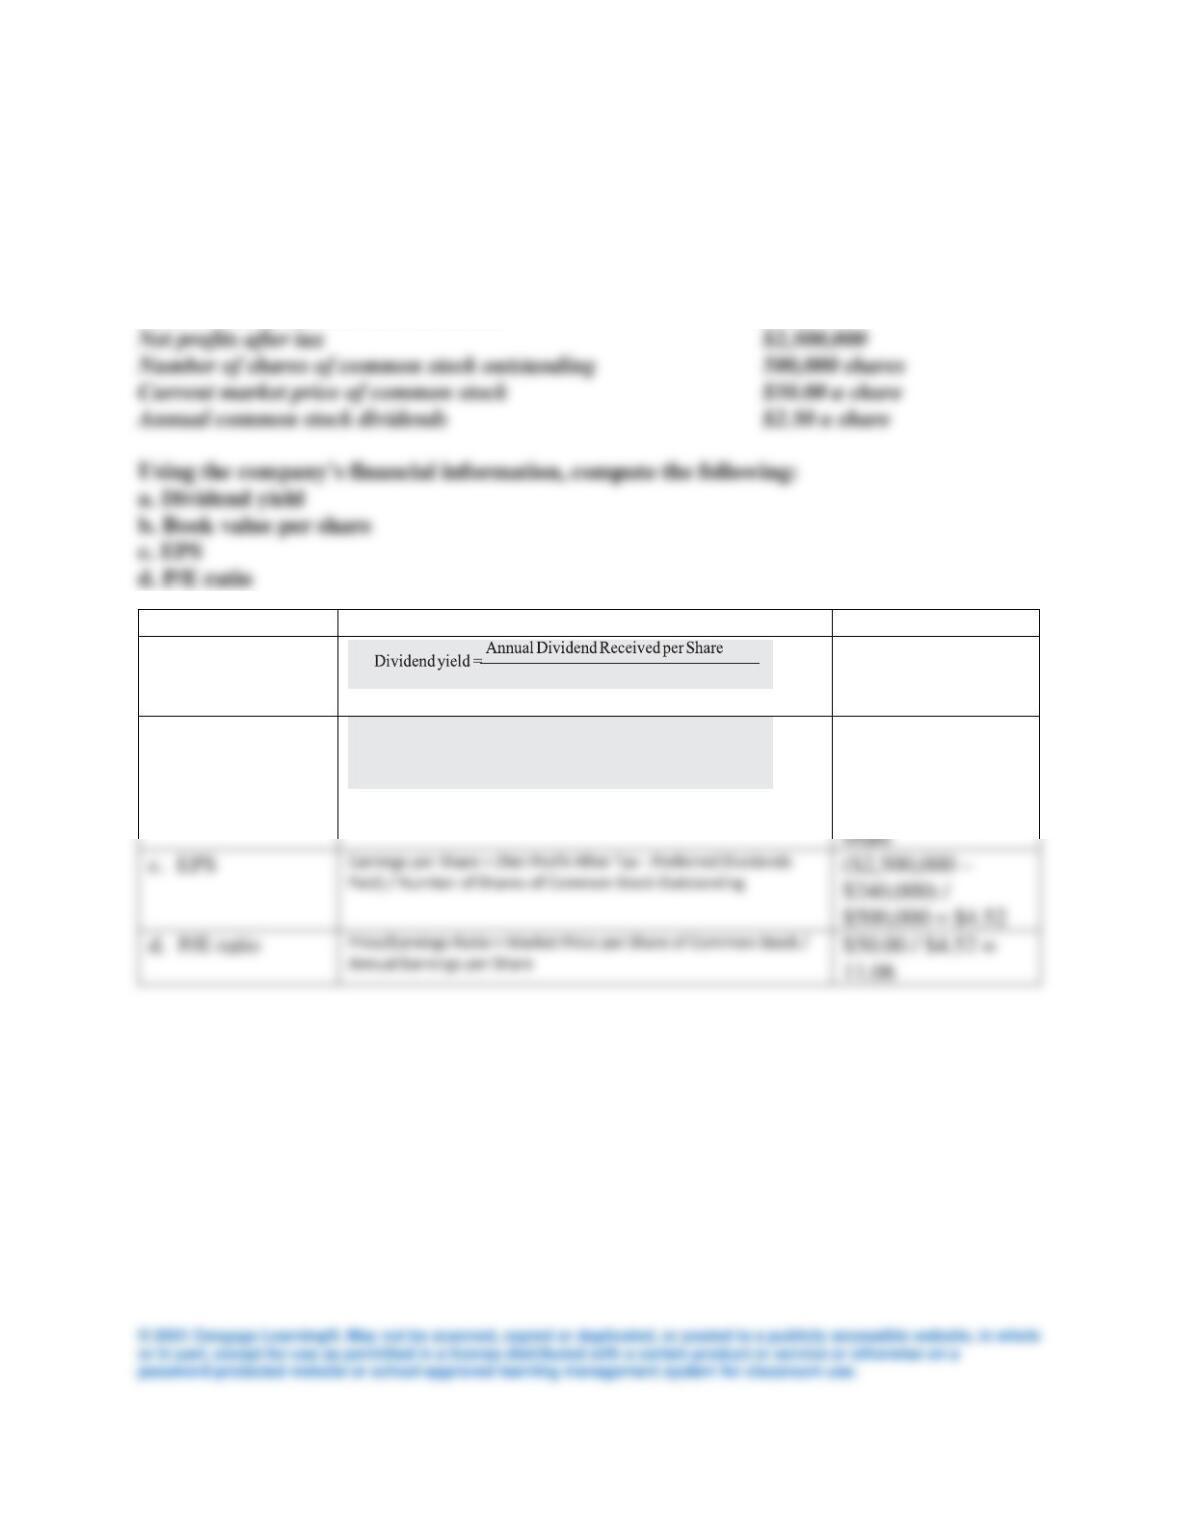
2. Calculating key financial ratios. Selected financial information about Outer Scapes, Inc.
is as follows:
Total assets $20,000,000
Total liabilities $8,000,000
Total preferred stock $3,000,000
Total annual preferred stock dividends $240,000
Statistic
Formula
Computation
a. Dividend yield
$2.50/$50.00 = 5%
b. Book Value per
share
($20,000,000-
$8,000,000-
$3,000,000) /
500,000 = $18 per
$500,000 = $4.52
11.06
Market Price per Share of Stock
(Book Value per Share = Total Assets – Total Liabilities –
Preferred Stock) / Number of Shares of Common Stock
Outstanding
3. Choosing appropriate stocks. Assume that you’ve just inherited $500,000 and have
decided to invest a big chunk of it ($350,000, to be exact) in common stocks. Your objective
is to build up as much capital as you can over the next 15 to 20 years, and you’re willing to
tolerate a “good deal’’ of risk.
a. What types of stocks (blue chips, income stocks, and so on) do you think you’d be most
interested in, and why? Select at least three types of stocks and briefly explain the rationale
for selecting each.
b. Would your selections change if you were dealing with a smaller amount of money—say,
only $50,000? What if you were a more risk-averse investor?
With less money and less risk an investor will tend to go with the blue-chip stocks. Also,
4. Effectiveness of stock market timing. Discuss the evidence regarding the ability of most
investors to effectively time getting in and out of the stock market. How sensitive are
returns to being out of the market for just a few months of good stock market
performance?
Research shows that most investors are better off investing steadily than trying to time the
market. It is exceedingly difficult to buy consistently at market bottoms and sell at market tops.
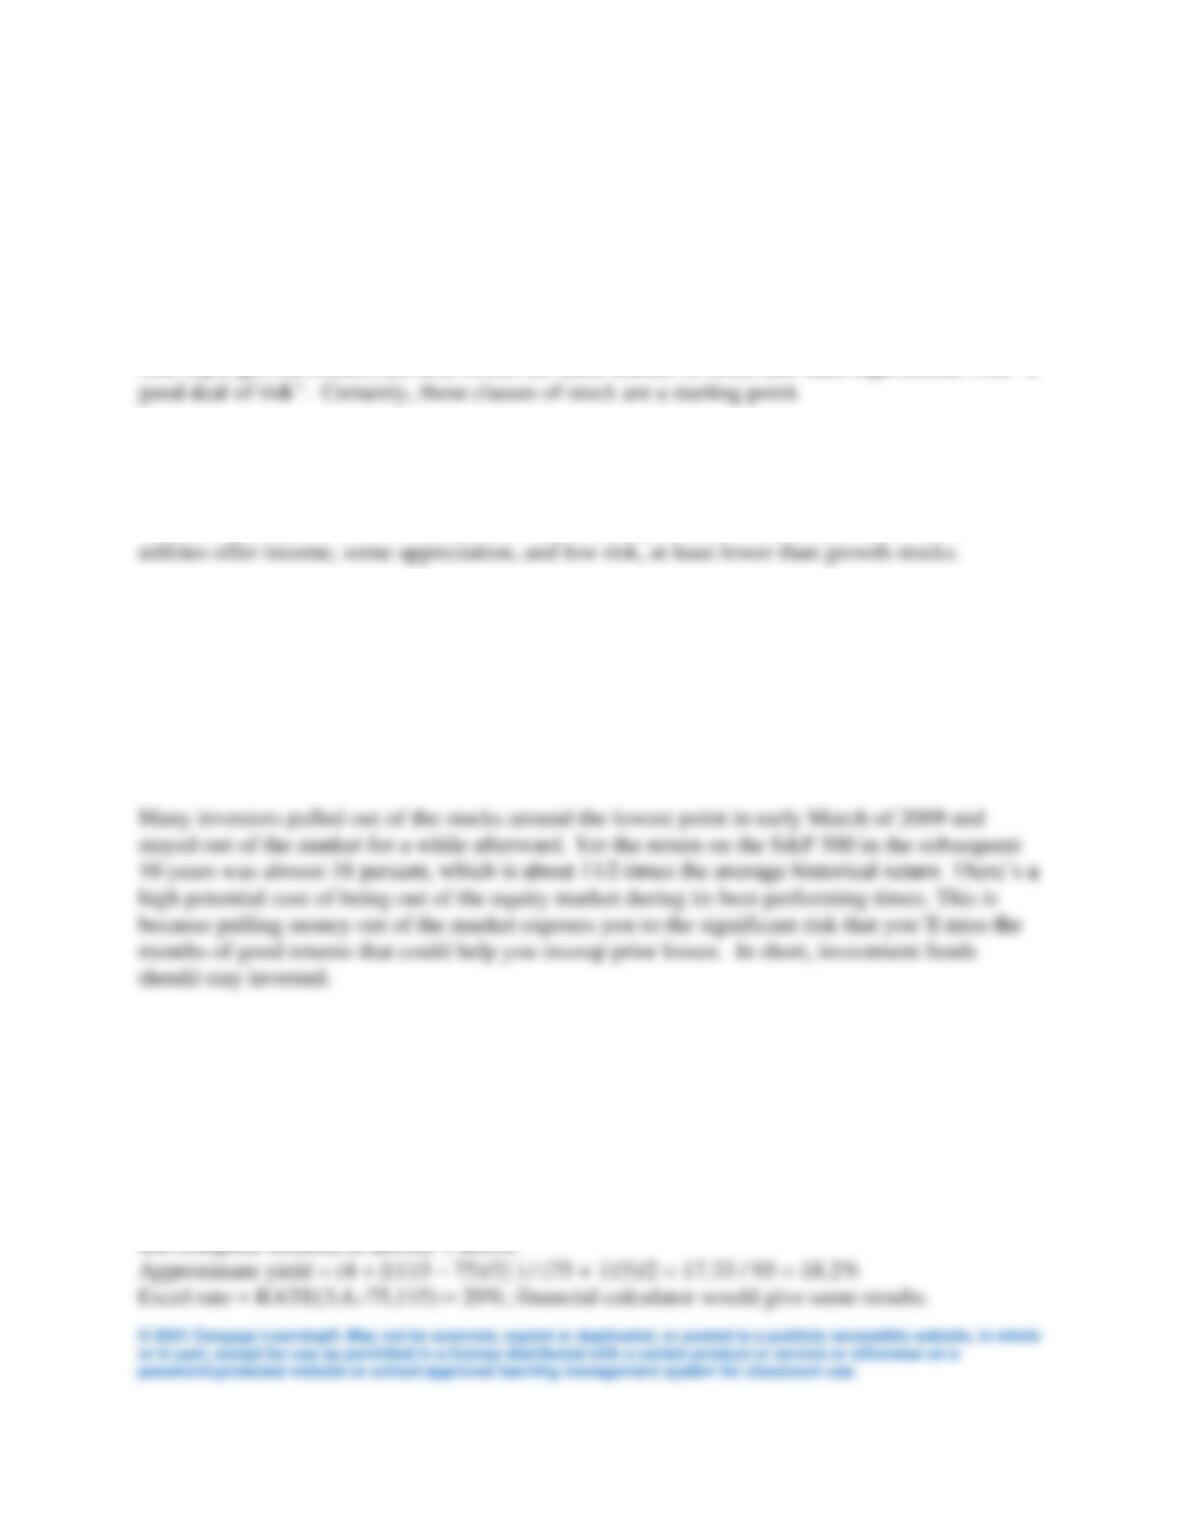
5. Calculating expected return on investment. An investor is thinking about buying some
shares of Data Systems, Inc., at $75 a share. She expects the price of the stock to rise to
$115 a share over the next 3 years. During that time, she also expects to receive annual
dividends of $4 per share. Given that the investor’s expectations (about the future price of
the stock and the dividends it pays) hold up, what rate of return can the investor expect to
earn on this investment? (Hint: Use either the approximate yield formula or a financial
calculator to solve this problem.)
6. Calculating book value. A company has total assets of $2.5 billion, total liabilities of $1.8
billion, and $200 million worth of 8 percent preferred stock outstanding. What is the firm’s
total book value? What would its book value per share be if the firm had 100 million shares
of common stock outstanding?
(See formula in answer to 2b)
Book Value (of common stock) = Assets – liabilities – Preferred Stock = $2.5 B – 1.8 B -.2 B =
7. Calculating key stock performance metrics. The Alliance Company recently reported net
profits after taxes of $15.8 million. It has 2.5 million shares of common stock outstanding
and pays preferred dividends of $1 million a year. The company’s stock currently trades at
$60 per share.
a. Compute the stock’s EPS.
EPS = (Net Profit After Tax – Preferred Stock Dividends Paid) / Shares of Common Stock
8. Calculating expected return on a stock. The price of Applied Adhesives, Inc., Inc. is now
$85. The company pays no dividends. Adam Gardner expects the price 4 years from now to
be $125 a share. Should Adam buy Applied Adhesives if he wants a 15 percent rate of
return? Explain.
No, this stock does not meet the required return of 15%.
Approximate Yield = ($0 + [($125 – $85)/4]) / ($85 + $125)/2 = $10 / $105 = 9.5%
9. Collect key data on actual stocks and bonds. Using the resources available on the
internet, work the following problems. (Note: Show your work for all your calculations.)
a. Select any two common stocks and then determine the dividend yield, EPS, and P/E ratio
for each.
Accessed January 24, 2020 Student answers will vary.
Stock (symbol)
Dividend yield
EPS
P/E ratio
Coca Cola (KO)
2.77%
1.81
31.78
Power (AEP)
Bond
Current yield
Yield to Maturity
Owl Rock Capital Corp 3.750%
3.696
3.638
Spirit Aerosystems 3.85%
4.057
3.907
10. Tax treatment of bond returns. An investor in the 32 percent tax bracket is trying to
decide which of two bonds to select: one is a 5.5 percent U.S. Treasury bond selling at par;
the other is a municipal bond with a 4.25 percent coupon, which is also selling at par.
Which of these two bonds should the investor select? Why?
After federal tax, the return on US Treasury bond is 3.74 percent [5.5% * (1 – .32)]
11. Calculating current yield and yield to maturity. Describe and differentiate between a
bond’s (a) current yield and (b) yield to maturity. Why are these yield measures important
to the bond investor? Find the yield to maturity of a 20-year, 9 percent, $1,000 par value
bond trading at a price of $850. What’s the current yield on this bond?
a. The current yield is found by dividing the annual interest income by the market price of
the bond. It is basically the same figure as the dividend yield on a stock, and it would be
important to investors seeking current income.
12. Calculating and comparing current yields. Which of these two bonds offers the highest
current yield? Which one has the highest yield to maturity?
a. A 6.55 percent, 22-year bond quoted at 52.000
Approximate Yield to Maturity= ($65.5 + [($1,000 – $520)/22]) / ($520 + $1,000)/2 =
$87.32/$760 = 11.49%
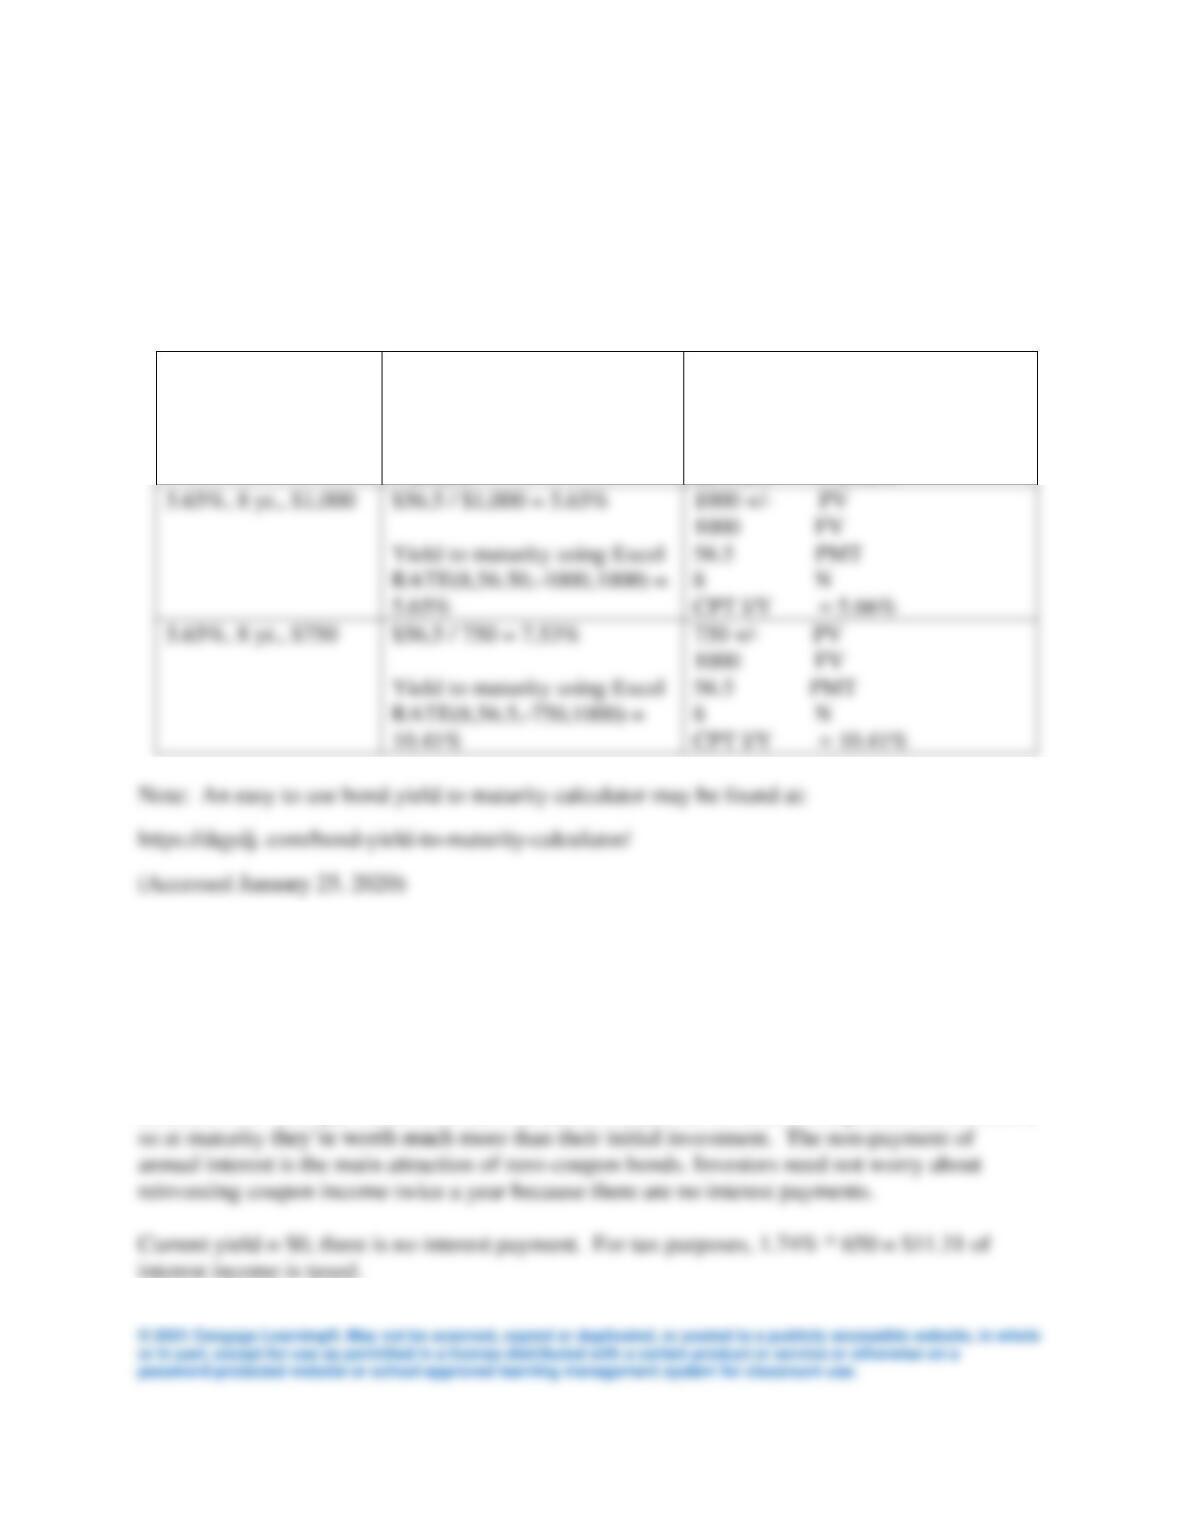
13. Calculating and interpreting current yield and yield to maturity. Find the current yield
of a 5.65 percent, 8-year bond that’s currently priced in the market at $853.75. Now, use a
financial calculator to find the yield to maturity on this bond (use annual compounding).
What’s the current yield and yield to maturity on this bond if it trades at $1,000? If it’s
priced at $750? Comment on your findings.
Quote
Current Yield
Yield to Maturity, Annual
Compounding
Using Financial Calculator
5.65%, 8 yr., $853.75
$56.5/$853.75 = 6.62%
Yield to maturity using Excel
RATE(8,56.5,-853.75,1000)
853.75 +/– PV
1000 FV
56.5 PMT
8 N
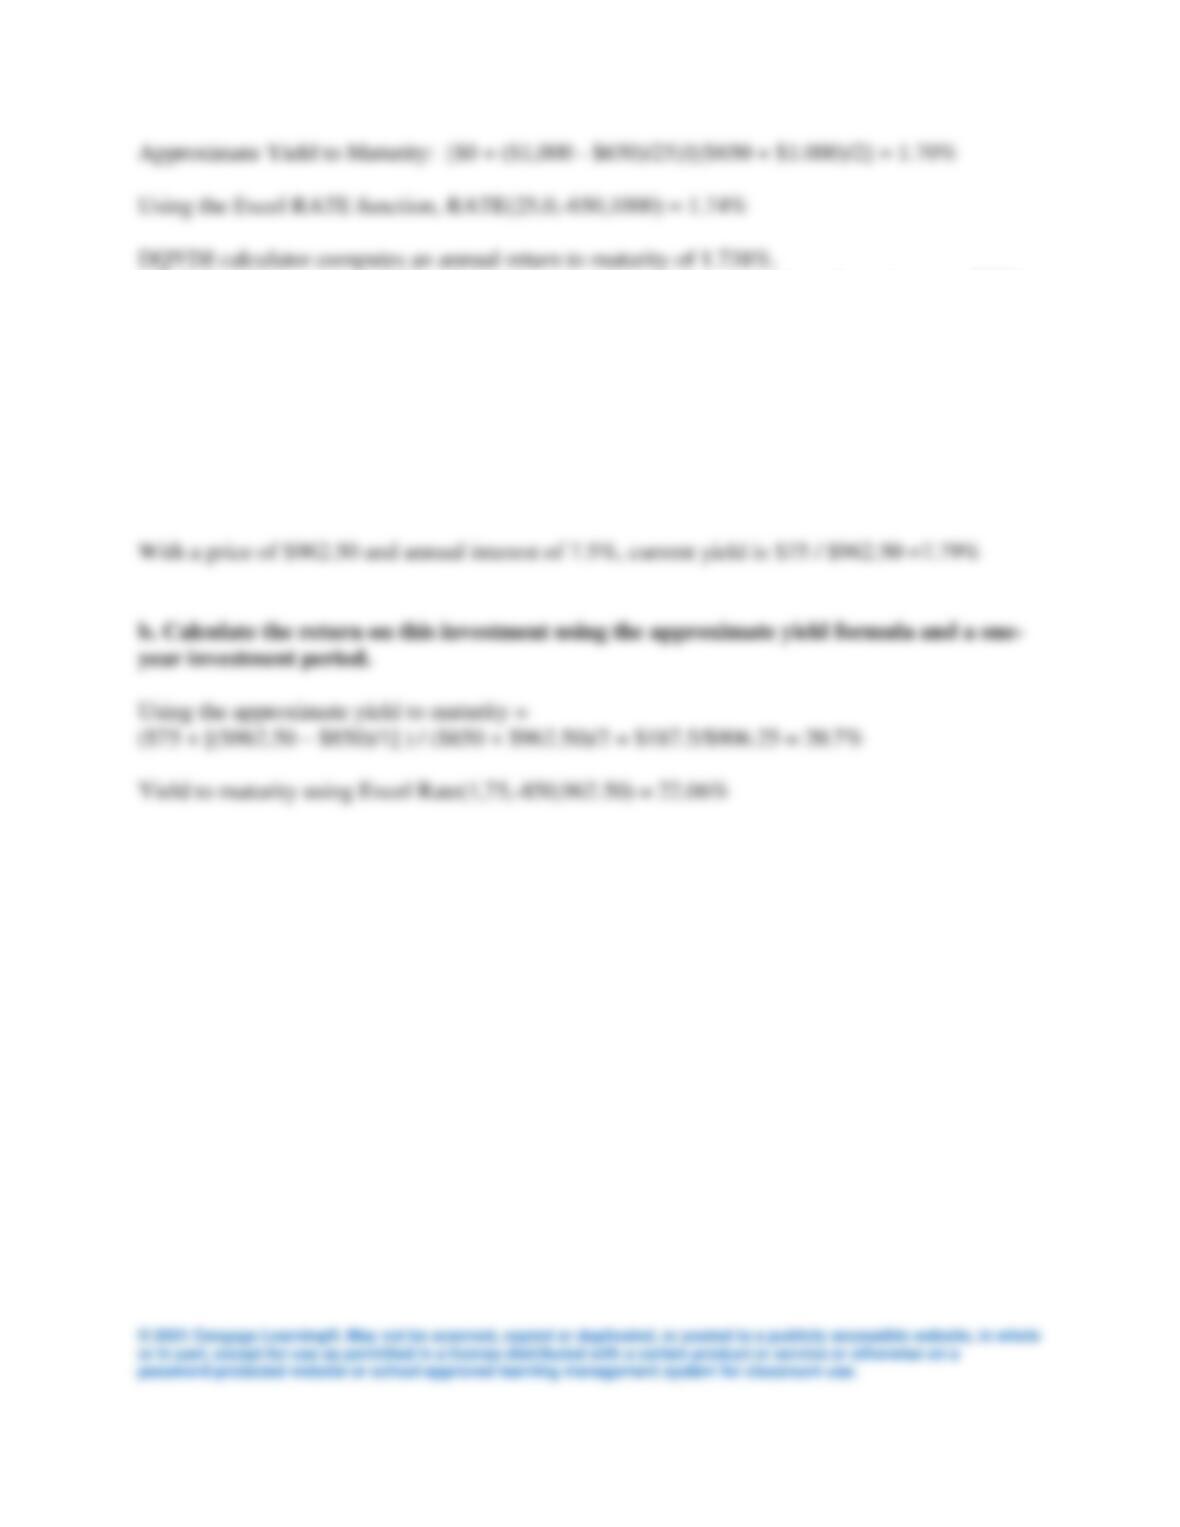
14. Calculating current yield and yield to maturity. A 25-year, zero coupon bond was
recently quoted at 6.500. Find the current yield and yield to maturity of this issue, given the
bond has a par value of $1,000. (Assume annual compounding for the yield to maturity
measure.)
Zero coupon bonds, which, as the name implies, are bonds issued without coupons, they do not
pay annual interest. To compensate for their lack of coupons, these bonds are sold at a deep
discount from their par values and then increase in value over time, at a compound rate of return,
interest income is taxed.
15. Calculating current yield and return on investment. Assume that an investor pays $850
for a long-term bond that carries a 7.5 percent coupon. During the next 12 months, interest
rates drop sharply, and the investor sells the bond at a price of $962.50.
a. Find the current yield that existed on this bond at the beginning of the year. What was it
by the end of the one-year holding period?
Current yield is the Annual interest income divided by the market price of bond. With a price of
$850 and annual interest of 7.5%, current yield is $75 / $850 = 8.82%
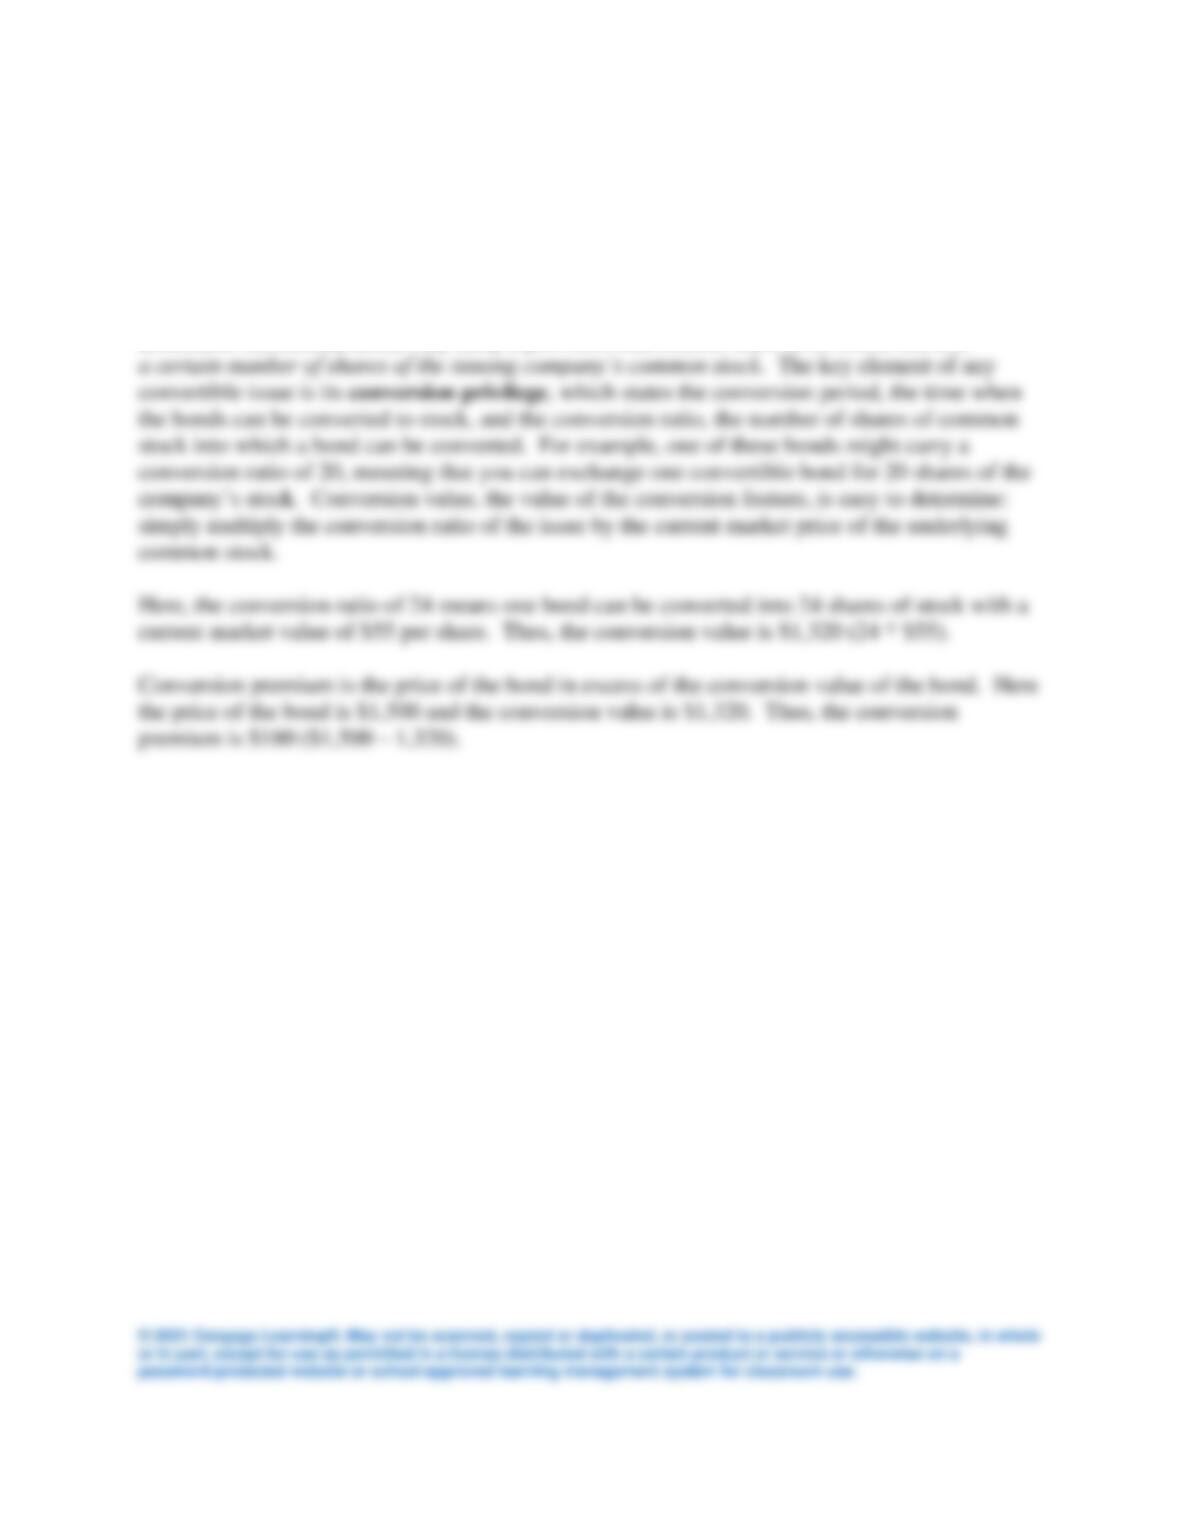
16. Calculating conversion value and conversion premium. Find the conversion value of a
convertible bond that carries a conversion ratio of 24, given that the market price of the
underlying common stock is $55 a share. Would there be any conversion premium if the
convertible bond had a market price of $1,500? If so, how much?
Convertible bond, found only in the corporate market, are a hybrid security that possess the
features of both corporate bonds and common stocks. That is, though they’re initially issued as