CFIN6 – CHAPTER 11
INTEGRATIVE PROBLEM SOLUTION
a(1). The WACC is used primarily for making long-term capital investment decisions—that is, for capital
budgeting. Thus, the WACC should include the types of capital used to pay for long-term assets, and
this typically is long-term debt, preferred stock (if used), and common stock. Short-term sources of
a(2). Stockholders are concerned primarily with those corporate cash flows that are available for their use,
a(3). In financial management, the cost of capital is used primarily to make decisions that involve raising
new capital. Thus, the relevant component costs are today’s marginal costs rather than historical
costs.
b. Coleman’s 12 percent bond with 15 years to maturity currently is selling for $1,153.72. Thus, its yield
to maturity is 10 percent:
Enter N = 30, PV = 1,153.72, PMT = 60, and FV = 1,000, and then compute rd/2 = I = 5.0%.
0 1 2 3 29 30
…
-1,153.70 60 60 60 60 60
1,000
rd = ?
*************************************************************************
OPTIONAL QUESTION: SHOULD FLOTATION COSTS BE INCLUDED IN THE ESTIMATE?
ANSWER: The actual component cost of new debt will be somewhat higher than 6 percent because
the firm will incur flotation costs in selling the new issue. However, flotation costs typically are small on
public debt issues, and, more important, much debt is placed directly with banks, insurance
companies, and the like, and in this case flotation costs are almost nonexistent.
OPTIONAL QUESTION: SHOULD YOU USE THE SIMPLE COST OF DEBT OR THE EFFECTIVE
ANNUAL COST?
ANSWER: Our 10 percent pre-tax estimate is the simple cost of debt. Because the firm’s debt has
semiannual coupons, its effective annual rate is 10.25 percent:
c(1). Because the preferred issue is perpetual, its cost is estimated as follows:
c(2). Corporate investors own most preferred stock, because 70 percent of preferred dividends received by
corporations are nontaxable. Therefore, preferred often has a lower before–tax yield than the
before-tax yield on debt issued by the same company. Note, though, that the after–tax yield to a
corporate investor, and the after-tax cost to the issuer, are higher on preferred stock than on debt.
d(1). Coleman’s earnings can either be retained and reinvested in the business or paid out as dividends. If
earnings are retained, Coleman’s shareholders forego the opportunity to receive cash and to reinvest it
d(2). The CAPM estimate for Coleman’s cost of retained earnings is 14.2 percent:
rs = rRF + (rM – rRF)βs = 7.0% + (6.0%)1.2 = 7.0% + 7.2% = 14.2%.
e. Because Coleman is a constant growth stock, the constant growth model can be used:
f. The bond-yield-plus-risk-premium estimate is 14 percent:
rs = Bond yield + Risk premium = rd + RP
g. The following table summarizes the rs estimates:
Method Estimate
CAPM 14.2%
DCF 13.8
h. The DCF method produced an estimate for the cost of retained earnings of rs = 13.8% (see the
computations given earlier). However, flotation costs of F = 15% must be incurred when new common
stock is sold, and that increases the cost of equity to 15.4%:
(1 + g)
D0
r = + g
e2 (1 – F)
P0
We could add the 1.6% flotation adjustment to the average of the three common equity costs, rs =
14%, to get re1 for up to $300,000 of new stock, which would be re1 = rs + Flotation adjustment1 = 14%
+ 1.6% = 15.6% for up to $300,000 of new stock. Similarly, the flotation adjustment for more than
i. The company is raising money in order to make an investment. The money has a cost, and this cost is
based primarily on the investors’ required rate of return, considering risk and alternative investment
opportunities. So, the new investment must provide a return at least equal to the investors’ opportunity
cost.
If the company raises capital by selling stock, the company doesn’t get all of the money that investors
j(1). Coleman’s WACC is 11.1 percent when retained earnings are used as the equity component (at 14
percent):
Up to $300,000 of equity as RE at rs = 14%:
Capital Structure Component
Weights x costs = WACC
0.3 6.0% 1.8%
WACC1 = wdrdT + wpsrps + wsrs
= 0.3(6%) + 0.1(9%) + 0.6(14%) = 1.8% + 0.9% + 8.4% = 11.1%
Note: Point out to students that we are concerned here with retained earnings for the year in question
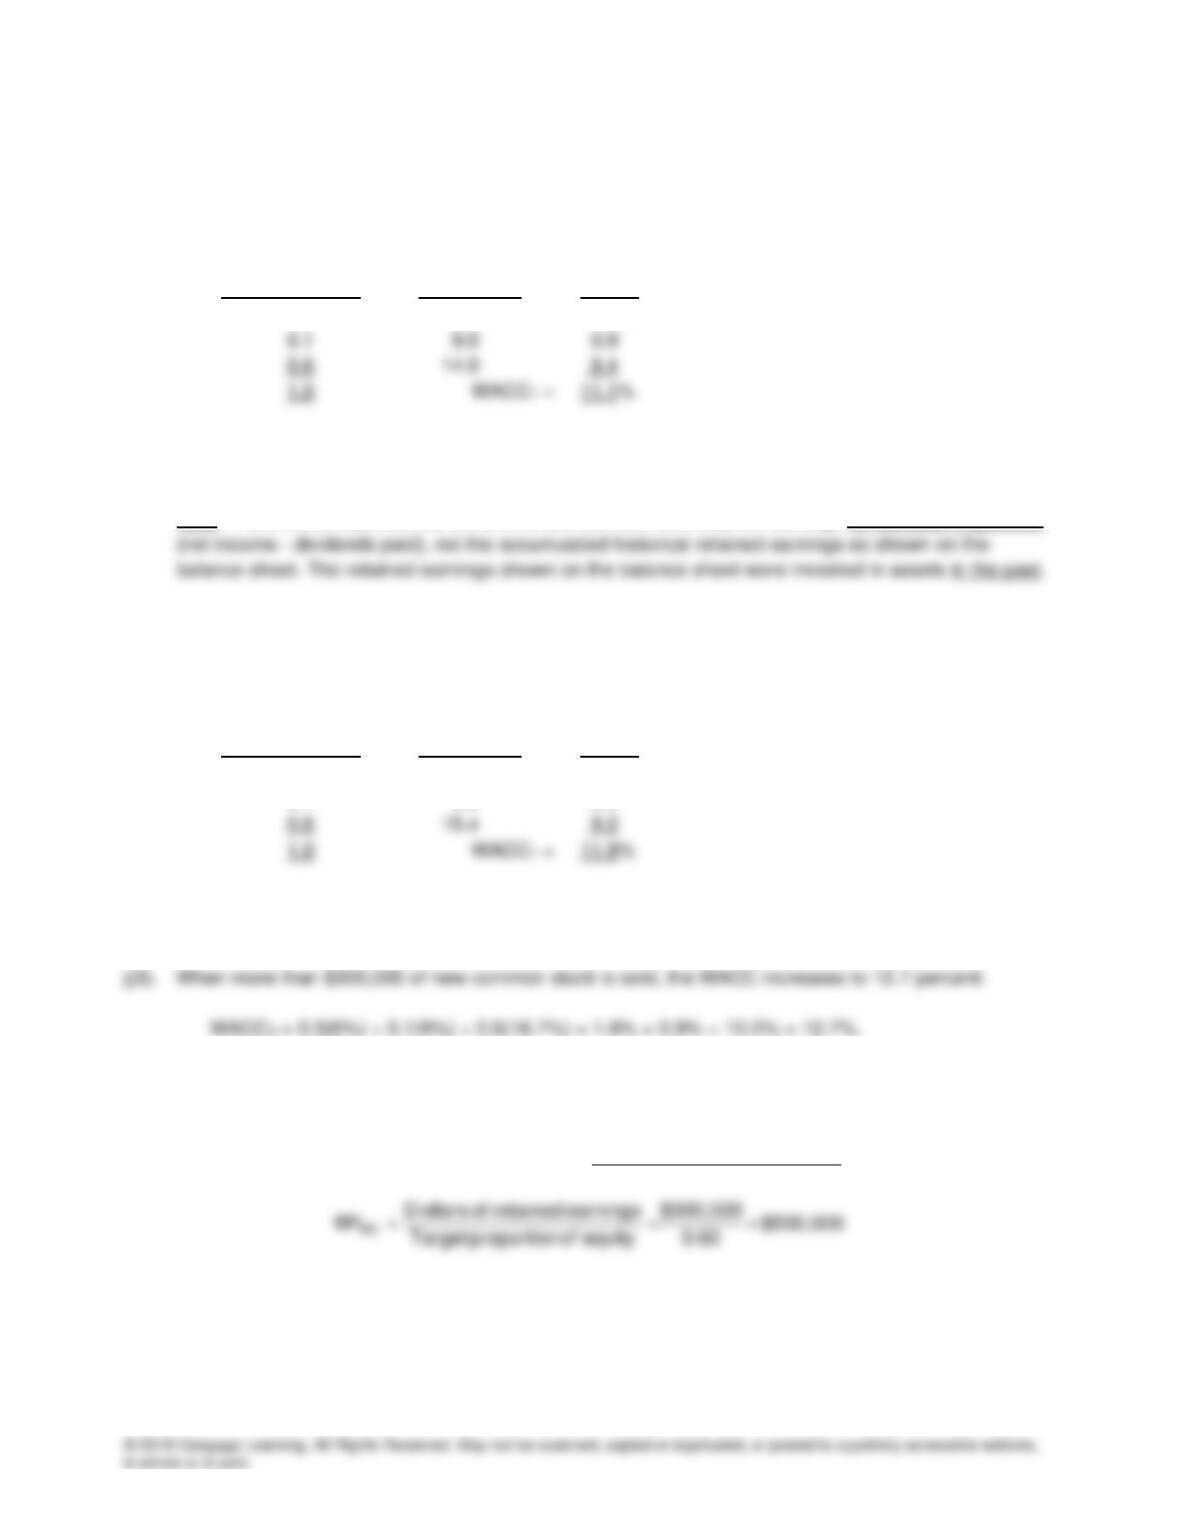
j(2). When up to $300,000 of new common stock is sold, the WACC increases from 11.1 percent to WACC2
= 12.1 percent:
Capital Structure Component
Weights x costs = WACC
0.3 6.0% 1.8%
WACC2 = 0.3(6%) + 0.1(9%) + 0.6(15.4%) = 1.8% + 0.9% + 9.2% = 11.9%.
k(1). The dollar amount of total new capital at which Coleman uses up its retained earnings and must resort
to selling new common stock will consist of the retained earnings plus debt and preferred supported by
the retained earnings, and the point is called the retained earnings break point:
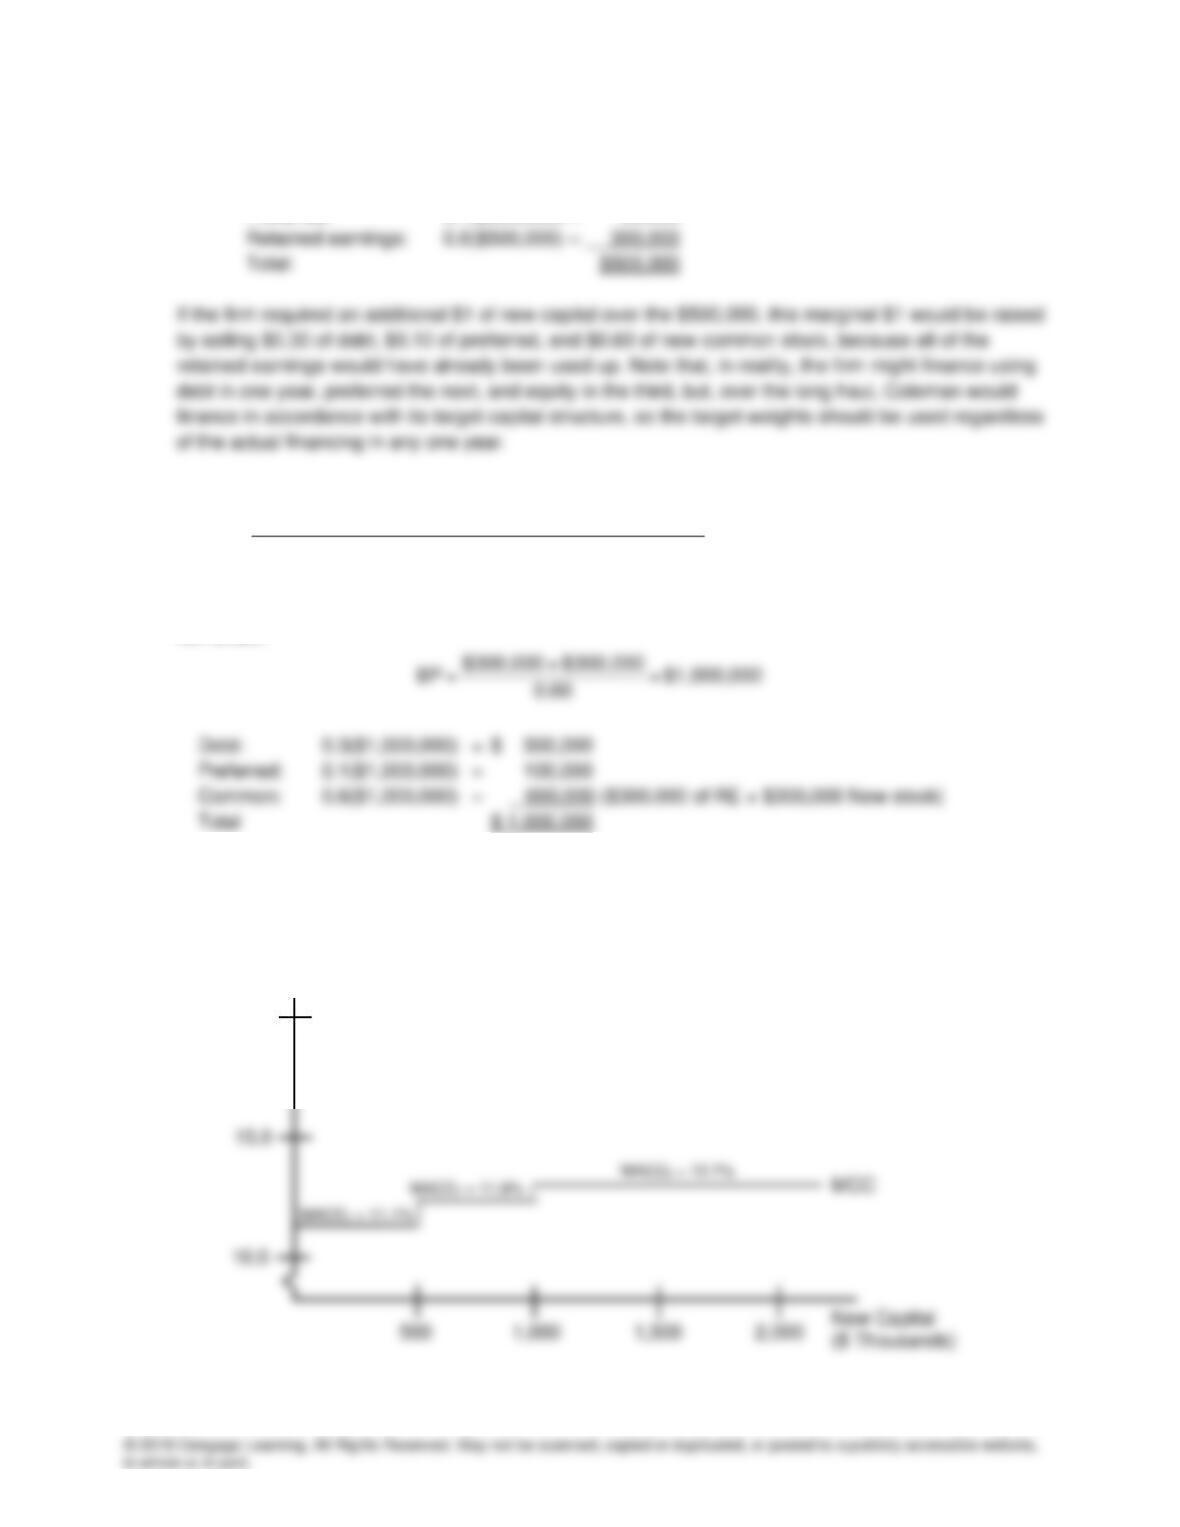
In raising $500,000 of new capital, Coleman would finance as follows:
Debt: 0.3($500,000) = $150,000
k(2).
strucure capital the in capital of type this of roportionP
type given a of capital cost lower of amount otalT
=
intoPreakB
Now we apply the formula, using $300,000 of retained earnings + $300,000 of low cost common in the
k(3). A marginal cost of capital (MCC) schedule is simply a plot of the firm’s WACC versus dollars of new
capital raised. Here is Coleman’s MCC schedule:
10.0
15.0
Percent
20.0
The plot is called the marginal cost of capital (MCC) schedule because it shows the cost of each
additional, or marginal, dollar raised (the marginal cost).
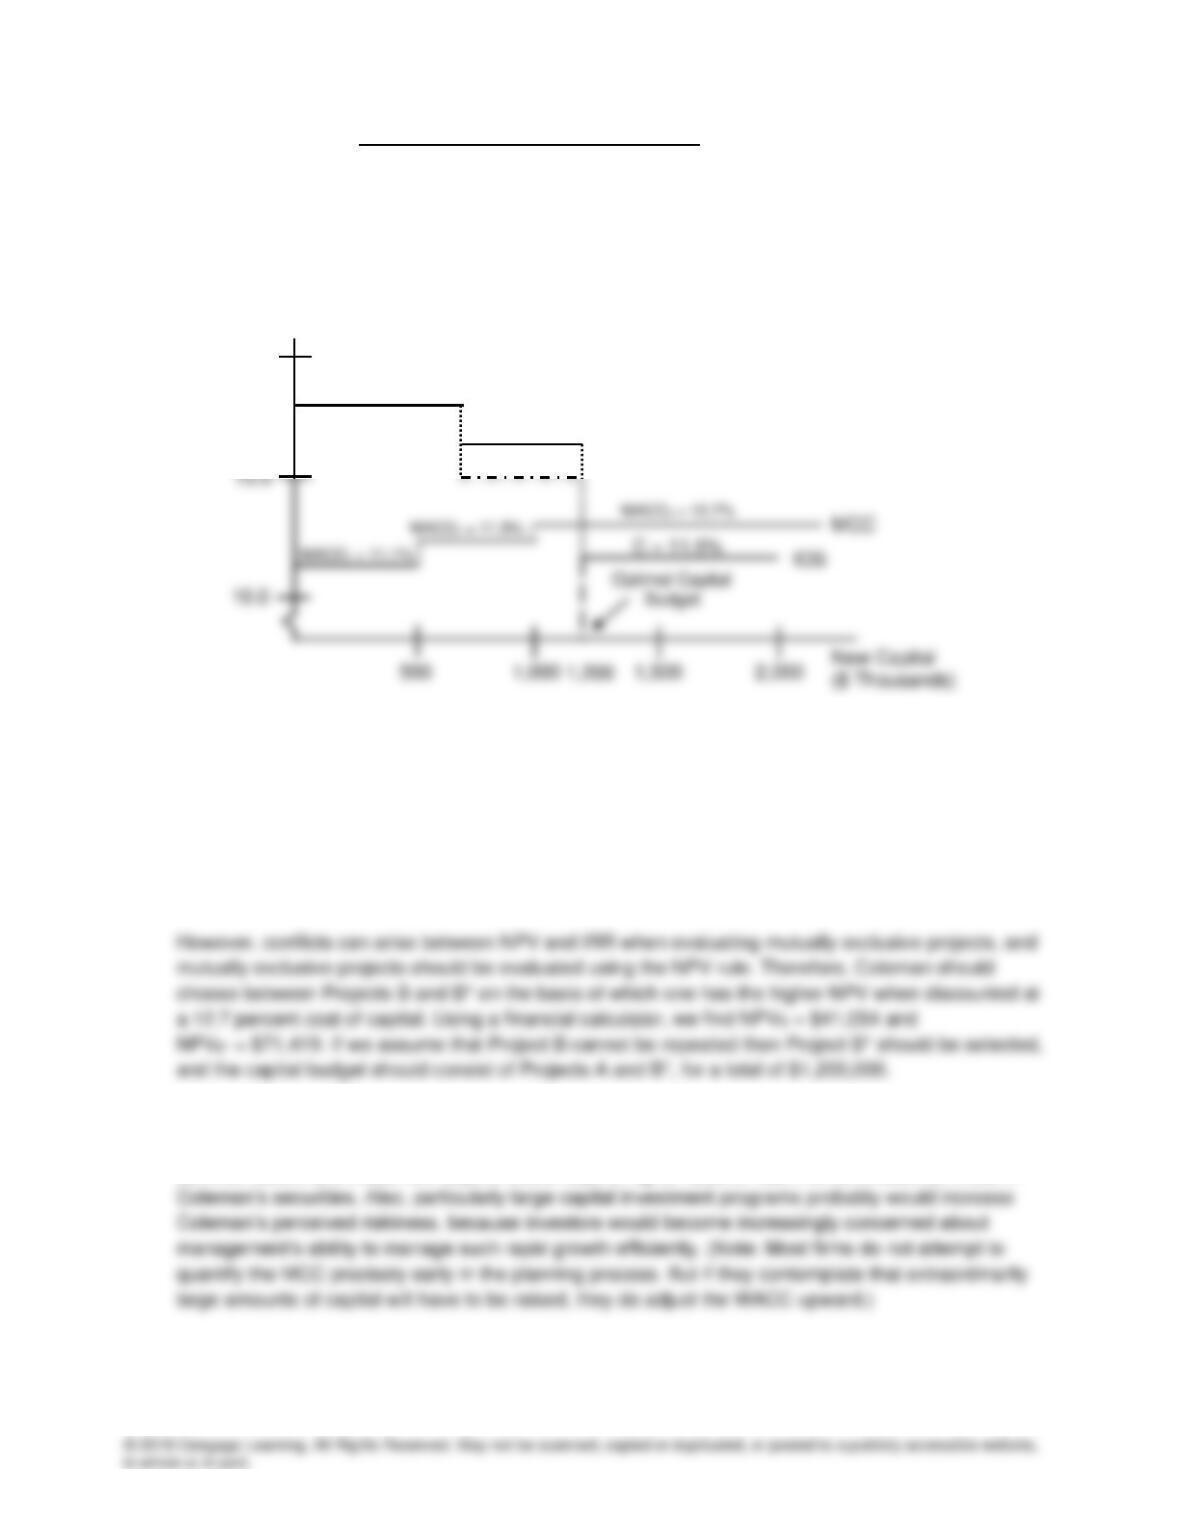
l(1). The IOS schedule is a plot of the projects being considered by cost and in descending order of IRR.
Note that Coleman actually faces two IOS schedules—one with Projects A, B, and C, and another with
Projects A, B*, and C.
IOS
($ Thousands)
10.0
15.0
MCC
A firm’s marginal cost of capital is defined by the intersection of the IOS and MCC schedules.
Therefore, Coleman’s MCC is 12.7 percent.
l(2). If a project has average risk, then its cost of capital is the firm’s MCC. Thus, assuming average risk, all
projects should be discounted at the firm’s 12.7 percent MCC. Because the IRR and NPV rules lead to
the same accept/reject decisions for independent projects, all independent projects with IRRs above
12.7 percent should be accepted. Thus, Project A is acceptable but Project C is not.
l(3). As more and more new capital is required in any year, Coleman’s WACC would eventually begin to
rise above 12.7 percent. The company would have to find new buyers for its debt, preferred, and
common stock, and those new buyers would require higher rates of return to be enticed to invest in
A = 17%
B = 16%
B* = 15%
Percent
20.0
m. If Coleman could only raise $200,000 of debt at a 10 percent cost and the remaining debt would cost
12 percent this would cause an additional break point to the MCC schedule. This debt break point
would be calculated as $200,000/0.3 = $666,667. Thus, break points would now occur at $500,000,
$666,667, and $1,000,000. The after-tax cost of this debt would be 12%(1 ─ 0.4) = 7.2%.
The WACCs at these intervals would be:
A. Between $0 and $500,000: WACC1 = 11.1%. (just as before.)
B. Between $500,000 and $666,667: WACC2 = 12.1%. (just as before.)