c. Calculate the annual sales revenues and costs (other than depreciation). Why is it
important to include inflation when estimating cash flows?
Answer: With an inflation rate of 3%, the annual revenues and costs are:
Year 1
Year 2
Year 3
Year 4
Units
1,000
1,000
1,000
1,000
Unit price
$200
$206
$212
$219
Unit cost
$100
$103
$106
$109
Sales
Costs
d. Calculate annual net operating profit after sales (NOPAT). Then calculate the
operating cash flows.
Answer:
Year 1
Year 2
Year 3
Year 4
Sales
$200,000
$206,000
$212,180.0
$218,545.4
Costs
$100,000
$103,000
$106,090.0
$109,272.7
Depreciation
$79,992
$106,680
EBIT
$20,008
Taxes (25%)
NOPAT
$15,006

e. Estimate the required net operating working capital (NOWC) for each year, and
the cash flow due to investments in net working capital.
Answer: The project requires a level of net working capital in the amount equal to 12% of the next
year’s sales. Any increase in NWC is a negative cash flow, and any decrease is a positive
f. Calculate the after-tax salvage cash flow.
Answer: When the project is terminated at the end of Year 4, the equipment can be sold for
$25,000. But, since it has been depreciated to a $0 book value, taxes must be paid on the
g. Calculate the net cash flows for each year. Based on these cash flows and the average
project cost of capital, what are the project’s NPV, IRR, MIRR, PI, payback, and
discounted payback? Do these indicators suggest that the project should be
undertaken?
Answer: The net cash flows are:
Year 0
Year 1
Year 2
Year 3
Year 4
Initial CF
-$240,000
Op. CF
$94,998
$103,920
$88,453.5
$86,400.5
NOWC CF
$26,225.0
Salvage CF
$18,750.0
Project CF
h. What does the term “risk” mean in the context of capital budgeting; to what extent
can risk be quantified; and when risk is quantified, is the quantification based
primarily on statistical analysis of historical data or on subjective, judgmental
estimates?
Answer: Risk throughout finance relates to uncertainty about future events, and in capital
budgeting, this means the future profitability of a project. For certain types of projects, it
is possible to look back at historical data and to statistically analyze the riskiness of the
investment. This is often true when the investment involves an expansion decision; for
i. 1. What are the three types of risk that are relevant in capital budgeting?
2. How is each of these risk types measured, and how do they relate to one another?
Answer: Here are the three types of project risk:
• Stand-alone risk is the project’s total risk if it were operated independently. Stand-alone
risk ignores both the firm’s diversification among projects and investors’ diversification
among firms. Stand-alone risk is measured either by the project’s standard deviation of
NPV (σNPV) or its coefficient of variation of NPV (CVNPV). Note that other profitability
measures, such as IRR and MIRR, can also be used to obtain stand-alone risk estimates.
i. 3. How is each type of risk used in the capital budgeting process?
Answer: Because management’s primary goal is shareholder wealth maximization, the most
relevant risk for capital projects is market risk. However, creditors, customers, suppliers,
and employees are all affected by a firm’s total risk. Since these parties influence the

j. 1. What is sensitivity analysis?
Answer: Sensitivity analysis measures the effect of changes in a particular variable, say revenues,
on a project’s NPV. To perform a sensitivity analysis, all variables are fixed at their
j. 2. Perform a sensitivity analysis on the cost per unit, unit sales, and salvage value.
Assume each of these variables can vary from its base-case, or expected, value by
10%, 20%, and 30%. Include a sensitivity diagram, and discuss the results.
Answer: The sensitivity data are given here in tabular form:
NPV for deviatons in inputs
Deviation from
Base Case
Cost per unit
Units
Sold
Salvage
$58,751
$60,672
$64,514
-$11,742
$134,548
$66,435
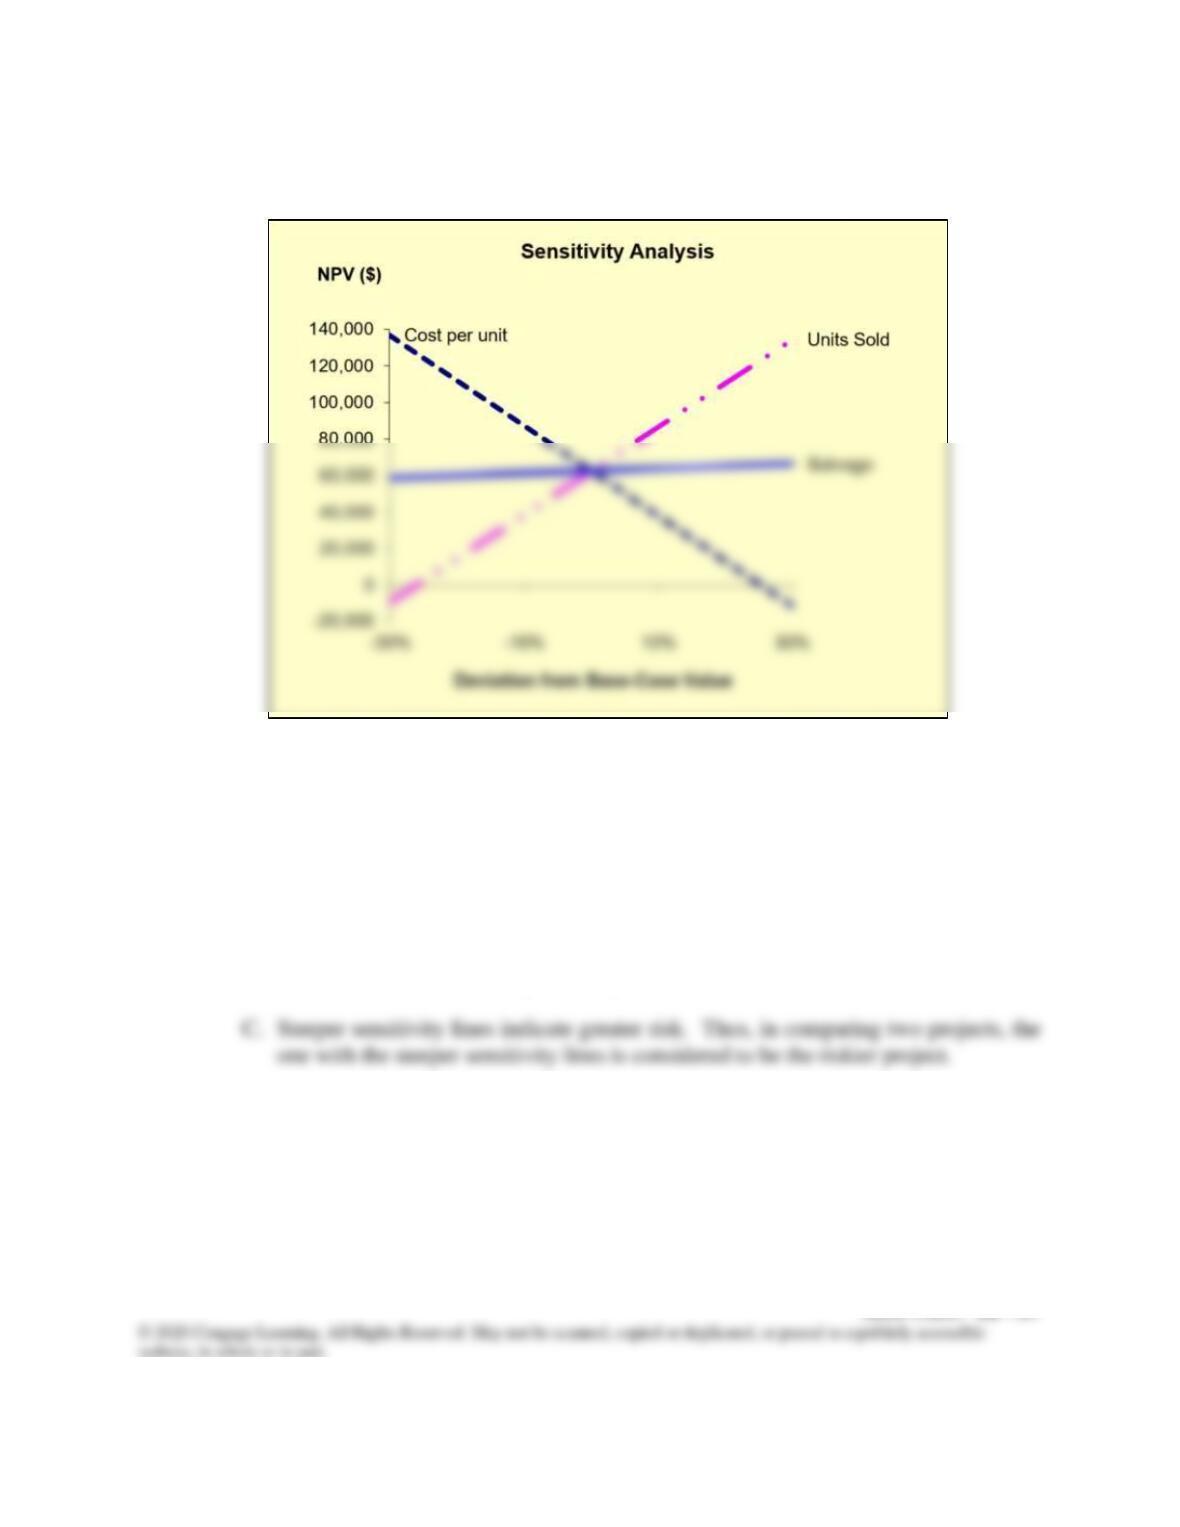
We generated these data with a spreadsheet model in the file Ch11 Mini Case.xlsx.
A. The sensitivity lines intersect at 0% change and the base-case NPV, $62,593. Since
all other variables are set at their base-case, or expected, values the zero change
situation is the base case and gives the base-case NPV, $62,593.
B. The plots for unit sales is steep and upward sloping, indicating that higher variable
values lead to higher NPVs. The salvage value line is also upward sloping, but only
slightly, indicating that the salvage value has a relatively small impact on NPV.
Conversely, the plot for cost per unit is downward sloping (and steeper than the line
for units sold), because a higher cost per unit leads to a lower NPV.

j. 3. What is the primary weakness of sensitivity analysis? What is its primary
usefulness?
Answer: The two primary disadvantages of sensitivity analysis are (1) that it does not reflect the
effects of diversification and (2) that it does not incorporate any information about the
possible magnitudes of the forecast errors. Thus, a sensitivity analysis might indicate
that a project’s NPV is highly sensitive to the sales forecast; hence, that the project is
k. Assume that Sidney Johnson is confident of her estimates of all the variables that
affect the project’s cash flows except unit sales and sales price. If product
acceptance is poor, unit sales would be only 800 units a year and the unit price
would only be $160; a strong consumer response would produce sales of 1,200 units
and a unit price of $240. Sidney believes that there is a 25% chance of poor
acceptance, a 25% chance of excellent acceptance, and a 50% chance of average
acceptance (the base case).
k. 1. What is scenario analysis?

k. 2. What is the worst-case NPV? The best-case NPV?
k. 3. Use the worst-, base-, and best-case NPVs and probabilities of occurrence to find
the project’s expected NPV, standard deviation, and coefficient of variation.
Answer: We used a spreadsheet model to develop the scenarios, which are summarized below:
Scenario
Prob.
Unit
Sales
Unit Price
NPV
Coefficient of Variation = Std Dev / Expected NPV =
l. Are there problems with scenario analysis? Define simulation analysis, and discuss
its principal advantages and disadvantages.
Answer: Scenario analysis examines several possible scenarios, usually worst case, most likely
case, and best case. Thus, it usually considers only 3 possible outcomes. Obviously the
world is much more complex, and most projects have an almost infinite number of
possible outcomes.
m. 1. Assume that Shrieves’ average project has a coefficient of variation in the range of
0.2 to 0.4. Would the new line be classified as high risk, average risk, or low risk?
What type of risk is being measured here?
Answer: The project has a CV of 1.15, which is above the average range of 0.2 to 0.4, so it falls

m. 2. Shrieves typically adds or subtracts 3 percentage points to the overall cost of capital
to adjust for risk. Should the new line be accepted?
Answer: Since the project is judged to have above-average risk, its differential risk-adjusted, or
project, cost of capital would be 13%. At this discount rate, its NPV would be $41,584,
m. 3. Are there any subjective risk factors that should be considered before the final
decision is made?
Answer: A numerical analysis such as this one may not capture all of the risk factors inherent in
the project. If the project has a potential for bringing on harmful lawsuits, then it might
n. What is a real option? What are some types of real options?
Answer: Real options exist when managers can influence the size and risk of a project’s cash flows
by taking different actions during the project’s life in response to changing market