And the standard deviation of Stock B is:
2
B
=.33(–.073 – .1160)2 + .33(.128 – .1160)2 + .33(.293 – .1160)2
26. The expected return of an asset is the sum of the probability of each state occurring times the rate of
return if that state occurs. So, the expected return of each stock is:
E(RJ) = .30(–.050) + .55(.118) + .15(.274)
E(RJ) = .0910, or 9.10%
To calculate the standard deviation, we first need to calculate the variance. To find the variance, we
find the squared deviations from the expected return. We then multiply each possible squared deviation
by its probability, and then sum. The result is the variance. So, the variance and standard deviation of
Stock J are:
J
2
=.30(–.050 – .0910)2 + .55(.118 – .0910)2 + .15(.274 – .0910)2
And the standard deviation of Stock K is:
K
2
=.30(.029 – .0641)2 + .55(.074 – .0641)2 + .15(.098 – .0641)2
K
27. a. The expected return of the portfolio is the sum of the weight of each asset times the expected
return of each asset, so:
E(RP) = XFE(RF) + XGE(RG)
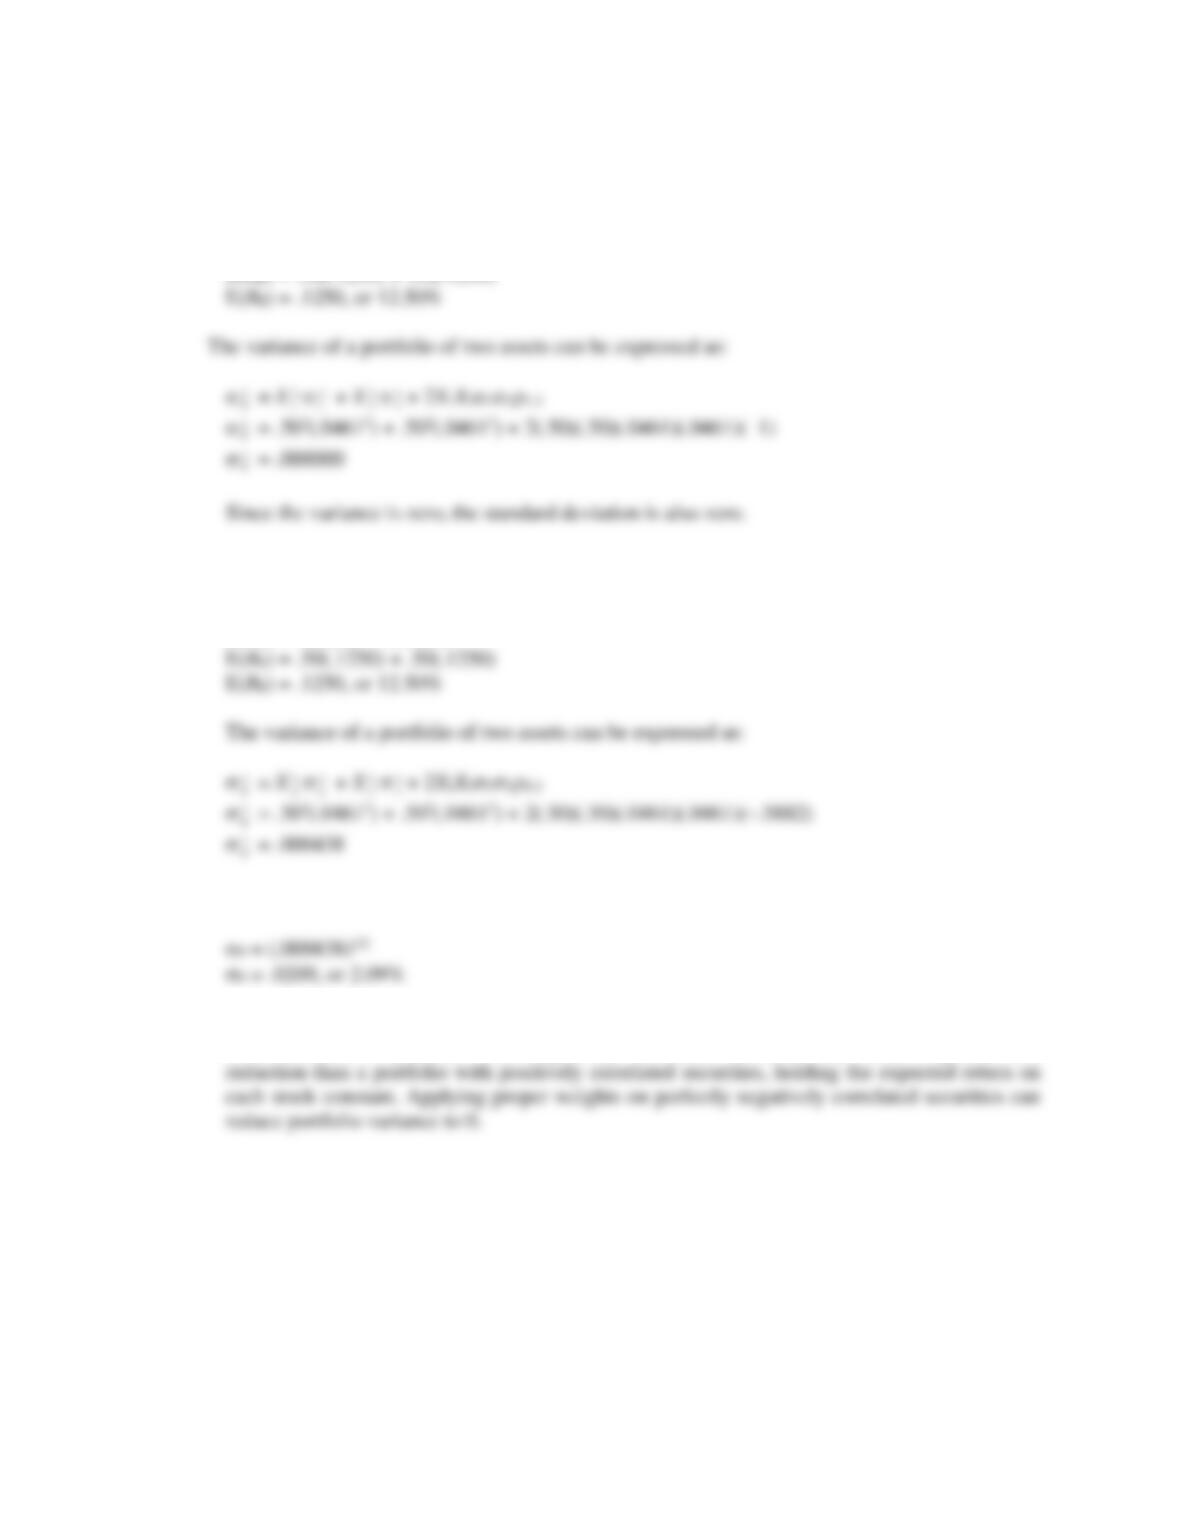
b. The variance of a portfolio of two assets can be expressed as:
2
P
= X
2
F
2
F
+ X
2
G
2
G
+ 2XFXG FGF,G
2
P
28. a. The expected return of the portfolio is the sum of the weight of each asset times the expected
return of each asset, so:
E(RP) = XAE(RA) + XBE(RB)
E(RP) = .40(.11) + .60(.13)
E(RP) = .1220, or 12.20%
2
P
29. a. (i) Using the equation to calculate beta, we find:
(ii) Using the equation to calculate beta, we find:
(iii) Using the equation to calculate beta, we find:
C = (C,M)(C)/M
C = (.35)(.65)/.20
C = 1.14
b. Using the CAPM to find the expected return of the stock, we find:
Firm A:
E(RA) = Rf + A[E(RM) – Rf]
According to the CAPM, the expected return on Firm A’s stock should be 10.95 percent.
However, the expected return on Firm A’s stock given in the table is only 10 percent. Therefore,
Firm A’s stock is overpriced, and you should sell it.
Firm B:
30. Because a well-diversified portfolio has no unsystematic risk, this portfolio should lie on the Capital
Market Line (CML). The slope of the CML equals:
SlopeCML = [E(RM) – Rf]/M
SlopeCML = (.115 – .041)/.19
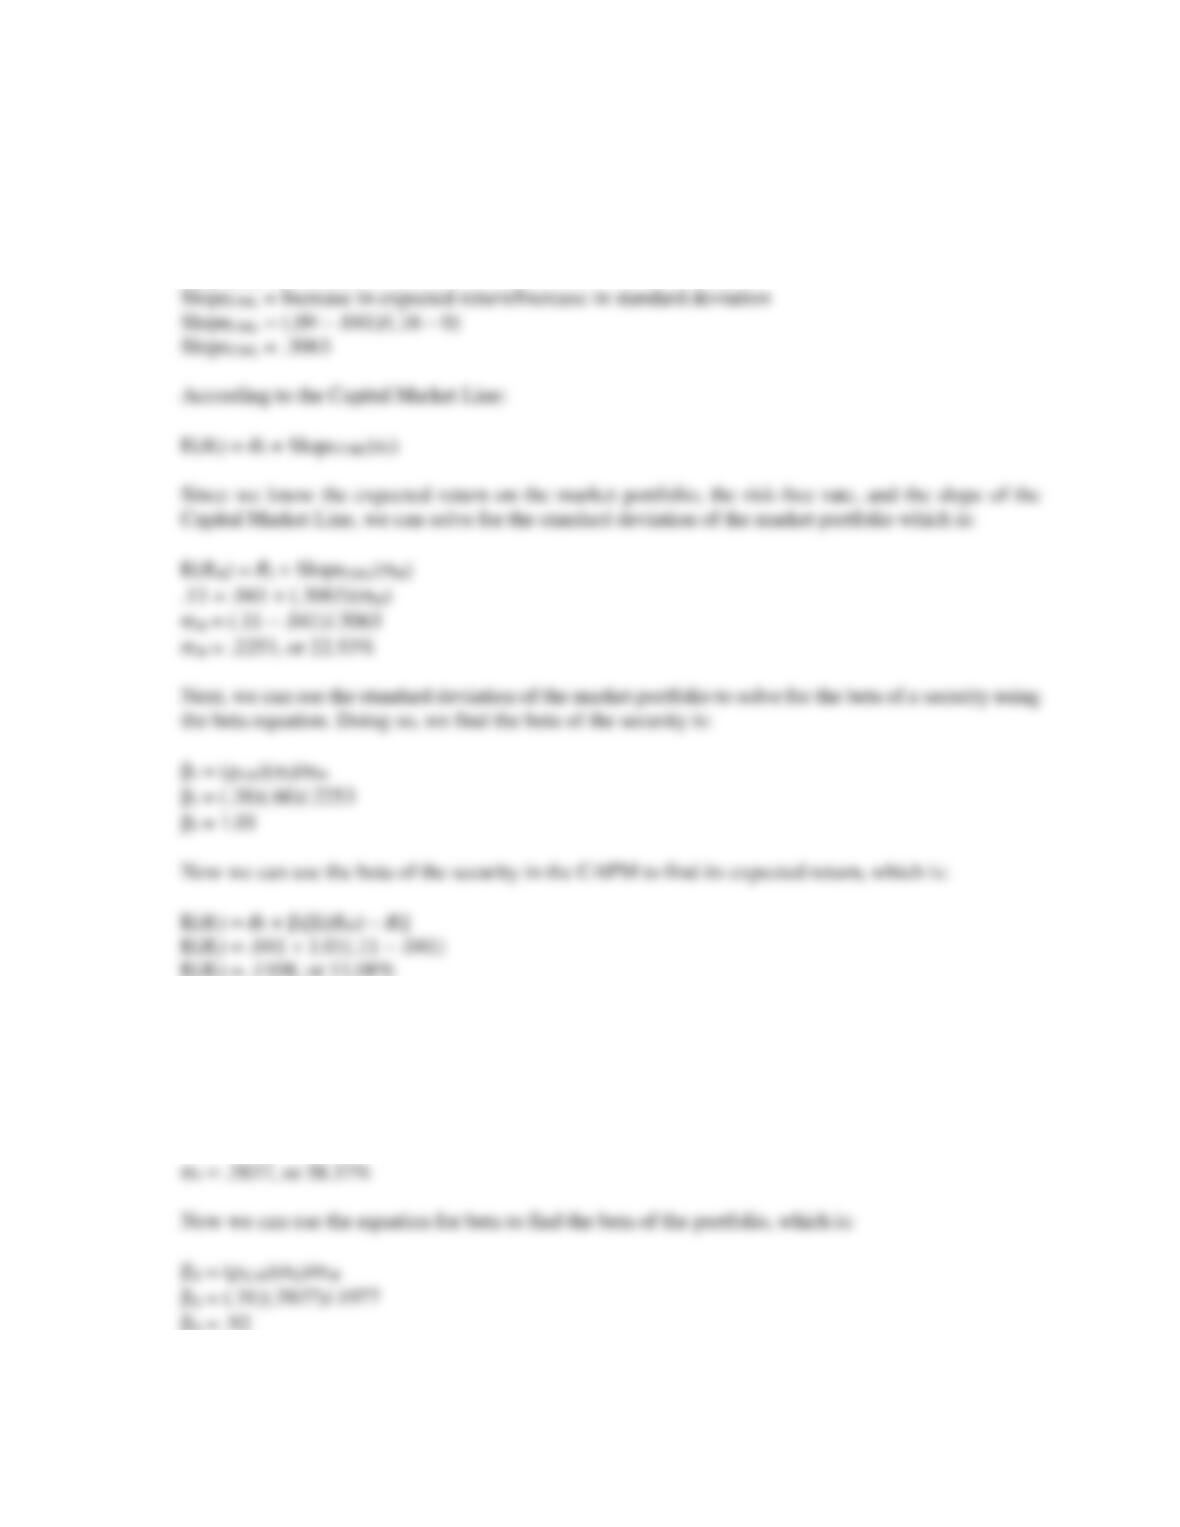
31. First, we can calculate the standard deviation of the market portfolio using the Capital Market Line
(CML). We know that the risk-free asset has a return of 4.1 percent and a standard deviation of zero
and the portfolio has an expected return of 9 percent and a standard deviation of 16 percent. These two
points must lie on the Capital Market Line. The slope of the Capital Market Line equals:
SlopeCML = Rise/Run
32. First, we need to find the standard deviation of the market and the portfolio, which are:
M = .03911/2
M = .1977, or 19.77%
Z = .34071/2
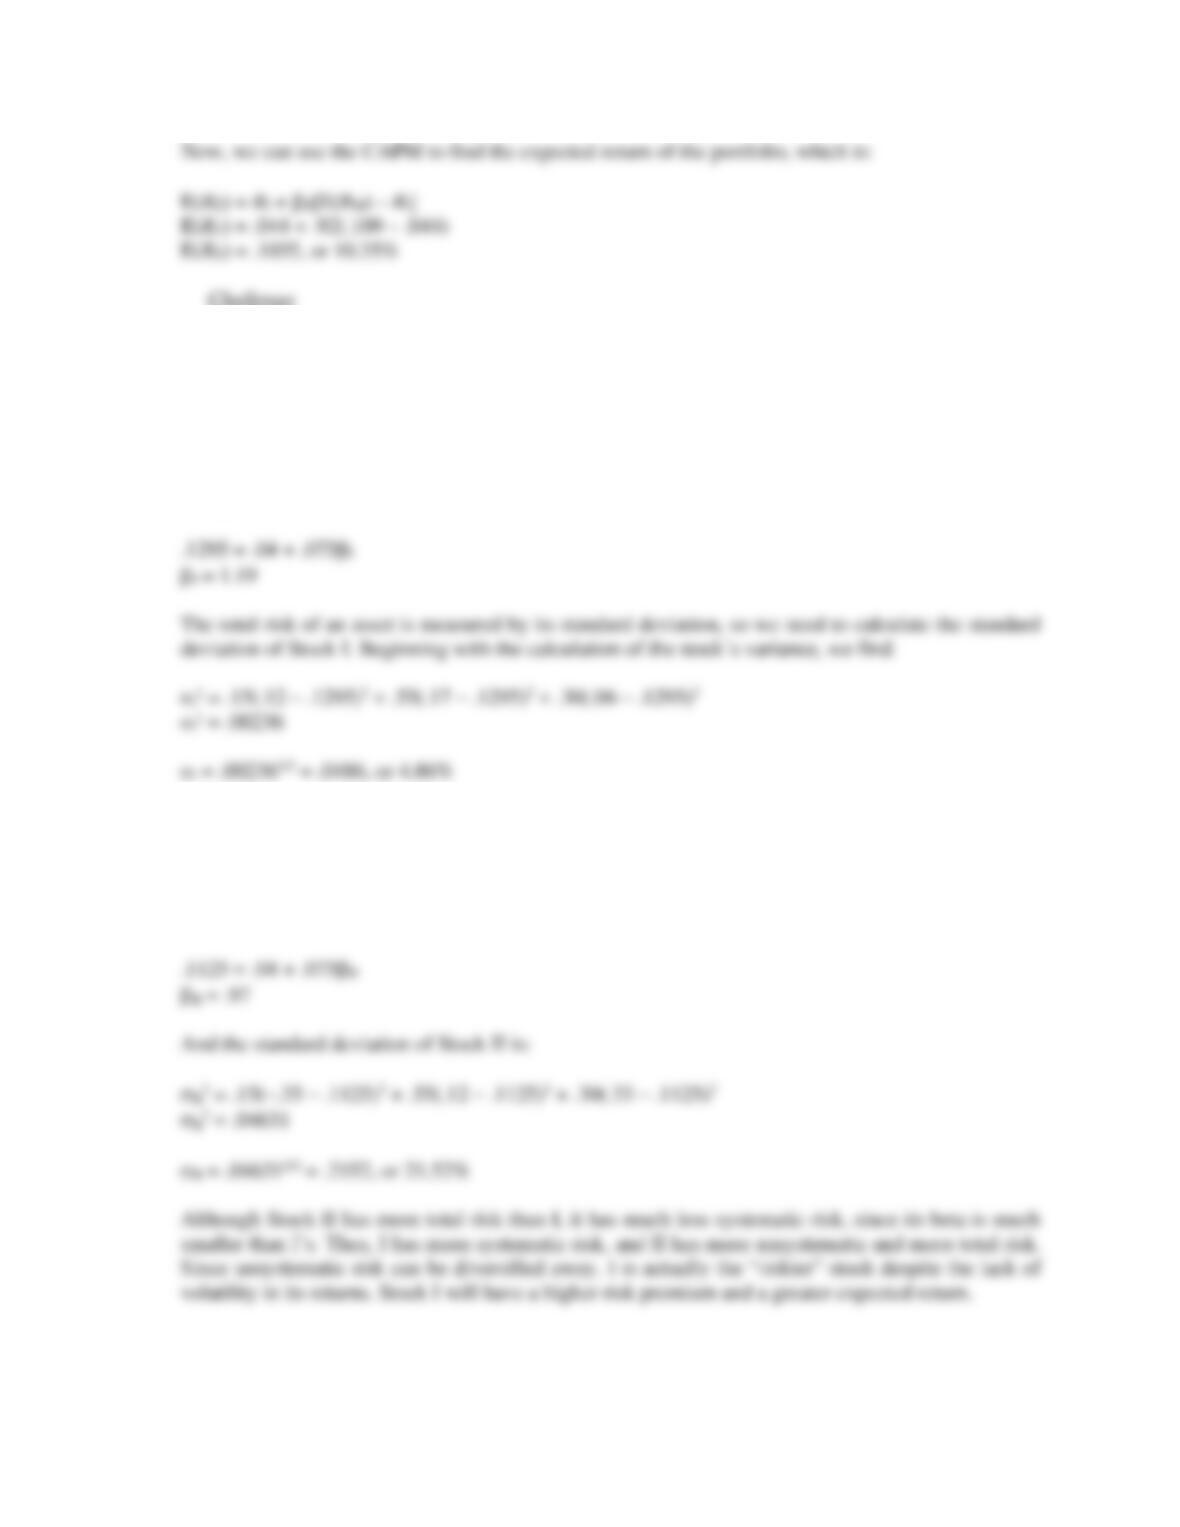
33. The amount of systematic risk is measured by the of an asset. Since we know the market risk
premium and the risk-free rate, if we know the expected return of the asset we can use the CAPM to
solve for the of the asset. The expected return of Stock I is:
E(RI) = .15(.12) + .55(.17) + .30(.06) = .1295, or 12.95%
Using the CAPM to find the of Stock I, we find:
Using the same procedure for Stock II, we find the expected return to be:
E(RII) = .15(–.35) + .55(.12) + .30(.33) = .1125, or 11.25%
Using the CAPM to find the of Stock II, we find:
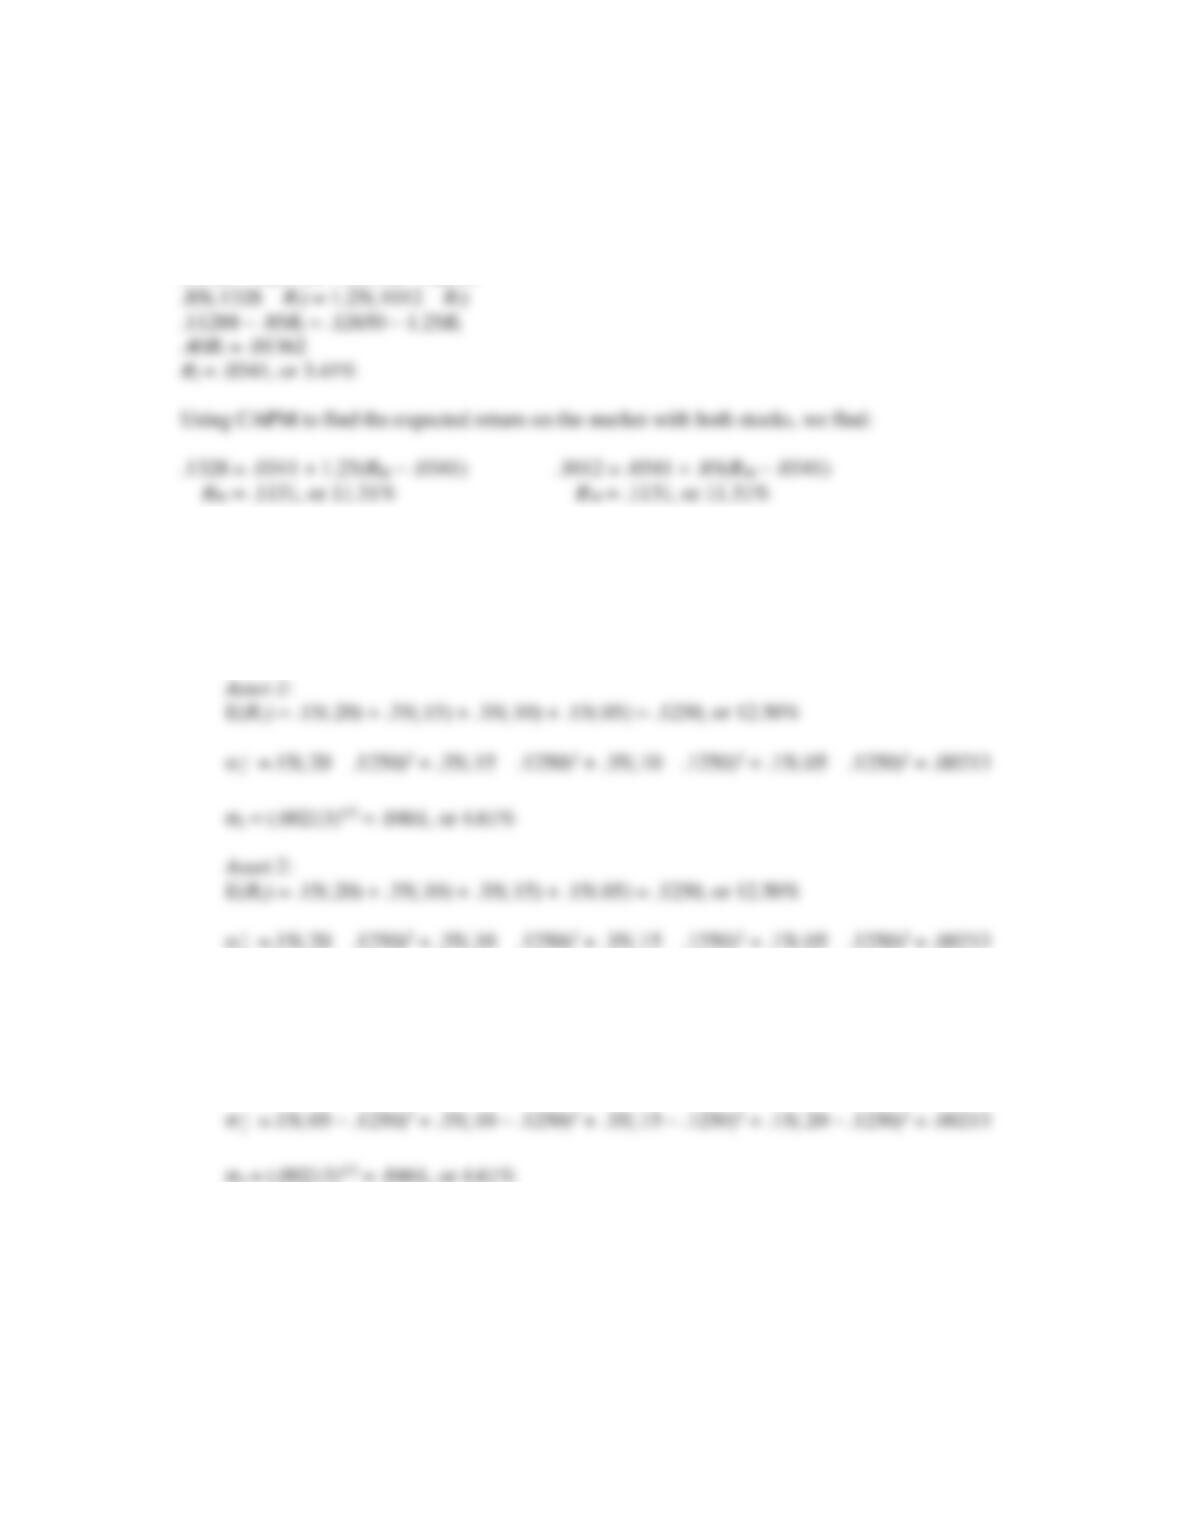
34. Here we have the expected return and beta for two assets. We can express the returns of the two assets
using CAPM. If the CAPM is true, then the security market line holds as well, which means all assets
have the same risk premium. Setting the reward-to-risk ratios of the assets equal to each other and
solving for the risk-free rate, we find:
(.1328 – Rf)/1.25 = (.1012 – Rf)/.85
35. a. The expected return of an asset is the sum of the probability of each state occurring times the rate
of return if that state occurs. To calculate the standard deviation, we first need to calculate the
variance. To find the variance, we find the squared deviations from the expected return. We then
multiply each possible squared deviation by its probability, and then sum. The result is the
variance. So, the expected return and standard deviation of each stock are:
2
2 = (.00213)1/2 = .0461, or 4.61%
Asset 3:
E(R3) = .15(.05) + .35(.10) + .35(.15) + .15(.20) = .1250, or 12.50%
3
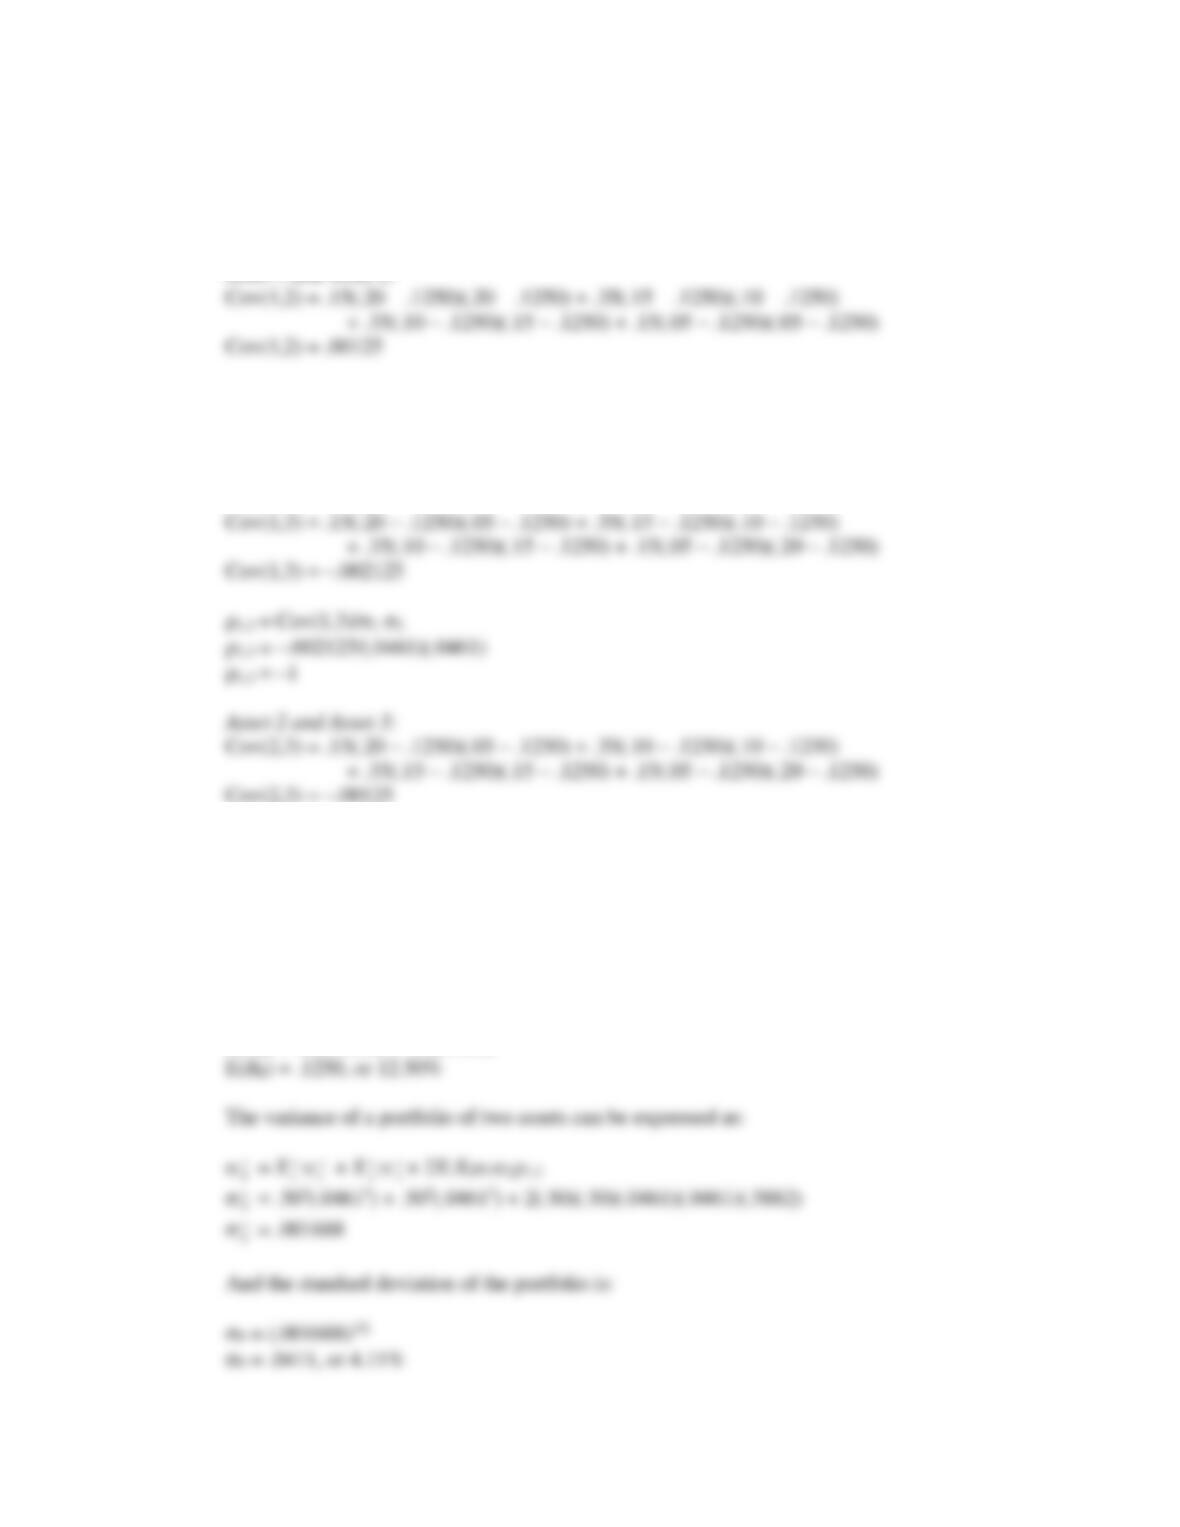
b. To find the covariance, we multiply each possible state times the product of each asset’s deviation
from the mean in that state. The sum of these products is the covariance. The correlation is the
covariance divided by the product of the two standard deviations. So, the covariance and
correlation between each possible set of assets are:
Asset 1 and Asset 2:
1,2 = Cov(1,2)/1 2
1,2 = .00125/(.0461)(.0461)
1,2 = .5882
Asset 1 and Asset 3:
2,3 = Cov(2,3)/2 3
2,3 = –.00125/(.0461)(.0461)
2,3 = –.5882
c. The expected return of the portfolio is the sum of the weight of each asset times the expected
return of each asset, so, for a portfolio of Asset 1 and Asset 2:
E(RP) = X1E(R1) + X2E(R2)
E(RP) = .50(.1250) + .50(.1250)
d. The expected return of the portfolio is the sum of the weight of each asset times the expected
return of each asset, so, for a portfolio of Asset 1 and Asset 3:
E(RP) = X1E(R1) + X3E(R3)
E(RP) = .50(.1250) + .50(.1250)
e. The expected return of the portfolio is the sum of the weight of each asset times the expected
return of each asset, so, for a portfolio of Asset 2 and Asset 3:
E(RP) = X2E(R2) + X3E(R3)
And the standard deviation of the portfolio is:
f. As long as the correlation between the returns on two securities is below 1, there is a benefit to
diversification. A portfolio with negatively correlated securities can achieve greater risk
36. a. The expected return of an asset is the sum of the probability of each state occurring times the rate
of return if that state occurs. So, the expected return of each stock is:
E(RA) = .15(–.13) + .60(.12) + .25(.34)
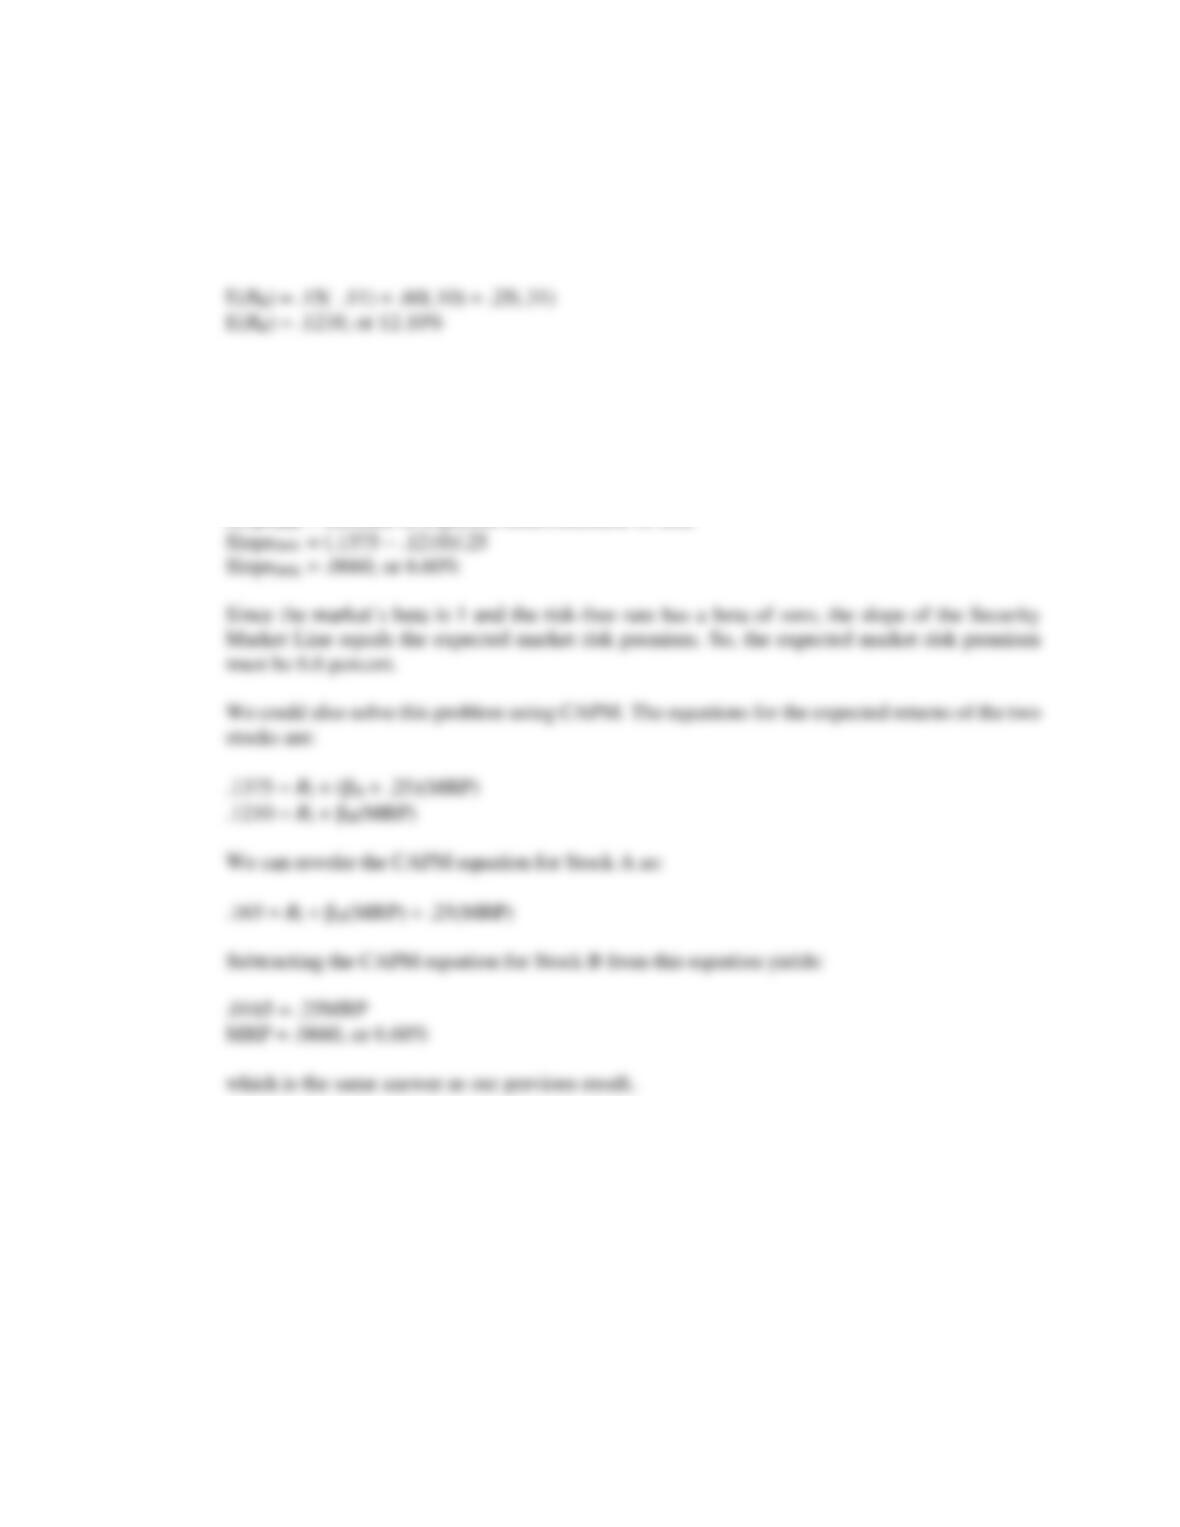
E(RA) = .1375, or 13.75%
b. We can use the expected returns we calculated to find the slope of the Security Market Line.
We know that the beta of Stock A is .25 greater than the beta of Stock B. Therefore, as beta
increases by .25, the expected return on a security increases by .0165 (= .1375 – .1210). The
slope of the security market line (SML) equals:
SlopeSML = Rise/Run
SlopeSML = Increase in expected return/Increase in beta
37. a. A typical, risk-averse investor seeks high returns and low risks. For a risk-averse investor holding
a well-diversified portfolio, beta is the appropriate measure of the risk of an individual security.
To assess the two stocks, we need to find the expected return and beta of each of the two
securities.
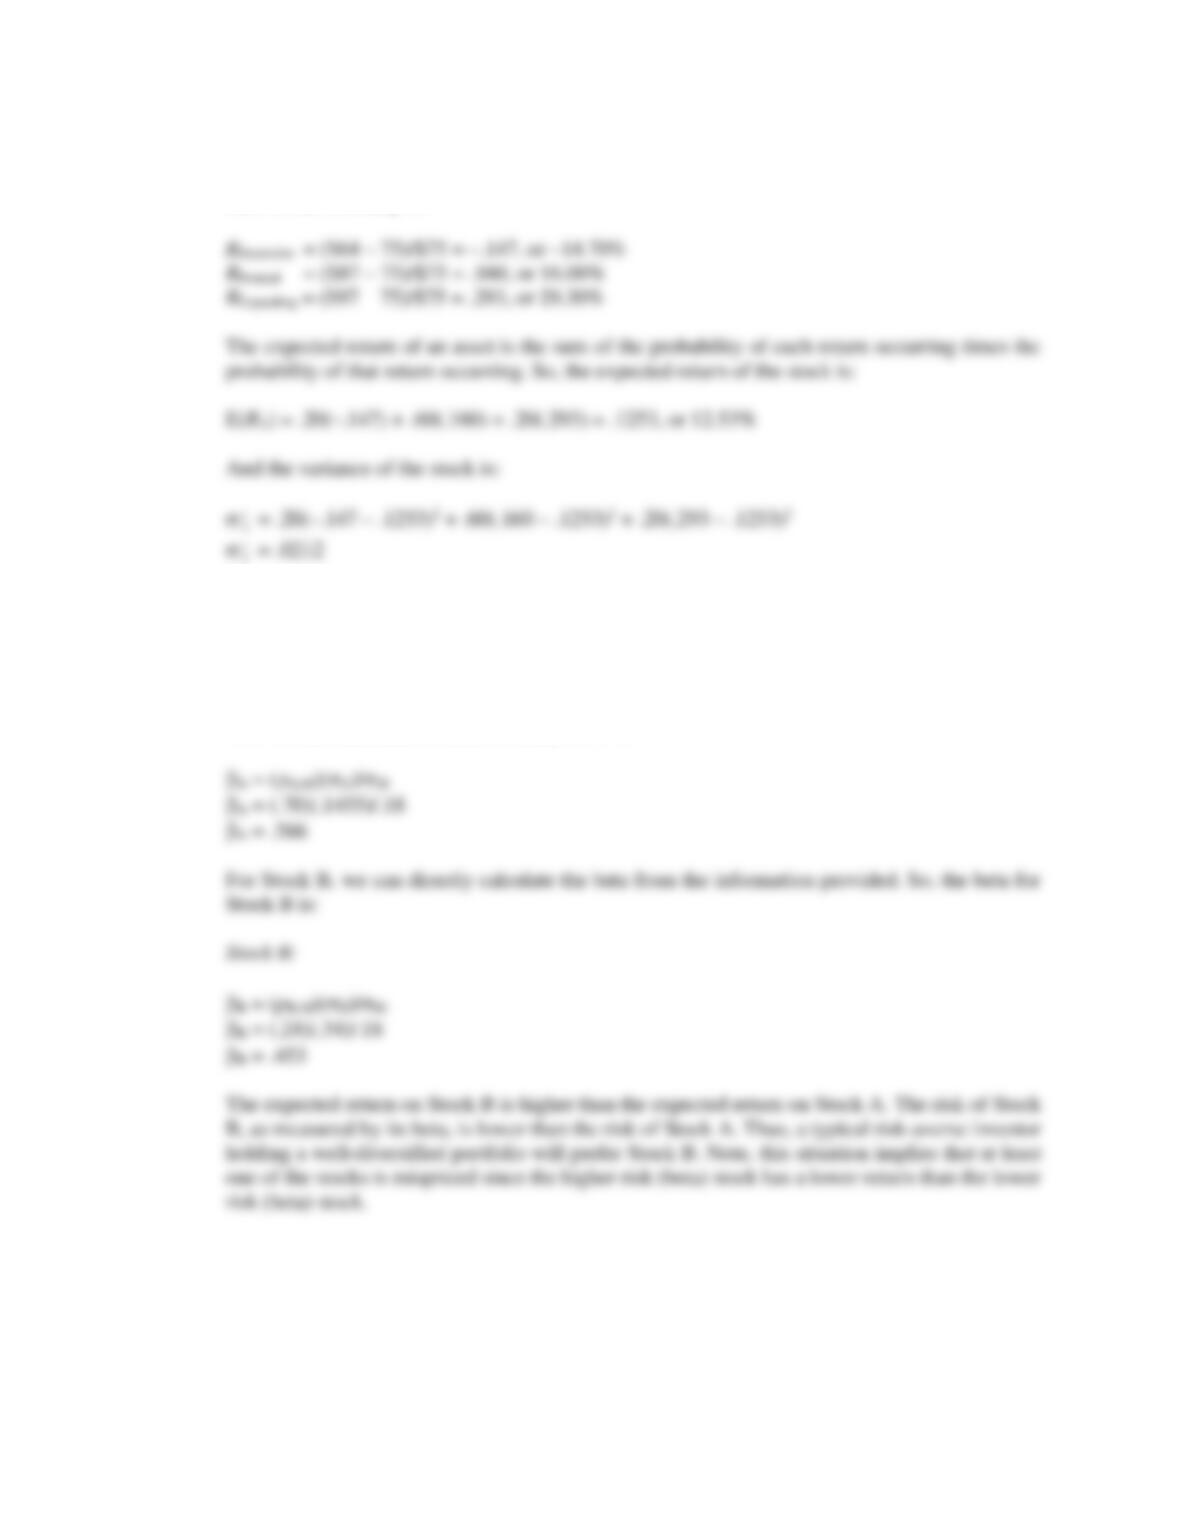
Stock A:
Since Stock A pays no dividends, the return on Stock A is: (P1 – P0)/P0. So, the return for each
state of the economy is:
Which means the standard deviation is:
A = .02121/2
A = .1455, or 14.55%
Now we can calculate the stock’s beta, which is:
b. The expected return of the portfolio is the sum of the weight of each asset times the expected
return of each asset, so:
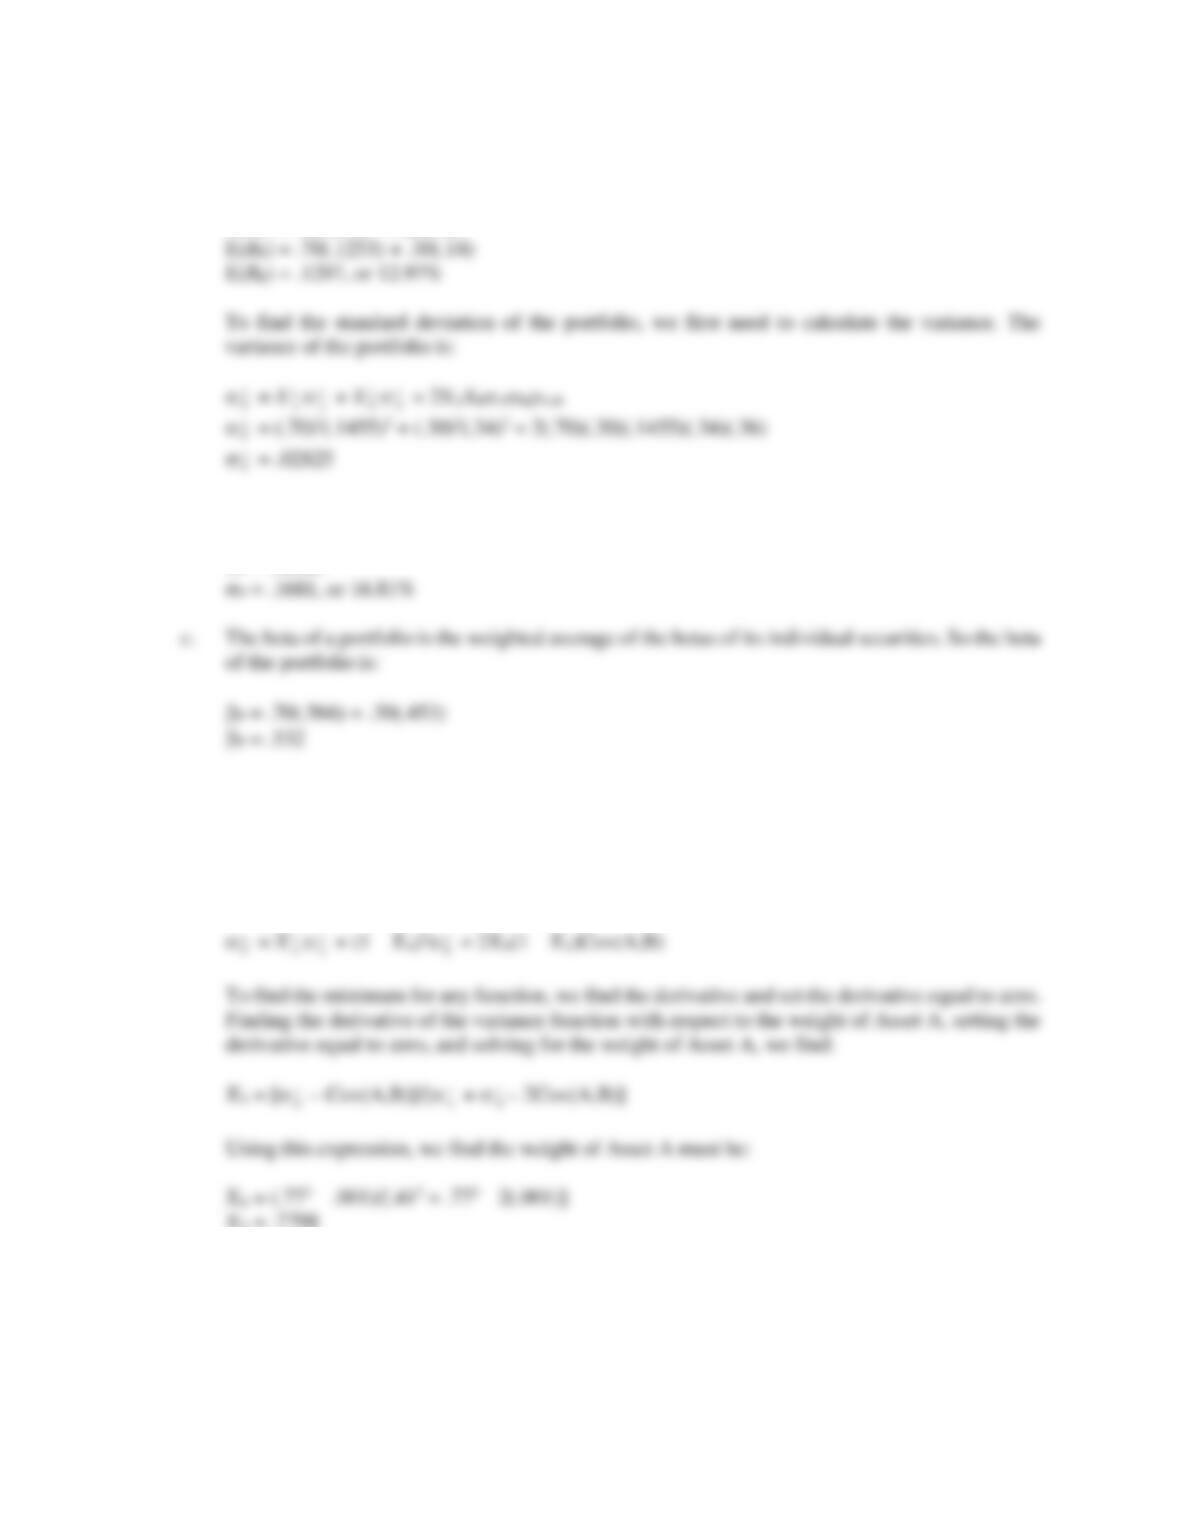
E(RP) = XAE(RA) + XBE(RB)
And the standard deviation of the portfolio is:
P = .028251/2
38. a. The variance of a portfolio of two assets equals:
2
P
= X
2
A
2
A
+ X
2
B
2
B
+ 2XAXBCov(A,B)
Since the weights of the assets must sum to one, we can write the variance of the portfolio as:
2
P
2
A
2
A
2
B
2
P
2
A
2
A
2
B
2
2
P
b. Using the weights calculated in part a, the expected return of the portfolio is:
E(RP) = XAE(RA) + XBE(RB)
c. Using the derivative from part a, with the new covariance, the weight of each stock in the
minimum variance portfolio is:
XA = [
2
B
– Cov(A,B)]/[
2
A
+
2
B
– 2Cov(A,B)]
d. The variance of the portfolio with the weights in part c is:
2
P
= X
2
A
2
A
+ X
2
B
2
B
+ 2XAXBCov(A,B)
2
P