Solution 11/26/2018
Chapter: 11 Cash Flow Estimation and Risk Analysis Note: when creating student version, be sure to delete Scenario Summary worksheet. Also delete the Best and Worse case scenarios from the Scenario Manager. Also delete this message in the student version.
Problem: 18
Input Data (in thousands of dollars)
Scenario name Base Case Note: the items in red will be used in a scenario analysis.
Probability of scenario 50%
Equipment cost $10,000
Net operating working capital/Sales 10% Key Results:
First year sales (in units) 1,000 NPV = $3,820
Sales price per unit $24.00 IRR = 22.2%
Variable cost per unit (excl. depr.) $18.00 Payback = 2.83
Nonvariable costs (excl. depr.) $1,000
Inflation in prices and costs 3.0%
Estimated salvage value at year 4 $500
Depreciation years Year 1 Year 2 Year 3 Year 4
Depreciation rates 20.00% 32.00% 19.20% 11.52%
Tax rate 25%
WACC for average-risk projects 10%
Intermediate Calculations
0 1 2 3 4
Units sold 1,000 1,000 1,000 1,000
Sales price per unit (excl. depr.) $24.00 $24.72 $25.46 $26.23
Variable costs per unit (excl. depr.) $18.00 $18.54 $19.10 $19.67
Nonvariable costs (excl. depr.) 1,000 1,030 1,061 1,093
Sales revenue $24,000 $24,720 $25,462 $26,225
Required level of net operating working capital $2,400 $2,472 $2,546 $2,623 $0
Basis for depreciation $10,000
Annual equipment depr. rate 20.00% 32.00% 19.20% 11.52%
Annual depreciation expense $2,000 $3,200 $1,920 $1,152
Salvage value $500
Profit (or loss) on salvage -$1,228
Tax on profit (or loss) -$307
Net cash flow due to salvage $807
Cash Flow Forecast
0 1 2 3 4
Sales revenue $24,000 $24,720 $25,462 $26,225
Variable costs 18,000 18,540 19,096 19,669
Nonvariable operating costs 1,000 1,030 1,061 1,093
Depreciation (equipment) 2,000 3,200 1,920 1,152
Oper. income before taxes (EBIT) $3,000 $1,950 $3,385 $4,312
Taxes on operating income (40%) 750 488 846 1,078
Net operating profit after taxes $2,250 $1,463 $2,538 $3,234
Add back depreciation 2,000 3,200 1,920 1,152
Equipment purchases -$10,000
Cash flow due to change in NOWC -$2,400 -$72 -$74 -$76 $2,623
Net cash flow due to salvage $807
Net Cash Flow (Time line of cash flows) -$12,400 $4,178 $4,588 $4,382 $7,815
Key Results: Appraisal of the Proposed Project
Net Present Value (at 10%) = $3,820
IRR = 22.19%
MIRR = 17.64%
Payback = 2.83
Discounted Payback = 3.19
Data for Payback Years
0 1 2 3 4
Data for Discounted Payback Years
0 1 2 3 4
Years
Years
-20% 800 $1,006
-10% 900 $2,413
0% 1,000 $3,820
a. Develop a spreadsheet model, and use it to find the project’s NPV, IRR, and payback.
Webmasters.com has developed a powerful new server that would be used for corporations’ Internet activities. It
would cost $10 million at Year 0 to buy the equipment necessary to manufacture the server. The project would
require net working capital at the beginning of each year in an amount equal to 10% of the year’s projected sales;
for example, NWC0 = 10%(Sales1).
Webmasters’ federal-plus-state tax rate is 25%. Its cost of capital is 10% for average-risk projects, defined as
projects with a coefficient of variation of NPV between 0.8 and 1.2. Low-risk projects are evaluated with a WACC of
8%, and high-risk projects at 13%. Also, the project’s returns are expected to be highly correlated with returns on
believes that variable costs would amount to $18,000 per unit. After Year 1, the sales price and variable costs will
increase at the 3% inflation rate.
the firm’s other assets.
Years
should be the number 1,000 and NOT have the formula =D31 in
that cell. This is because you’ll use D31 as the column input
cell in the data table and if Excel tries to iteratively replace Cell
D31 with the formula =D31 rather than a series of numbers,
Excel will calculate the wrong answer. Unfortunately, Excel
won’t tell you that there is a problem, so you’ll just get the
wrong values for the data table!
Page 1
10% 1,100 $5,228
20% 1,200 $6,635
% Deviation % Deviation
from Base NPV from Base NPV
Base Case $24.00 $3,820 Base Case $18.00 $3,820
-20% $19.20 -$7,915 -20% $14.40 $12,741
-10% $21.60 -$2,047 -10% $16.20 $8,280
0% $24.00 $3,820 0% $18.00 $3,820
10% $26.40 $9,688 10% $19.80 -$640
20% $28.80 $15,555 20% $21.60 -$5,100
VARIABLE COST
SALES PRICE
Note about data tables. The data in the column input should
NOT be input using a cell reference to the column input cell.
For example, the base case 1st Year Unit Sales in Cell B100
should be the number 1,000 and NOT have the formula =D31 in
that cell. This is because you’ll use D31 as the column input
cell in the data table and if Excel tries to iteratively replace Cell
D31 with the formula =D31 rather than a series of numbers,
Excel will calculate the wrong answer. Unfortunately, Excel
won’t tell you that there is a problem, so you’ll just get the
wrong values for the data table!
Sales price
8,000
10,000
12,000
14,000
16,000
NPV ($)
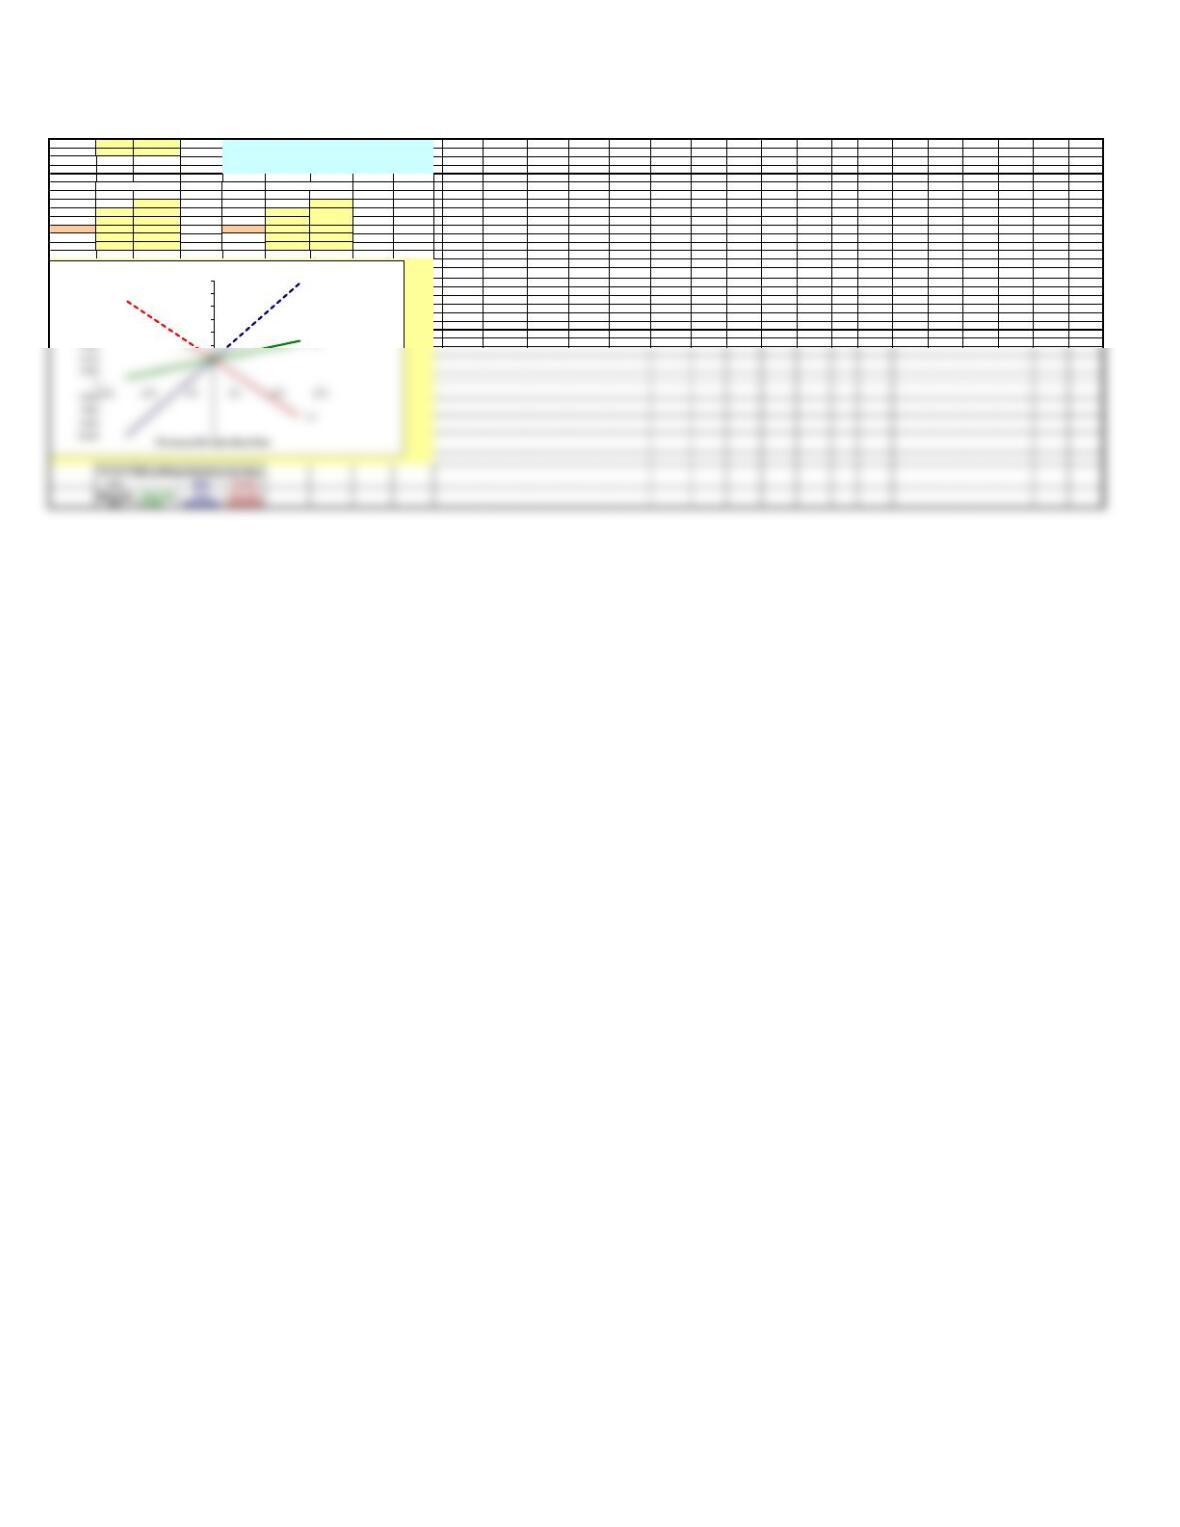
Sensitivity Analysis
Page 2
-10% $2,413 ######### $8,280
Probability NPV
CV range of firm’s average-risk project: 0.8 to 1.2
8%
10%
13%
Risk-adjusted WACC = 13%
Risk adjusted NPV = $2,721
IRR = 22.19%
Payback = 2.83
were not true, then we would need to make further risk adjustments.
However, well-diversified investors would probably prefer to see it accepted. So, to maximize the stock price, it
should be accepted.
e. On the basis of information in the problem, would you recommend that the project be accepted?
Scenario
d. If the project appears to be more or less risky than an average project, find its risk-adjusted NPV, IRR, and
Low-risk WACC =
WACC =
High-risk WACC =
At this point, the project looks risky but acceptable. There is a good chance that it will produce a positive NPV, but
there is also a chance that the NPV could be quite low.
c. Now conduct a scenario analysis. Assume that there is a 25% probability that best-case conditions, with each of
the variables discussed in Part b being 20% better than its base-case value, will occur. There is a 25% probability
of worst-case conditions, with the variables 20% worse than base, and a 50% probability of base-case conditions.
(Hint: Use Scenario Manager. Go to the Data menu, choose What-If-Analyis, the choose Scenario Manager. After
you create the Scenario’s, you can pick a scenario and type in the resulting NPV (but be sure to return the Scenario
to the base-case afterward). Or you can create a Scenario Summary and use a cell reference to the Scenario
Summary worksheet to show the NPV for each scenario.)
Sales Price
Variable
Costs per
Page 3
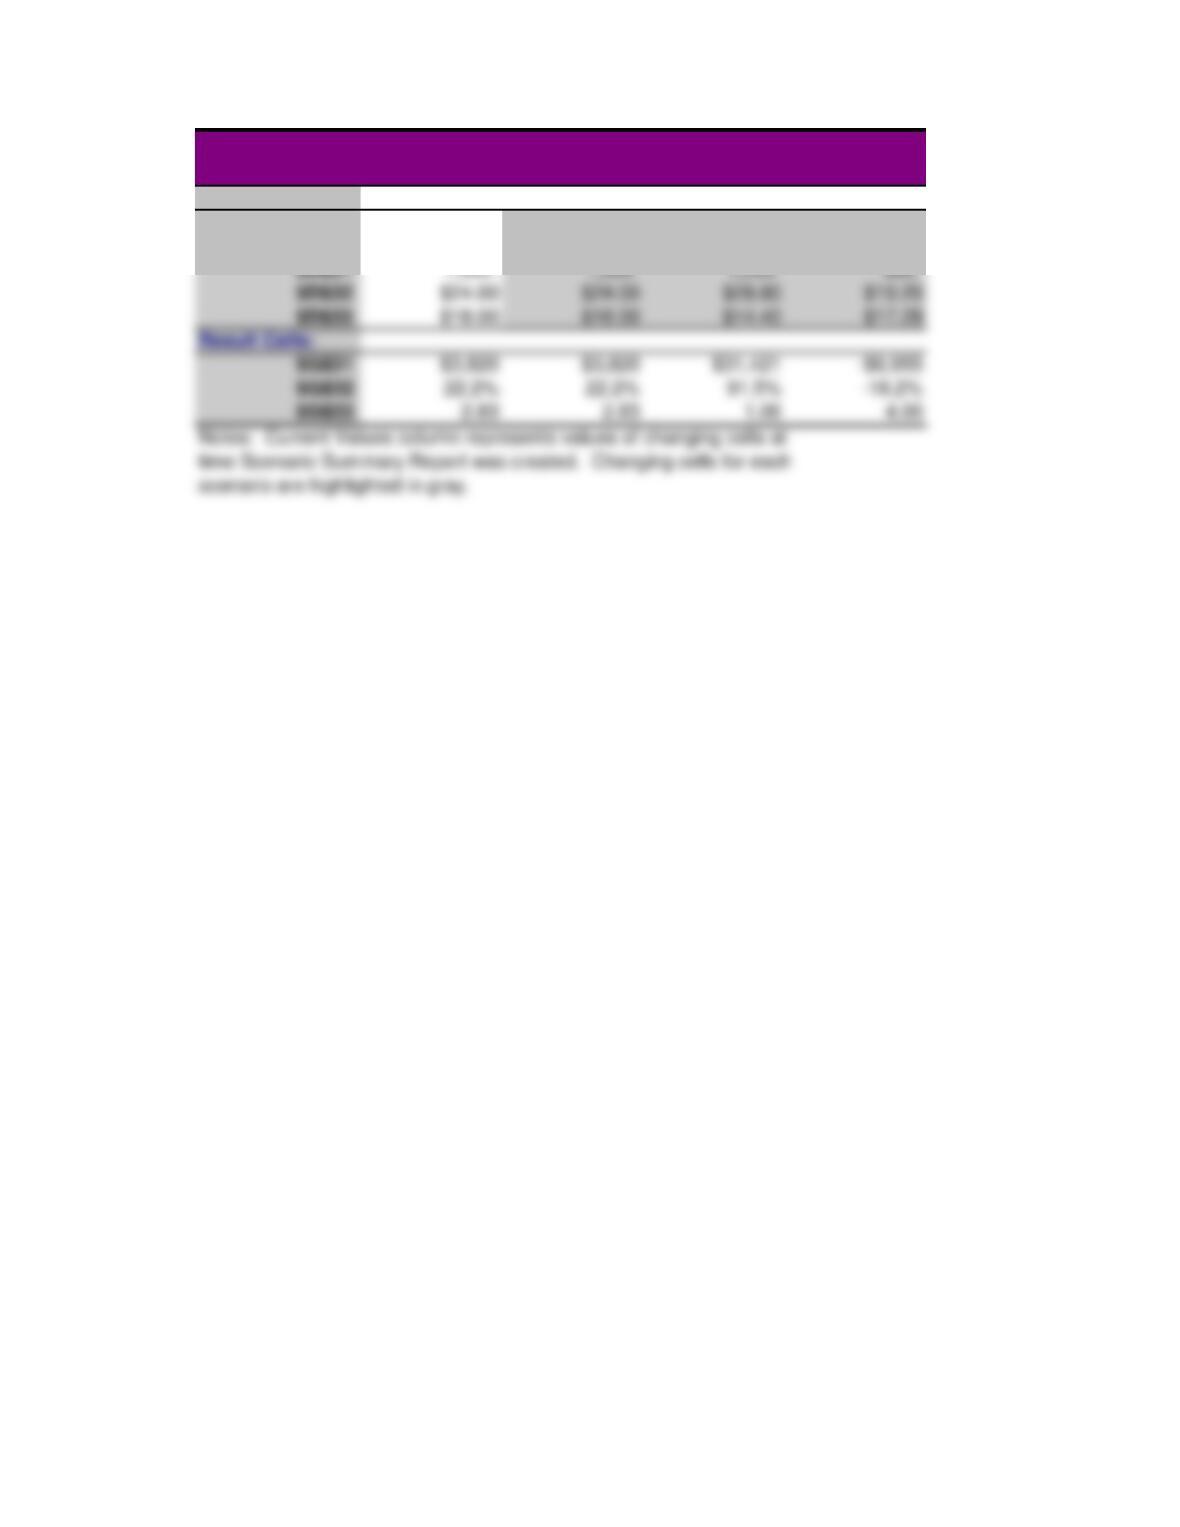
Scenario Summary
Current Values: Base Case Best Case Worst Case
Changing Cells:
$D$27 Base Case Base Case Best Case Worst Case
$D$28 50% 50% 25% 25%
Result Cells: