Chapter 11
Determining the Cost of Capital
ANSWERS TO BEGINNING-OF–CHAPTER QUESTIONS
The answers to a number of the question are illustrated in the Excel model.
11-1 (1) Debt, (2) preferred stock, and common equity from (3) sale of common stock and
(4) retained earnings. Keep the fact that common equity can be divided into retained
earnings and new common stock in mind, and also note that there are many different
types of debt, with differing costs, as we discuss in later chapters.
From an investor’s standpoint, debt is the least risky holding and thus provides the
11-2 The WACC is simply a weighted average of the firm’s component costs of capital. This
11-3 The weights used should be bases on the firm’s target capital structure. To illustrate,
suppose a company has 50-50 debt and equity at book value, but its stock sells for 1.5
times book and it uses the market value ratio as the target. Here is the situation:
Book Value Data Market Value Data
Debt $50 50% Debt $50 40%
Equity 50 50 Equity $75 60
$100 100% $125 100%
Using book value weights (50-50) would put too much weight on debt, and since debt has
the lower cost, this would bias the WACC downward. The market value weights would
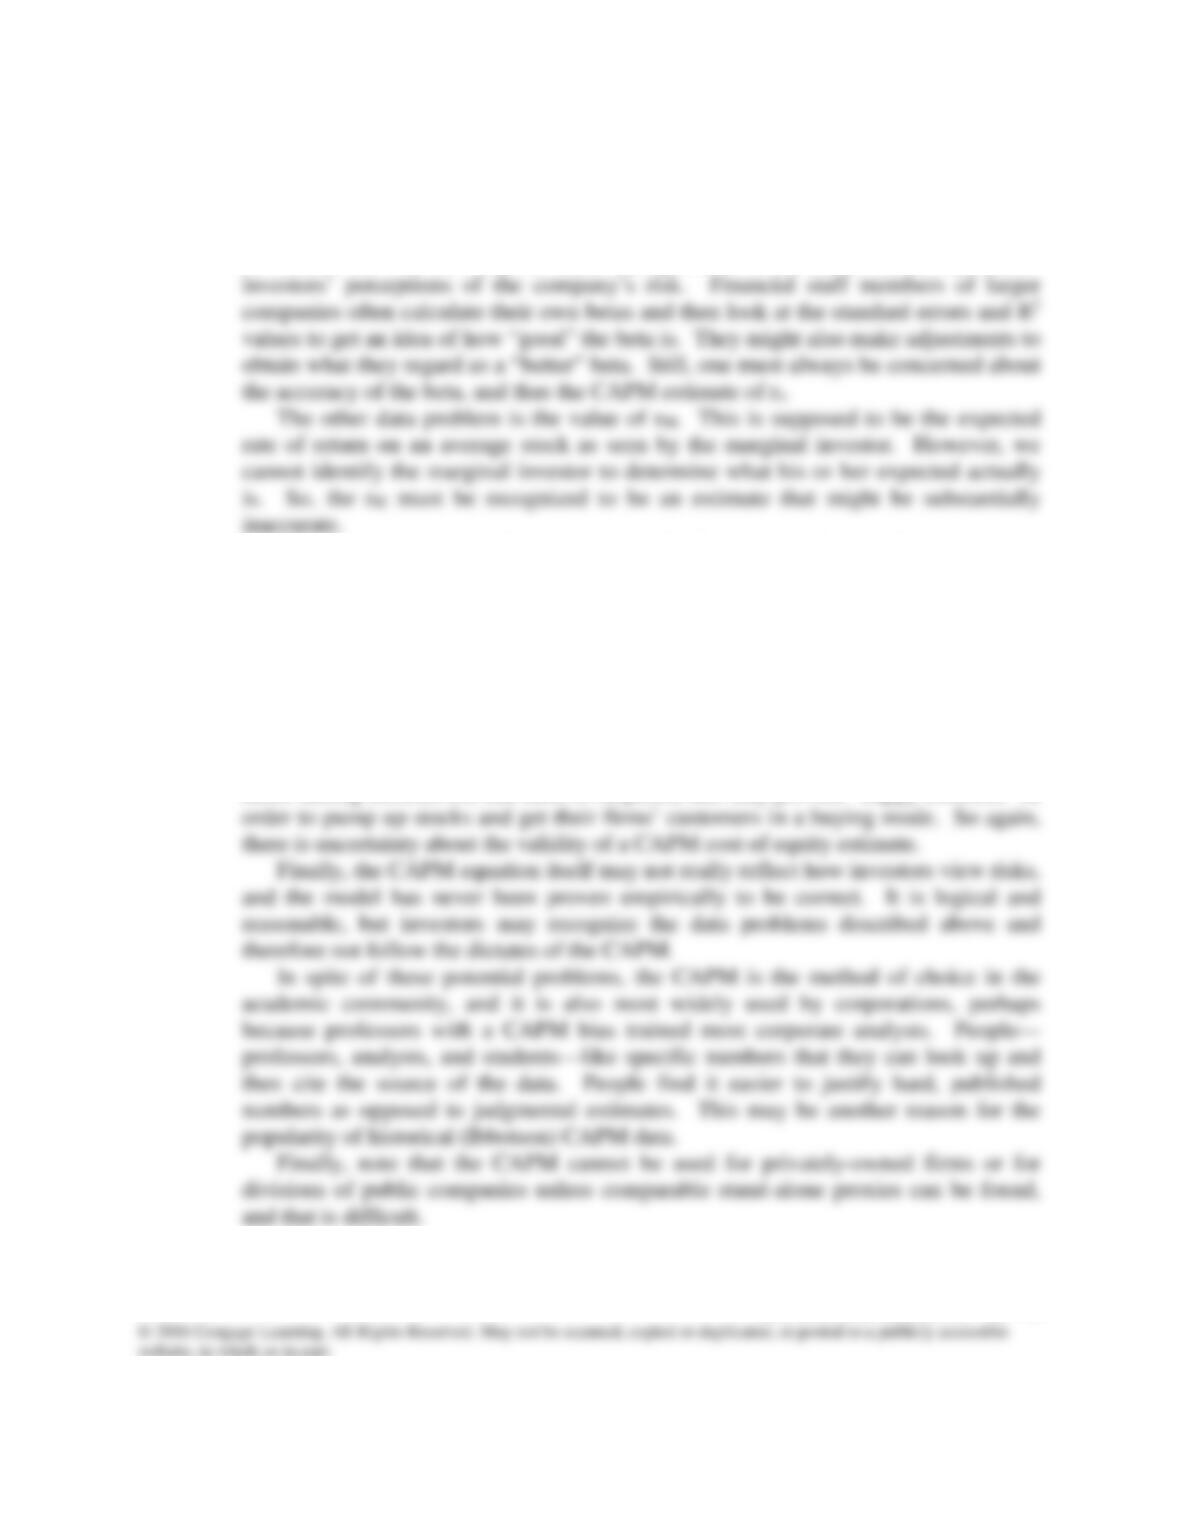
11-4 a. Using data as given in the model, here is the basic CAPM equation for rs, the cost of
common equity:
Answers and Solutions: 11 – 2
The beta is more problematic. As we saw in Chapter 2, historical betas may or
may not be good measures of future risk, which is what investors are interested in.
Note too that betas from published sources such as Value Line, Merrill Lynch, and
Yahoo.com often differ substantially from one provider to another. So, it is necessary
to consider the beta carefully and make a judgment as to whether it accurately reflects
The rM can be estimated in two ways. (1) We can use historical data on stock
returns as provided by Ibbotson Associates or some other source. Ibbotson
recommends this procedure and sells the data. However, this requires the assumption
that investors expect to earn the same returns in the future that they earned in the past,
which may or may not be a good assumption. (2) Alternatively, we can obtain
expected returns on the market as provided by analysts at firms such as Value Line
and Merrill Lynch. However, this requires the assumption that these analysts’
expectations are unbiased and accurately reflect the expectations of the marginal
investor. Analysts have not been particularly good predictors of the future, they
differ among themselves, and there is suspicion that they provide “happy forecasts” in
Answers and Solutions: 11 – 3
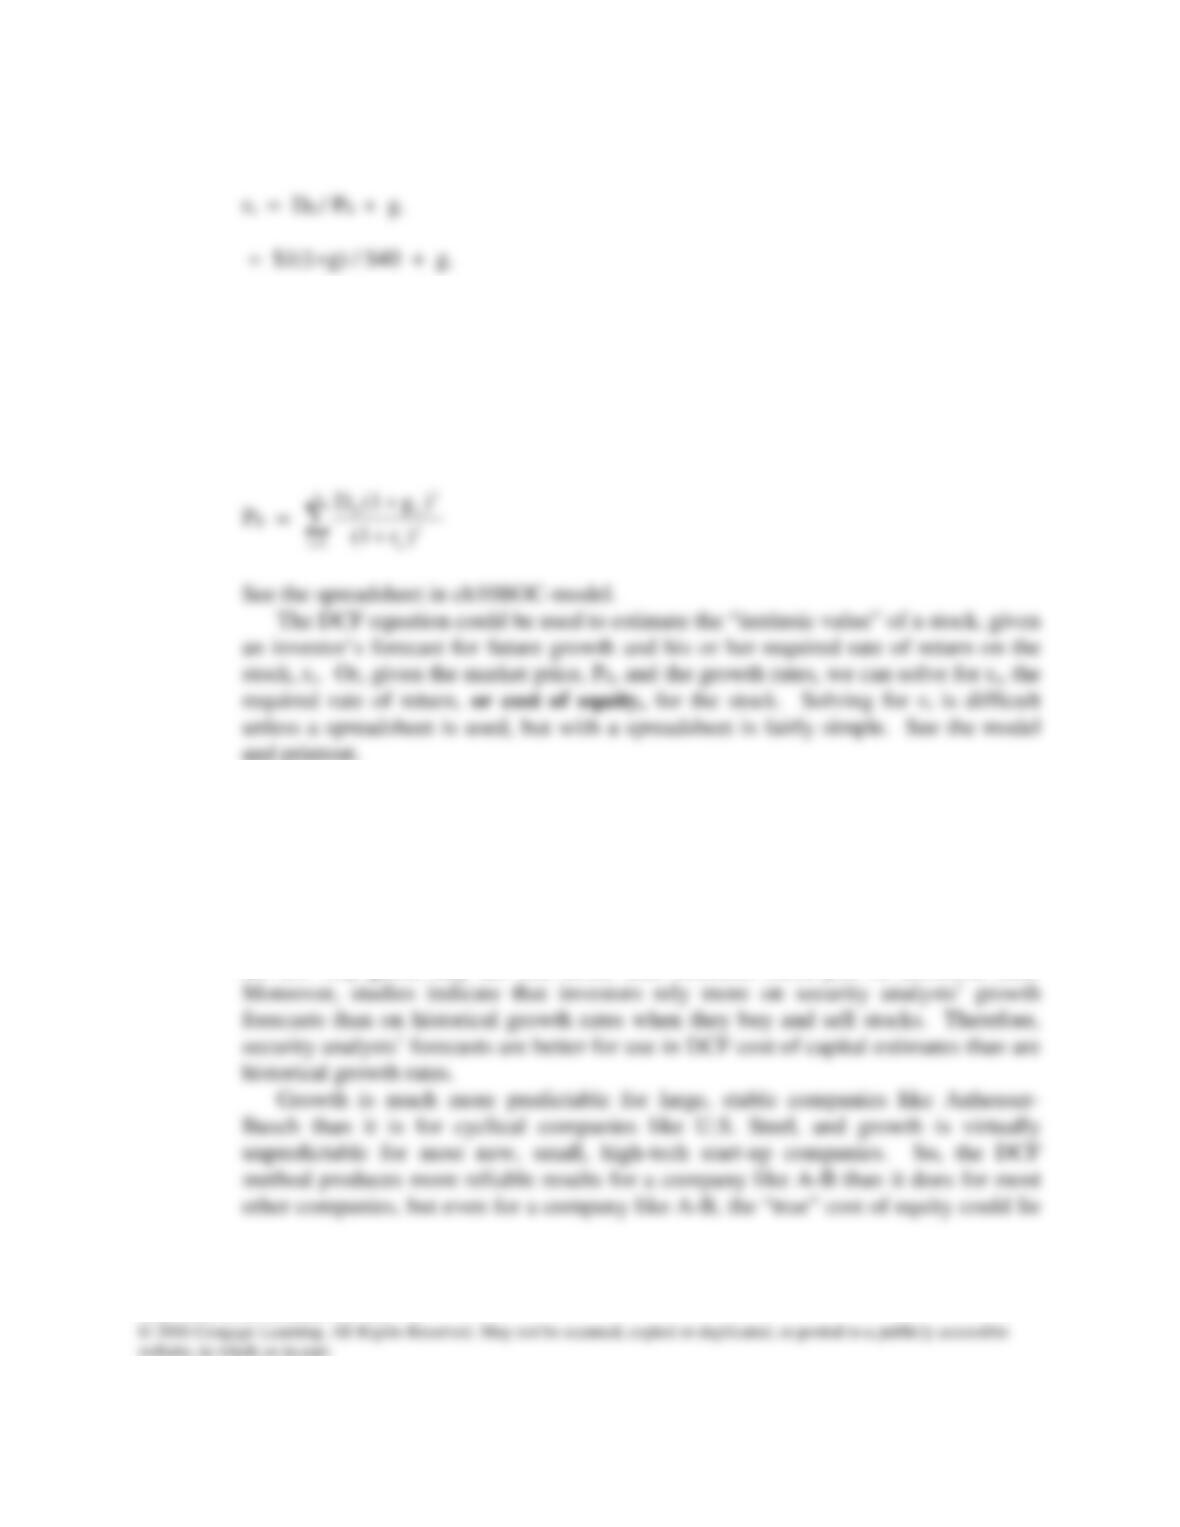
b. Here is the basic DCF equation for a constant growth stock:
If growth were expected to remain constant, and we had a good estimate of the rate
the marginal investor was using, then we could easily complete the formula and
obtain an estimate of rs. For example, if the constant growth rate was 10%, then in
our example rs would be $1.10/$40 + 10% = 12.75%.
For a non-constant growth stock, solve for rs in the following equation, where gt is
the growth rate in each year t and the g’s vary over time:
and printout.
The stock price, P0, is obviously known, as is the last dividend, D0. However, the
estimate of future growth, gt, is not known. As the model printout shows, historical
growth rates vary substantially from year to year, and they also vary depending on
how they are calculated. Moreover, historical growth rates are generally not good
predictors of future growth, so there is no good reason to think that investors should
or do rely heavily on historical rates when they estimate their intrinsic stock values.
Empirical research indicates that while security analysts’ forecast of future growth
are not very good, they are still better than forecasts based just on historical data.
Answers and Solutions: 11 – 4
within a range of perhaps 3 percentage points because growth rate estimates vary that
widely.
c. The own-bond-yield–plus-risk premium method is often criticized as being
“unscientific,” but it is still used, and with good reason. The criticism is that the risk
premium is “judgmental,” but in truth so are many elements of the CAPM and DCF
11-5 Flotation costs per dollar raised increase as we go from debt to preferred and to common
stock (because it is more difficult for investment bankers to market riskier securities).
Also, flotation costs per dollar of capital raised decline as the firm raises larger and larger
11-6 The WACC changes over time if the firm makes internal changes, especially (1) changes
its capital structure or (2) invests in assets that are riskier (or less risky) than its past
11-7 The WACC used to evaluate each project should depend on the riskiness of the project—
higher WACC’s should be used for riskier projects. The risk adjustment is largely
subjective, although some companies do apply CAPM techniques to find different costs
ANSWERS TO END-OF-CHAPTER QUESTIONS
11-1 a. The weighted average cost of capital, WACC, is the weighted average of the after–tax
component costs of capital—-debt, preferred stock, and common equity. Each
weighting factor is the proportion of that type of capital in the optimal, or target,
b. The cost of preferred stock, rps, is the cost to the firm of issuing new preferred stock.
For perpetual preferred, it is the preferred dividend, Dps, divided by the net issuing
price, Pn. Note that no tax adjustments are made when calculating the component
cost of preferred stock because, unlike interest payments on debt, dividend payments
c. The target capital structure is the relative amount of debt, preferred stock, and
common equity that the firm desires. The WACC should be based on these target
weights.
d. There are considerable costs when a company issues a new security, including fees to
11-2 The WACC is an average cost because it is a weighted average of the firm‘s component
costs of capital. However, each component cost is a marginal cost; that is, the cost of
new capital. Thus, the WACC is the weighted average marginal cost of capital.
Answers and Solutions: 11 – 6
11-3 Probable Effect on
rd(1 – T) rs WACC
a. The corporate tax rate is lowered. + 0 +
b. The Federal Reserve tightens credit. + + +
11-4 Stand–alone risk views a project’s risk in isolation, hence without regard to portfolio
effects; within–firm risk, also called corporate risk, views project risk within the context
11-5 If a company’s composite WACC estimate were 10%, its managers might use 10% to
evaluate average–risk projects, 12% for high–risk projects, and 8% for low-risk projects.
SOLUTIONS TO END-OF-CHAPTER PROBLEMS
11-1 a. rd(1 – T) = 13%(1 – 0) = 13.00%.
11-2 rd(1 – T) = 0.08(0.65) = 5.2%.
11-3 Vps = $50; Dps = $4.50; F = 0%; rps = ?
11-5 P0 = $36; D1 = $3.00; g = 5%; rs = ?
11-6 rs = rRF + bi(RPM) = 0.06 + 0.8(0.055) = 10.4%.
11-7 30% Debt; 5% Preferred Stock; 65% Equity; rd = 6%; T = 40%; rps = 5.8%; rs = 12%.
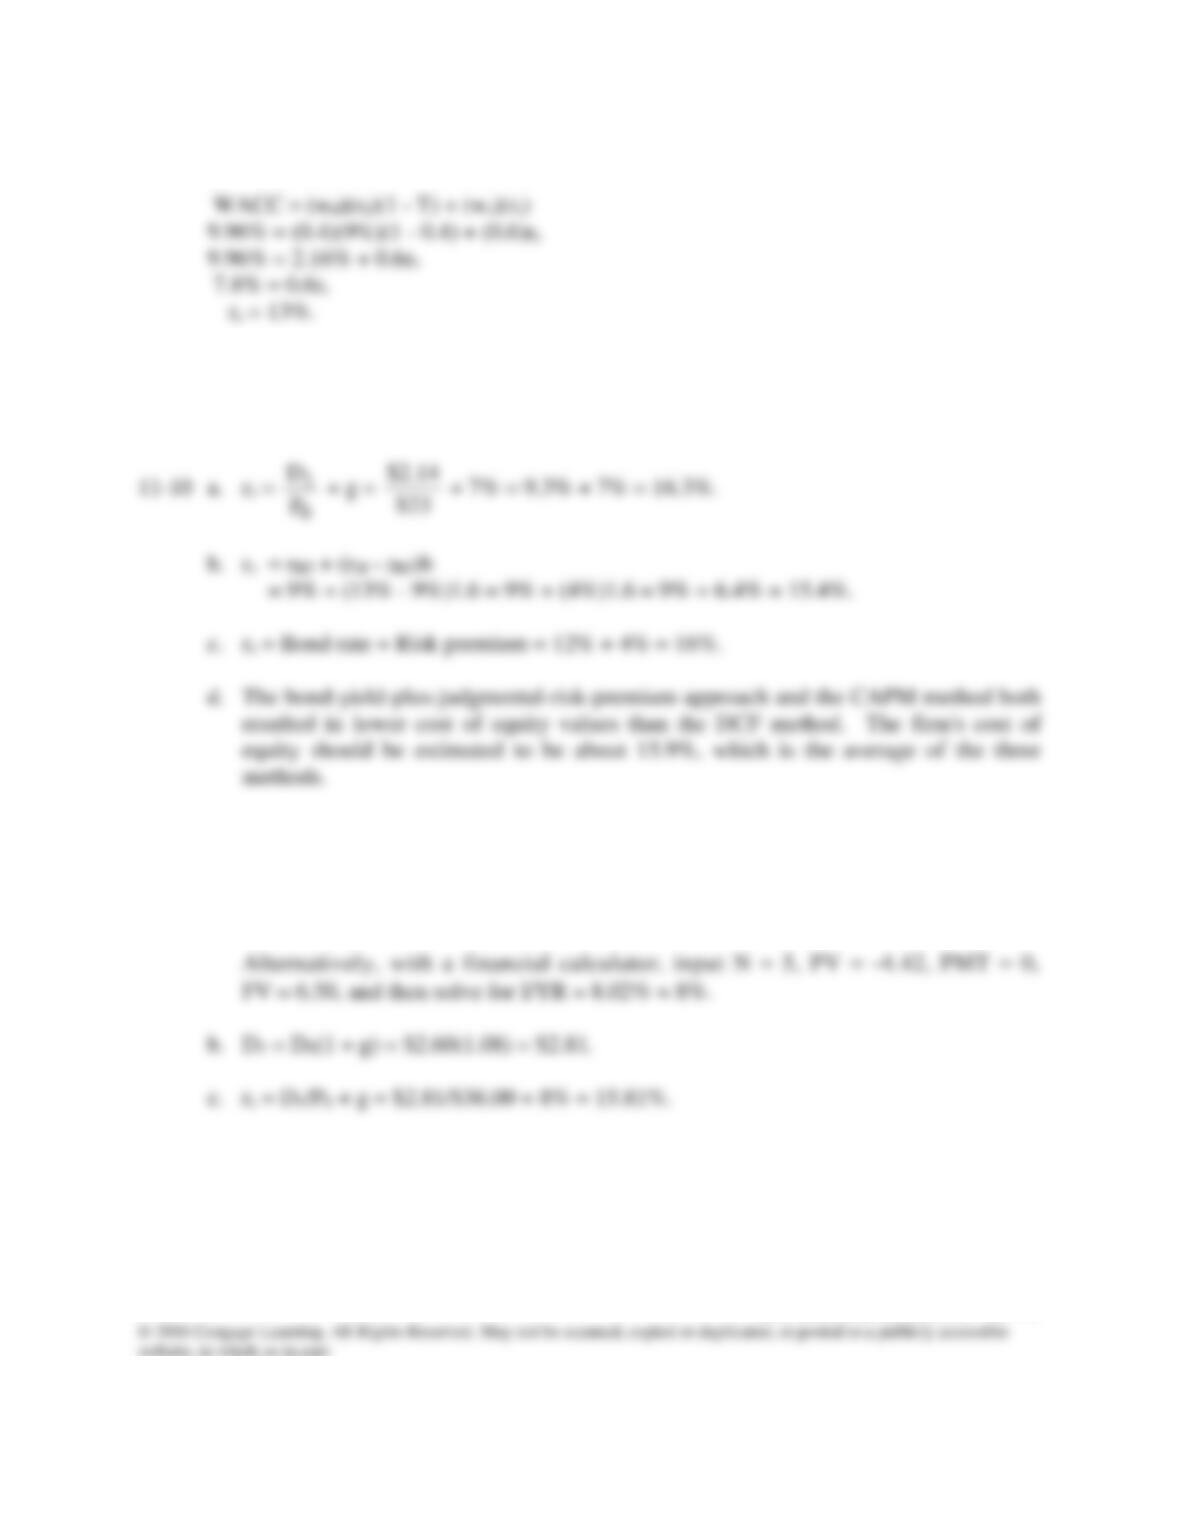
11-8 40% Debt; 60% Equity; rd = 9%; T = 40%; WACC = 9.96%; rs = ?
11-9 Enter these values: N = 60, PV = –515.16, PMT = 30, and FV = 1000, to get I = 6% =
periodic rate. The nominal rate is 6%(2) = 12%, and the after-tax component cost of debt
is 12%(0.6) = 7.2%.
11-11 a. $6.50 = $4.42(1+g)5
(1+g)5 = $6.50/$4.42 = 1.471
(1+g) = 1.471(1/5) = 1.080
g = 8%.
Answers and Solutions: 11 – 9
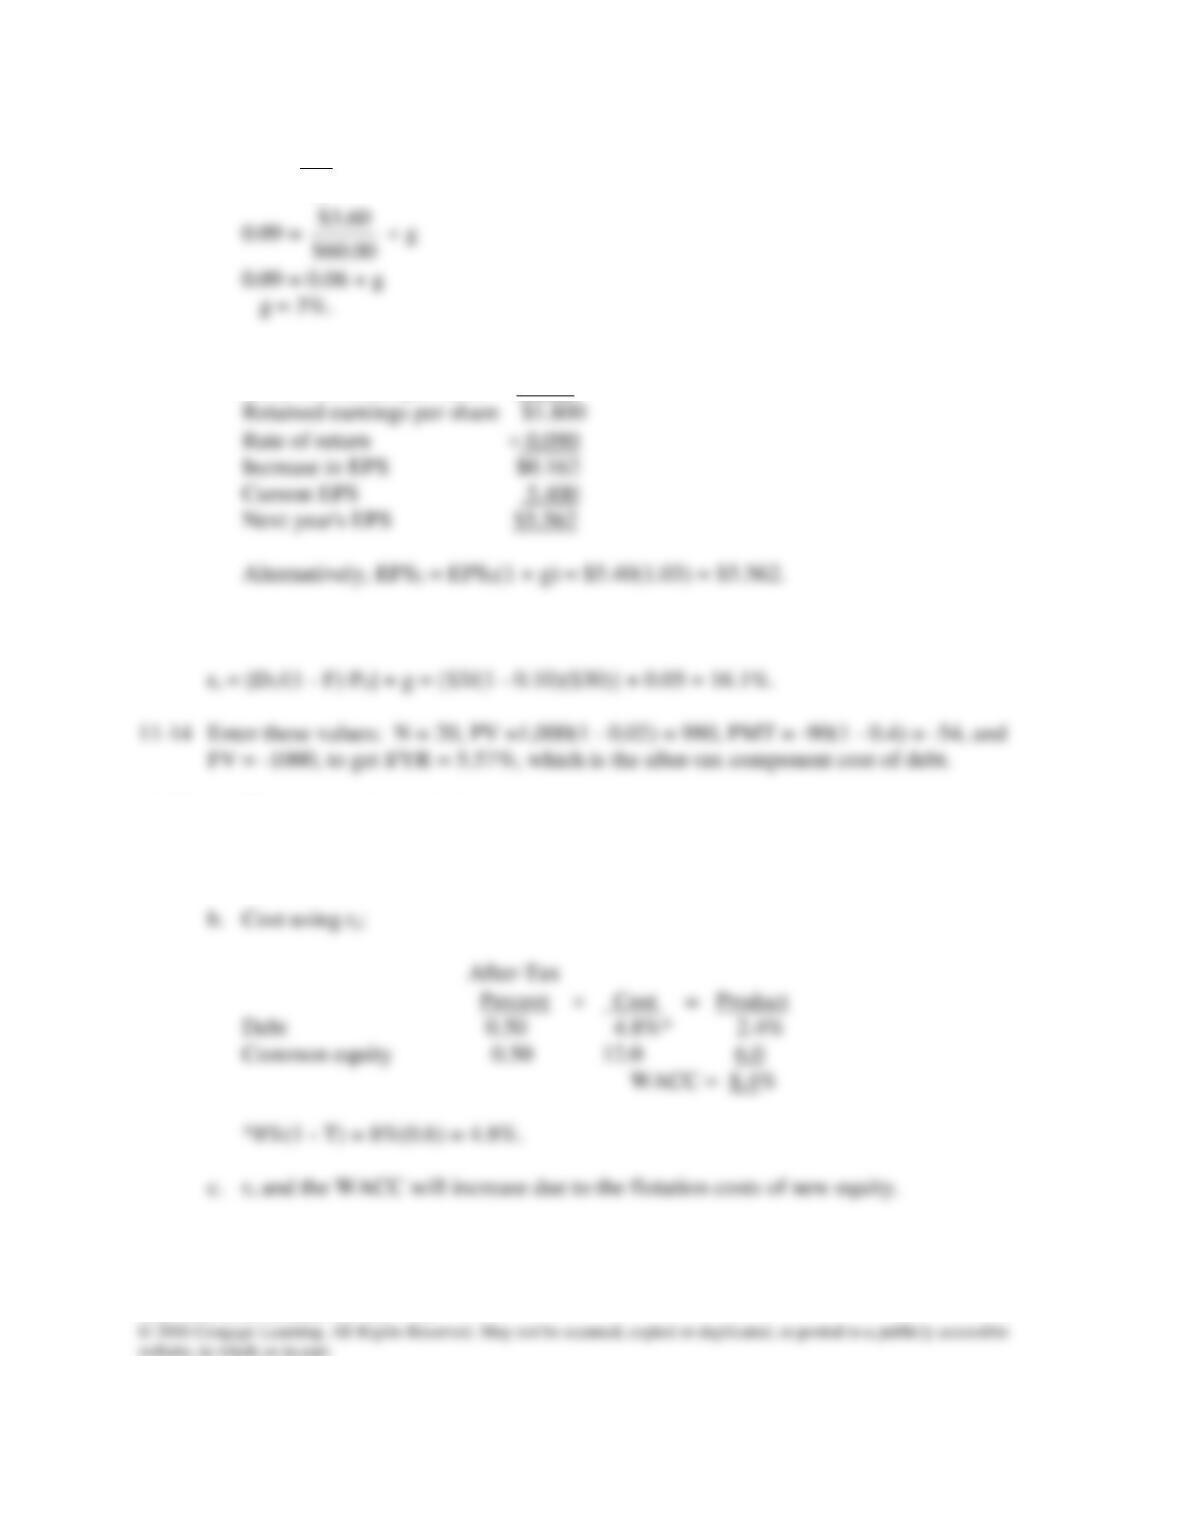
11-12 a. rs =
0
1
P
D
+ g
b. Current EPS $5.400
Less: Dividends per share 3.600
11-13 P0 = $30; D1 = $3.00; g = 5%; F = 10%; rs = ?
11-15 a. Common equity needed:
0.5($30,000,000) = $15,000,000.
Answers and Solutions: 11 – 10
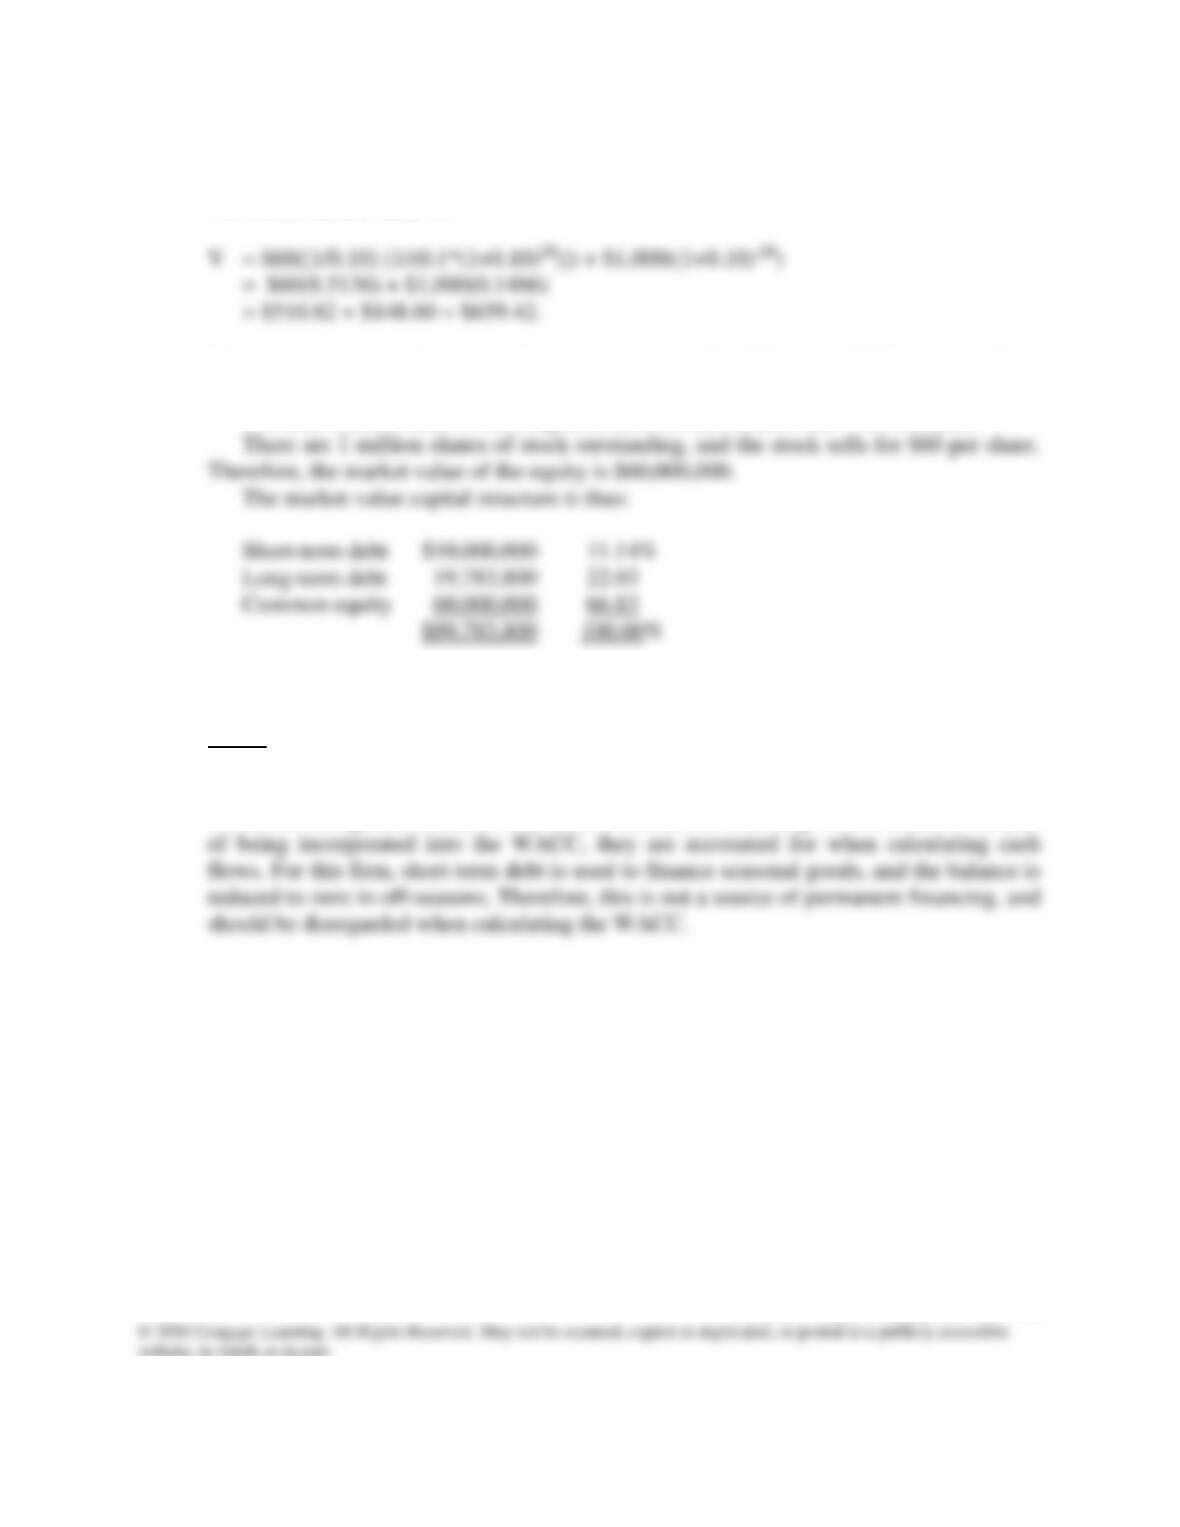
11-16 The book and market value of the notes payable are $10,000,000.
The bonds have a value of
Alternatively, using a financial calculator, input N = 20, I/YR = 10, PMT = 60, and FV =
1000 to arrive at a PV = $659.46.
The total market value of the long-term debt is 30,000($659.46) = $19,783,800.
11-17 Several steps are involved in the solution of this problem. Our solution follows:
Step 1.
Establish a set of market value capital structure weights. In this case, A/P and accruals
should be disregarded because they are not sources of financing from investors. Instead
Answers and Solutions: 11 – 11
Debt:
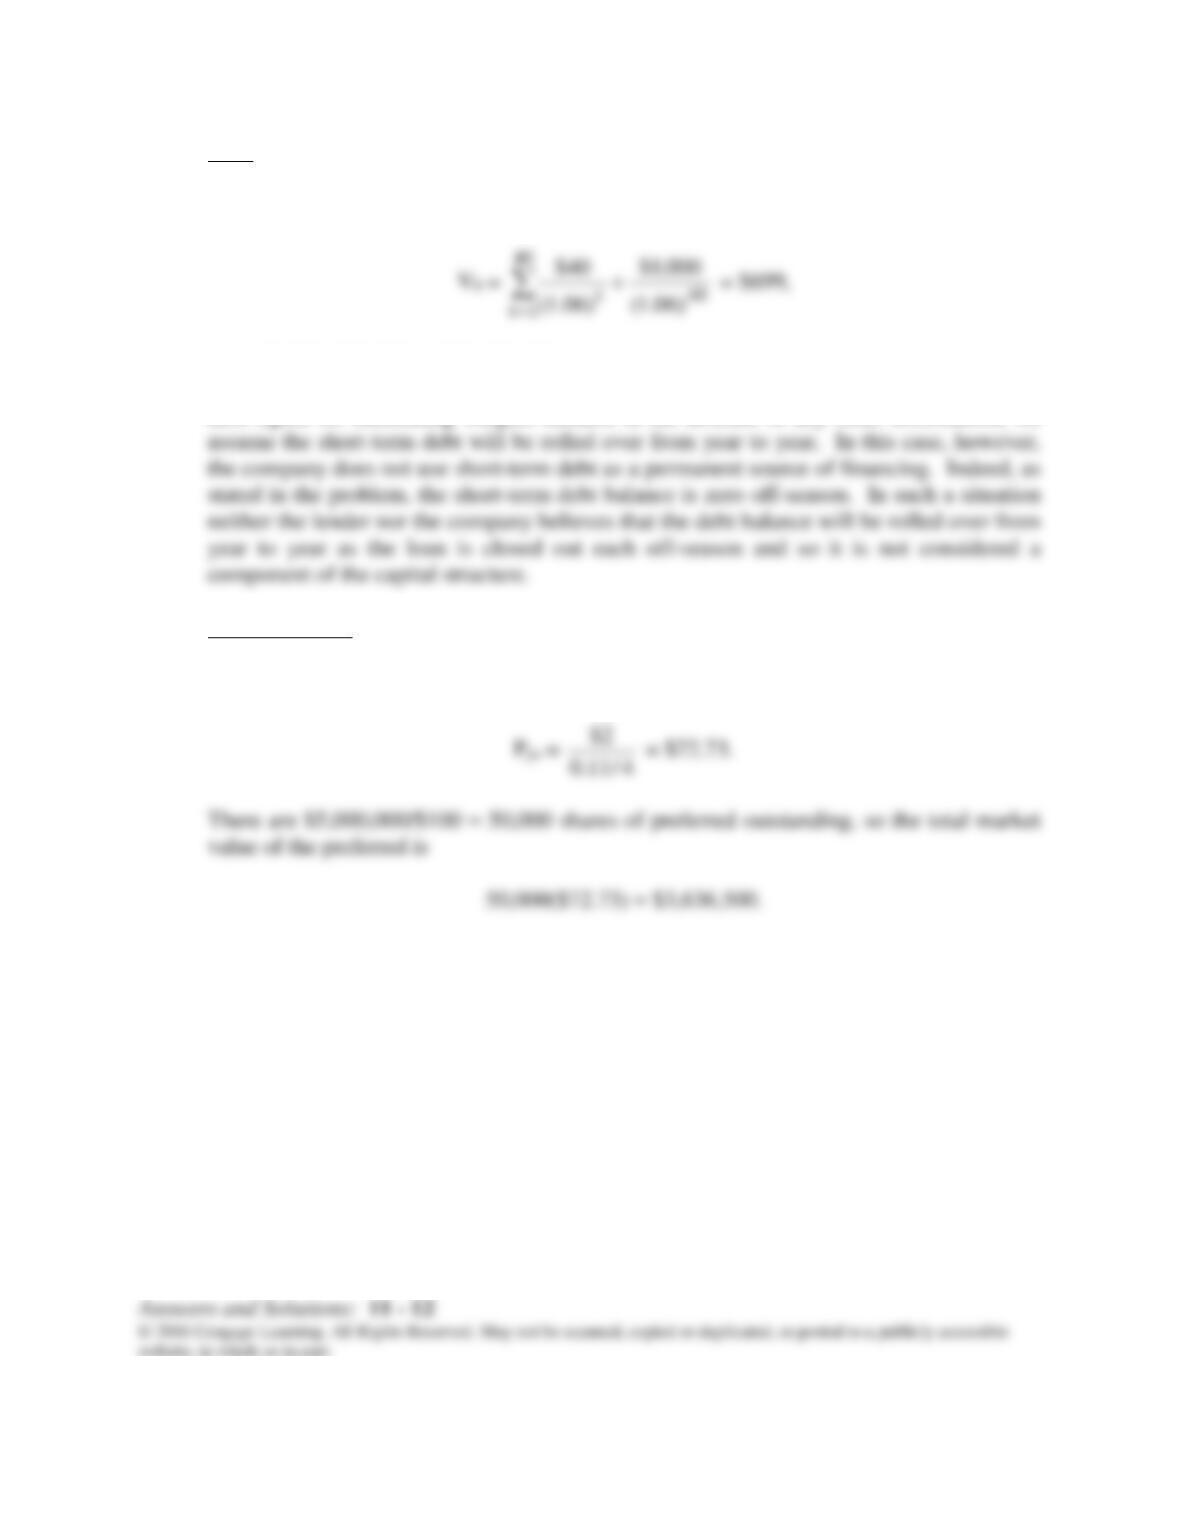
The long-term debt has a market value found as follows:
or 0.699($30,000,000) = $20,970,000 in total. Notice that short–term debt is not included
in the capital structure for this company. We usually include short-term debt in the total
debt figure for calculating weights because in the absence of any other information, we
Preferred Stock:
The preferred has a value of
Common Stock:
The market value of the common stock is
4,000,000($20) = $80,000,000.
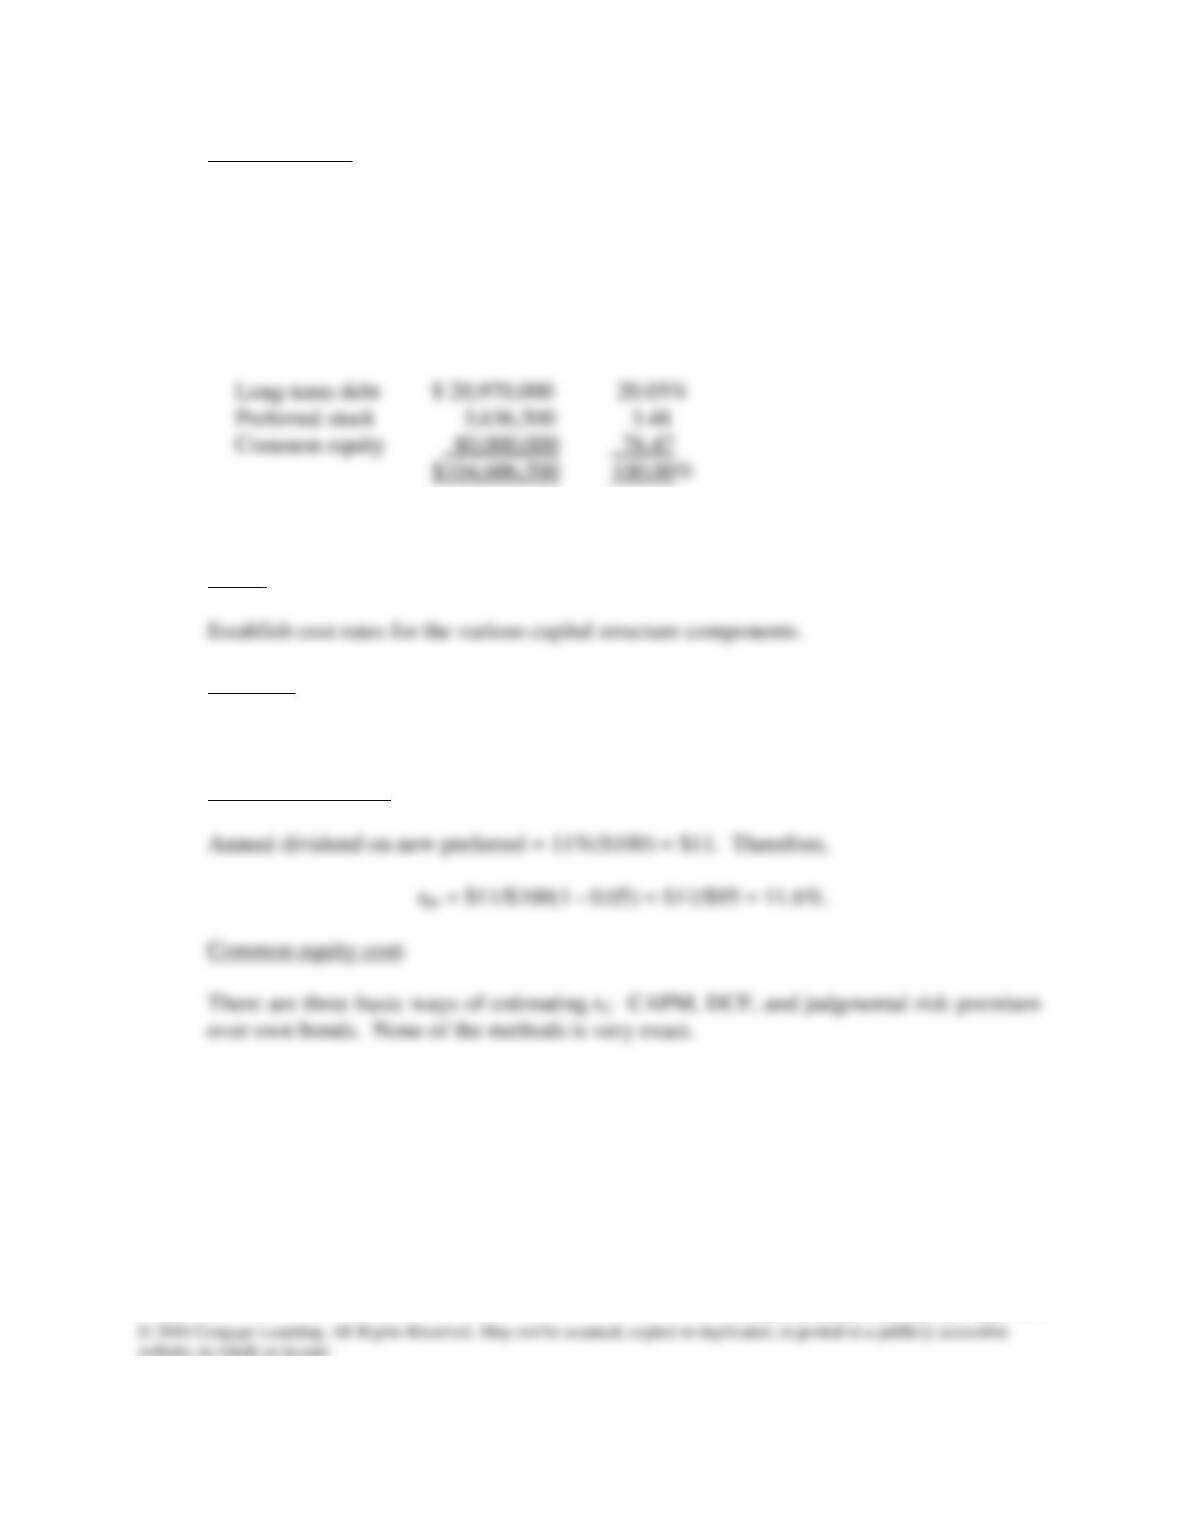
Therefore, here is the firm‘s market value capital structure, which we assume to be
optimal:
We would round these weights to 20% debt, 4% preferred, and 76% common equity.
Step 2.
Debt cost:
rd(1 – T) = 12%(0.6) = 7.2%.
Preferred stock cost:
Answers and Solutions: 11 – 13