290 Instructor’s Manual
A10-1. a. Puritan Motors’ cost of equity is: 6% + 1.6(11% – 6%) = 14%
cost of equity will also increase by 1%.
P10-2. Fournier Industries, a publicly traded waste disposal company, is a highly leveraged firm
with 70% debt, 0% preferred stock, and 30% common equity financing. Currently the risk-
free rate is about 4.5% and the return on the S&P 500 (the market proxy) is 12.7%. The
firm’s beta is currently estimated to be 1.65.
a. What is Fournier’s current cost of equity?
b. If the firm shifts its capital structure to a highly levered position by selling preferred
stock and using the proceeds to retire debt, it expects its beta to drop to 1.20. What is
its cost of equity in this case?
c. If the firm shifts its capital structure to a less highly leveraged position by selling addi-
tional shares of common stock and using the proceeds to retire debt, it expects its beta
to drop to 0.95. What is its cost of equity in this case?
d. Discuss the potential impact of the two strategies discussed in parts (b) and (c) above
on Fournier’s weighted-average cost of capital (WACC).
A10-2. a. Cost of equity can be found using CAPM: 4.5% + 1.65(12.7% – 4.5%) = 18.03%
P10-3. In its 2009 annual report, The Coca Cola Company reported sales of $30.99 billion for fis-
cal year 2009 and $31.94 billion for fiscal year 2008. The company also reported operating
income (roughly equivalent to EBIT) of $8.23 billion in 2009 and $8.45 billion in 2008.
Meanwhile, arch-rival PepsiCo, Inc. reported sales of $43.23 billion in 2009 and $43.25
billion in 2008. PepsiCo’s operating income was $8.04 billion in 2009 and $6.96 billion in
2008. Based on these figures, which company had higher operating leverage?
A10-3. Using equation 10.2, simply divide the percentage change in EBIT by the percentage
change in sales for each firm. The firm with the higher ratio has more operating leverage.
Chapter 10 Risk and Capital Budgeting 291
P10-4. Gail and Company had the following sales and EBIT during the years 2010 through 2014.
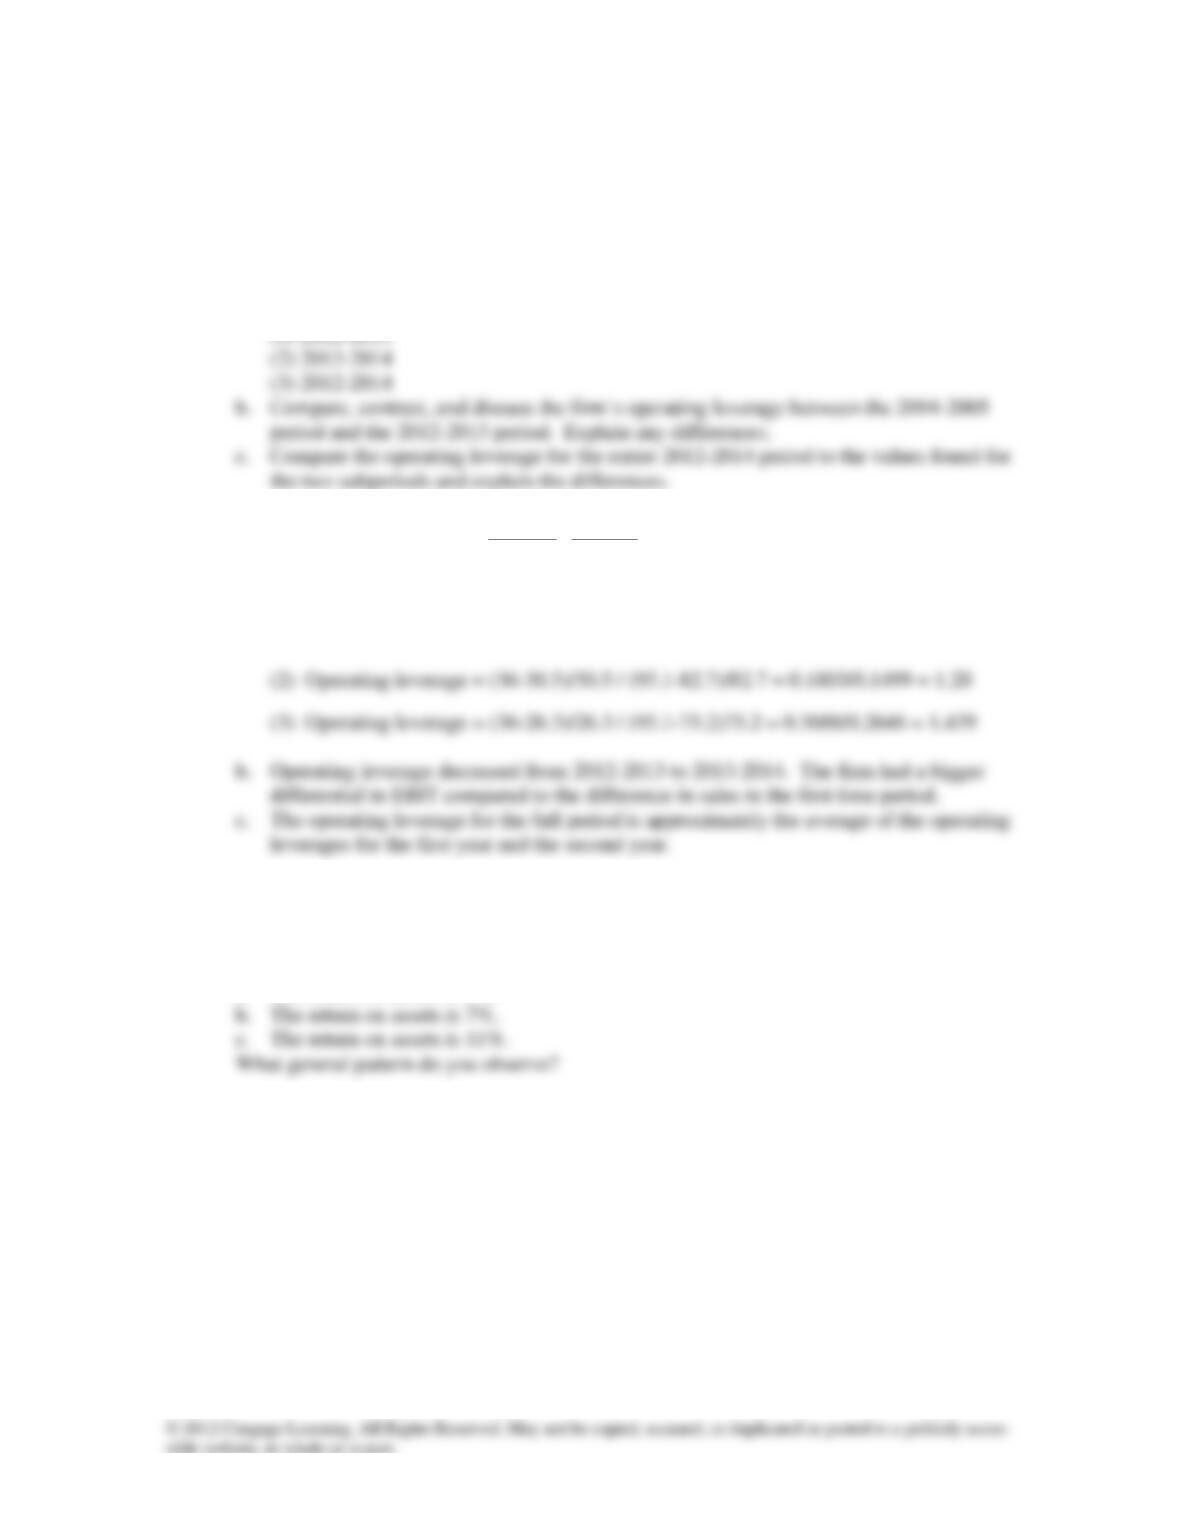
2012 2013 2014
Sales ($ millions) 75.2 82.7 95.1
EBIT ($ millions) 26.3 30.5 36.0
a. Use the data provided to assess Gail and Company’s operating leverage over the fol-
lowing periods
A10-4. a. (1) Operating leverage =
ΔΔ
/
EBIT Sales
EBIT Sales =
= (30.5-26.3)/26.3 / (82.7-75.2/75.2)
= 0.1597/0.0997
= 1.60
P10-5. Firm 1 has a capital structure with 20% debt and 80% equity. Firm 2’s capital structure
consists of 50% debt and 50% equity. Both firms pay 7% annual interest on their debt. Fi-
nally, suppose that both firms have invested in assets worth $100 million. Calculate the re-
turn on equity (ROE) for each firm, assuming the following:
a. The return on assets is 3%.
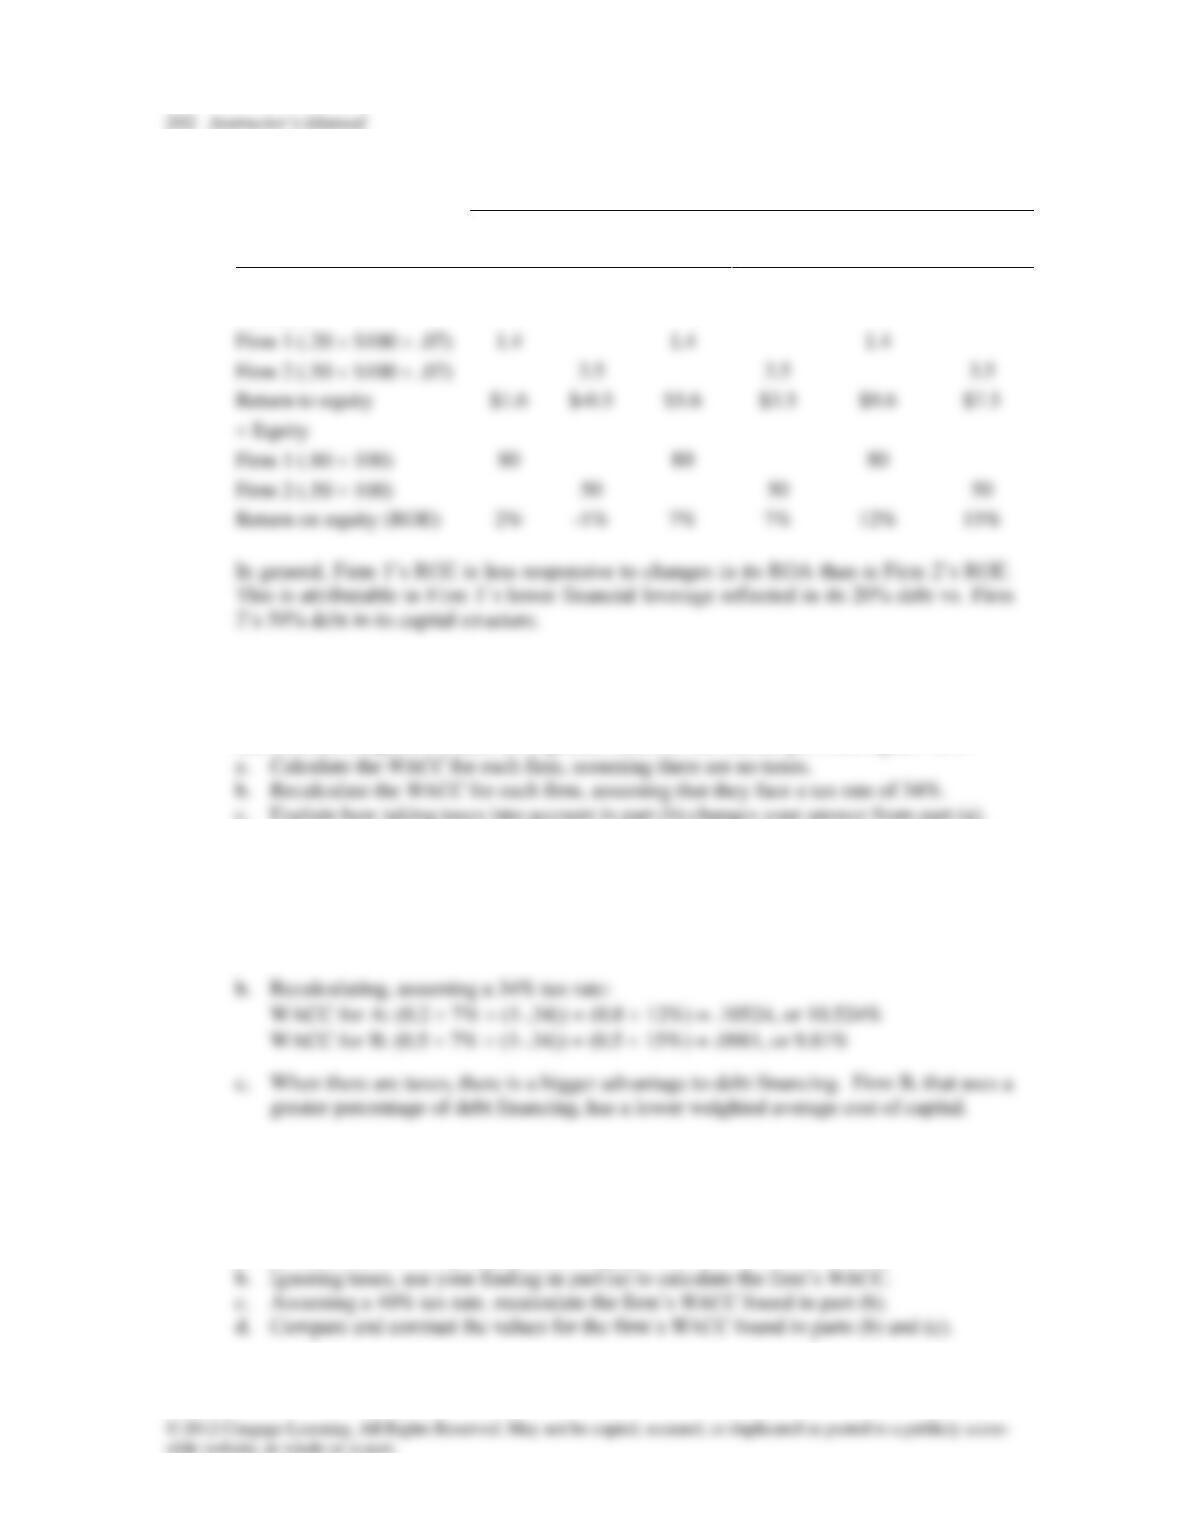
A10-5.
Return on Assets (ROA)
3%
7%
11%
Firm 1
Firm 2
Firm 1
Firm 2
Firm 1
Firm 2
Dollar revenue (millions)
$3
$3
$7
$7
$11
$11
– Interest
Firm 1 (.20 $100 .07)
Firm 2 (.50 $100 .07)
Return to equity
$5.6
$3.5
$9.6
$7.5
Firm 1 (.80 100)
Firm 2 (.50 100)
Return on equity (ROE)
7%
7%
12%
15%
P10-6. Firm A‘s capital structure contains 20% debt and 80% equity. Firm B’s capital structure
contains 50% debt and 50% equity. Both firms pay 7% annual interest on their debt. The
stock of Firm A has a beta of 1.0, and the stock of Firm B has a beta of 1.375. The risk-free
rate of interest equals 4%, and the expected return on the market portfolio equals 12%.
c. Explain how taking taxes into account in part (b) changes your answer from part (a).
A10-6. a. Firm A has a cost of equity of 4% + 1.0(12% – 4%), or 12%, and Firm B has a cost of
equity of 4% + 1.375(12% – 4%), or 15%. Given these figures and the fact that both
firms have a cost of debt of 7%, the WACC for Firm A is (0.20 7%) + (0.80 12%),
or 11%, and for Firm B it is (0.50 7%) + (0.50 15%), also 11%.
P10-7. A firm has a capital structure containing 60% debt and 40% common stock equity. Its out-
standing bonds offer investors a 6.5% yield to maturity. The risk-free rate currently equals
5%, and the expected risk premium on the market portfolio equals 6%. The firm’s common
stock beta is 1.20.
a. What is the firm’s required return on equity?
Chapter 10 Risk and Capital Budgeting 293
A10-7. a. The firm’s required return on equity is (5% + 1.20 6%), or 12.2%
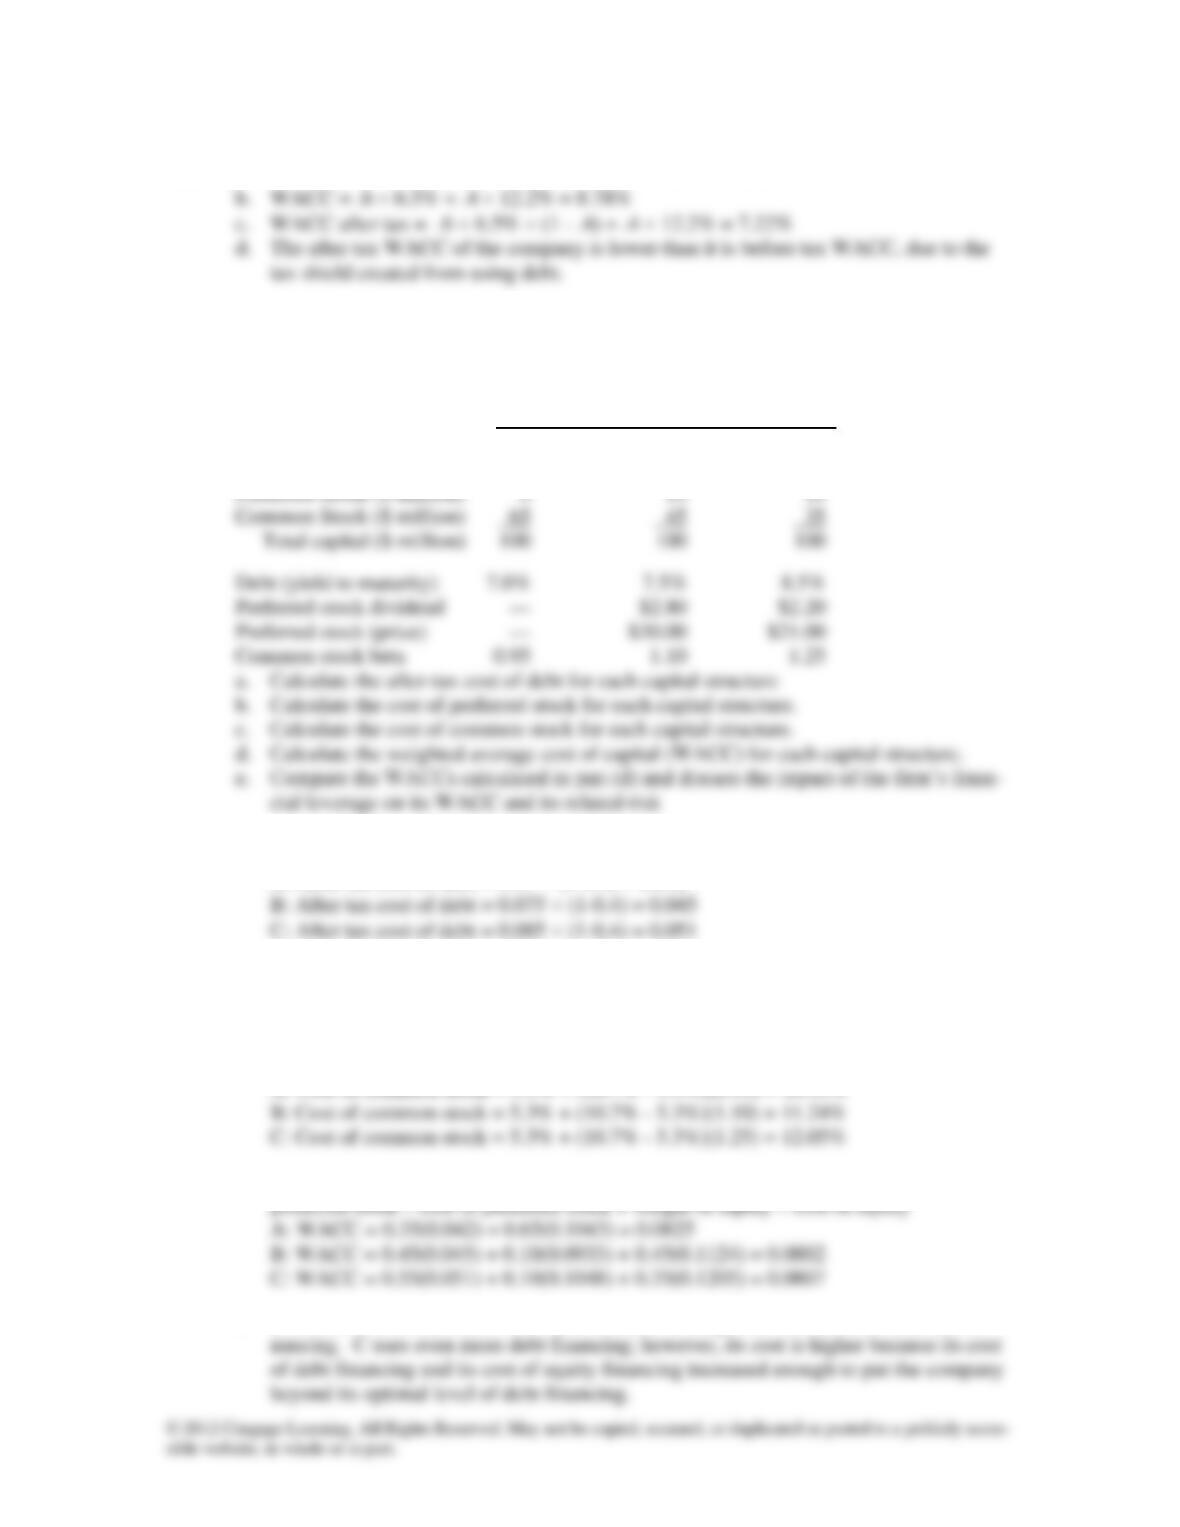
P10-8. Dingel Inc. is attempting to evaluate three alternative capital structures – A, B, and C. The
following table shows the three structures along with relevant cost data. The firm is sub-
ject to a 40% tax rate. The risk-free rate is 5.3% and the market return is currently 10.7%.
Capital Structure .
Item A B C
Debt ($ million) 35 45 55
A10-8. a. After tax cost of debt = Pre-tax cost of debt (1−T)
A: After tax cost of debt = 0.07 (1-0.4) = 0.042
b. Cost of preferred stock = Dividend/Price
B: Cost of preferred stock = 2.80/30 = 0.0933
C: Cost of preferred stock = 2.20/21 = 0.1048
c. Cost of common stock = risk free rate + beta x (Market return – risk free rate)
A: Cost of common stock = 5.3% + (10.7% – 5.3%)(0.95) = 10.43%
d. Weighted average cost of capital = weight of debt x after tax cost of debt + weight of
e. B’s WACC is lower than A’s WACC because of its greater use of lower cost debt fi-
294 Instructor’s Manual
P10-9. A firm has a capital structure containing 40% debt, 20% preferred stock, and 40% common
stock equity. The firm’s debt has a yield to maturity of 8.1%, its preferred stock’s annual
dividend is $3.10, and the preferred stock’s current market price is $50.00 per share. The
firm’s common stock has a beta of 0.90, and the risk-free rate and the market return are
currently 4.0% and 13.5%, respectively. The firm is subject to a 40% tax rate.
a. What is the firm’s cost of preferred stock?
b. What is the firm’s cost of common stock?
c. Calculate the firm’s after-tax WACC.
d. Recalculate the firm’s WACC, assuming that its capital structure is deleveraged to con-
tain 20% debt, 20% preferred stock, and 60% common stock.
e. Compare, contrast, and discuss your findings from parts (c) and (d).
A10-9. a. The firm’s cost of preferred stock is 3.10/50 = 6.2%
b. The firm’s cost of common stock is 4% + 0.9 (13.5% − 4%), or 12.55%.
A Closer Look at Risk
P10-10. Alliance Pneumatic Manufacturing, a specialty machine-tool producer, has fixed costs of
$200 million per year. Across all the firm’s products, the average contribution margin
equals $1,200. What is Alliance’s breakeven point in terms of units sold?
A10-10. Fixed costs divided by the contribution margin equal the break-even point in terms of
P10-11. See Table 10.4 on page 328. Determine which of the following has the greater effect on
the NPV of the gyroscope skateboard project—an increase in the initial selling price of
12.5% (compared to the base case) or an increase in the size of the market of 10% in year
1 (compared to the base case).
P10-12. JK Manufacturing is considering a new product and is unsure about its price as well as
the variable cost associated with it. JK’s marketing department believes that the firm can
sell the product for $500 per unit, but feel that if the initial market response is weak, the
Chapter 10 Risk and Capital Budgeting 295
price may have to be 20% lower in order to be competitive with existing products. The
firm’s best estimates of its costs are fixed costs of $3.6 million and variable cost of $325
per unit. Concern exists with regard to the variable cost per unit due to currently volatile
raw material and labor costs. Although the firm expects this cost to be about $325 per
unit, it could be as much as 8% above that value. The firm expects to sell about 50,000
units per year.
a. Calculate the firm’s breakeven point (BEP), assuming its initial estimates are accu-
rate.
b. Perform a sensitivity analysis by calculating the breakeven point for all combinations
of the sale price per unit and variable cost per unit. (Hint: There are four combina-
tions.)
c. In the best case, how many units will the firm need to sell to break even?
d. In the worst case, how many units will the firm need to sell to break even?
e. If each of the possible price/variable cost combinations is equally probable, what is
the firm’s expected breakeven point?
f. Based on your finding in part (e) should the firm go forward with the proposed new
product? Explain why.
A10-12. a. Best case breakeven = Fixed costs / (Sales – Variable costs)
= 3,600,000/(500 – 325)
= 20,571 units
P10-13. Consumer Products, Inc. (CPI) can pay one of its foreign suppliers $20 million to obtain
exclusive marketing rights to a new product. Demand for this product is uncertain, but
CPI’s preliminary estimates indicate that there is a 50% chance of strong product de-
mand, which will result in cash inflows of $5.2 million per year for 8 years; there is a
20% chance of moderate product demand, which will result in cash inflows of $4.5 mil-
lion per year for 8 years; and there is a 30% chance of weak demand, which will result in
cash inflows of $4.0 million per year for 8 years. For $2 million, CPI can conduct a fea-
sibility study that will confirm whether product demand will be strong, moderate, or
weak, and then CPI can decide whether to purchase rights to the product. CPI’s cost of
capital applicable to the proposed new product decision is 12%.
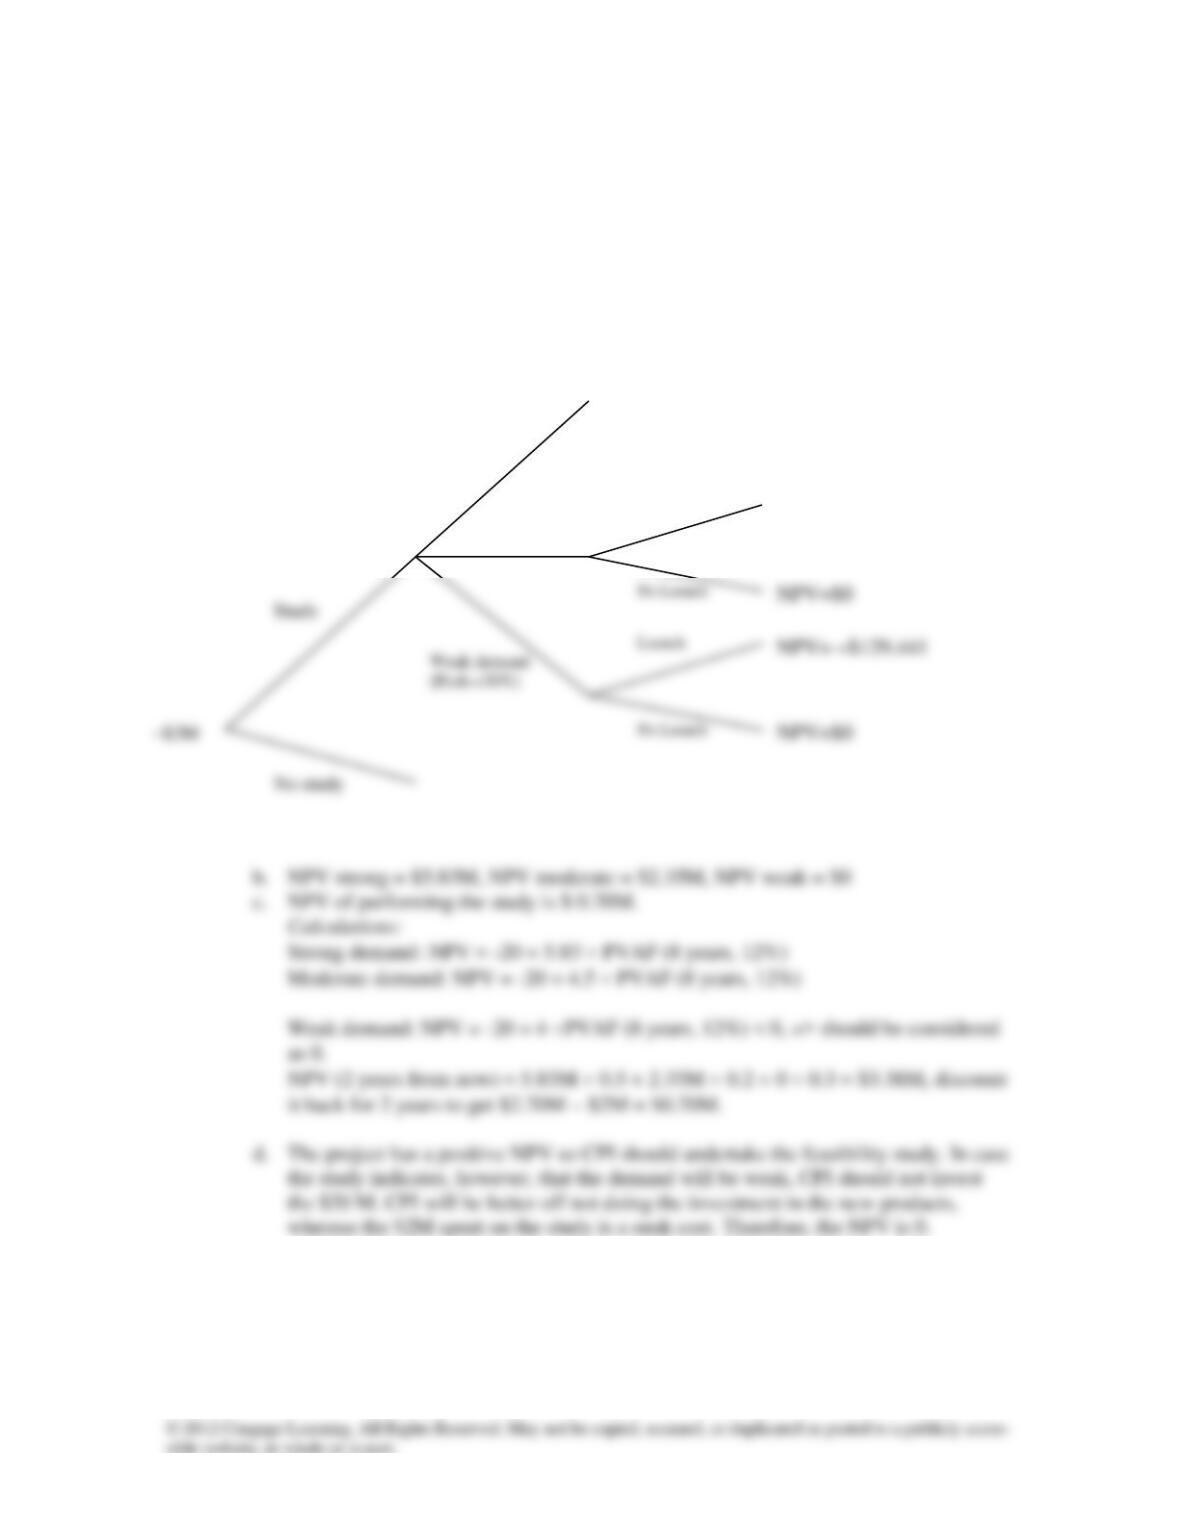
a. Draw the decision tree associated with CPI’s proposed feasibility study.
296 Instructor’s Manual
b. Calculate the NPV associated with each of the possible product demand outcomes—
strong, moderate, and weak.
c. Find the expected NPV of performing the feasibility study.
d. Based on your findings in part (c), what recommendation would you give CPI about
the proposed feasibility study? Explain.
A10-13. a.
NPV=$0
NPV=$0
No Launch
No Launch
Launch
Weak demand
(Prob.=30%)
Real Options
P10-14. Stanley Marcus, a financial intern at Mega Manufacturing Company (MMC), was asked
by the CFO to review the NPV calculations on a major new product investment. After
analyzing the cash flows and other calculations, Stanley confirmed that the NPV was
$1.5 million. In the process of investigating all aspects of the project and its cash flows,
Stanley learned that should the new product be successful, it would open the door to a
NPV=$5,831,727
NPV=$0
NPV=$2,354,379
No Launch
Launch
Launch
Strong demand
(Prob.=50%)
Moderate demand
(Prob.=20%)
Chapter 10 Risk and Capital Budgeting 297
number of opportunities to further expand the firm’s product line. Using option valuation
techniques that he learned in an advanced finance course, he estimated the value of these
expansion options to be $0.45 million.
a. Based on Stanley’s analysis, what is the value of the proposed new product invest-
ment?
b. How can Stanley explain the value found in part (a) to the CFO, who is unfamiliar
with the concept of real options?
A10-14. a. The value of the new investment is $1.95 million (1.50+0.45).
P10-15. Tech Industries, a contract manufacturer of circuit boards, is evaluating an investment in
a new production line to handle the growing demand from its customers, who produce
consumer electronic products. Based on reasonable growth assumptions, the NPV of the
new production line was found to be -$2.3 million. Management feels obligated to there-
fore reject the project. It recognizes that the production line would provide a high degree
of output flexibility because it could be repurposed easily and inexpensively to produce
circuit boards for numerous other applications. The firm’s project analyst estimated the
value of this output flexibility option to be $3.3 million.
a. Based on the information provided, what is the true value of Tech Industries’ pro-
posed new production line?
b. What recommendation would you give Tech Industries regarding the proposed new
production line? Explain.
A10-15. a. The true value of the new production line is $1 million (-2.3 million + 3.3 million).
THOMSON ONE Business School Edition: For instructions on using Thomson ONE, refer to
the instructions provided with the Thomson ONE problems at the end of Chapters 1–6.
Mini-Case
Cost of Capital and Project Risk
Cascade Water Company (CWC) currently has 30,000,000 shares of common stock outstanding
that trade at a price of $42 per share. CWC also has 500,000 bonds outstanding that currently trade
at $923.38 each. CWC has no preferred stock outstanding and has an equity beta of 2.639. The
risk-free rate is 3.5%, and the market is expected to return 12.52%. The firm’s bonds have a 20–
year life, a $1,000 par value, a 10% coupon rate and pay interest semi-annually.
CWC is considering adding to its product mix a “healthy” bottled water geared toward
children. The initial outlay for the project is expected to be $3,000,000, which will be depreciated
298 Instructor’s Manual
using the straight-line method to a zero salvage value, and sales are expected to be 1,250,000 units
per year at a price of $1.25 per unit. Variable costs are estimated to be $0.24 per unit, and fixed
costs of the project are estimated at $200,000 per year. The project is expected to have a 3-year life
and a terminal value (excluding the operating cash flows in year 3) of $500,000. CWC has a 34%
marginal tax rate. For the purposes of this project, working capital effects will be ignored. Bottled
water targeted at children is expected to have different risk characteristics from the firm’s current
products. Therefore, CWC has decided to use the “pure play” approach to evaluate this project.
After researching the market, CWC managed to find two pure-play firms. The specifics for those
two firms are:
Firm
Equity Beta
D/E
Tax Rate
Fruity Water
1.72
0.43
34%
Ladybug Drinks
1.84
0.35
36%
1. Determine the current weighted average cost of capital for CWC.
2. Determine the appropriate discount rate for the healthy bottled water project.
3. Should the firm undertake the healthy bottled water project? As part of your analysis, include
sensitivity analysis for sales price, variable costs, fixed costs, and unit sales at ±10%, 20%, and
30% from the base case. Also perform an analysis of the following two scenarios:
a. Best case: Selling 2,500,000 units at a price of $1.24 per unit with variable production costs
of $0.22 per unit.
b. Worst case: Selling 950,000 units at a price of $1.32 per unit, with variable production costs
of $0.27 per unit.
Answer:
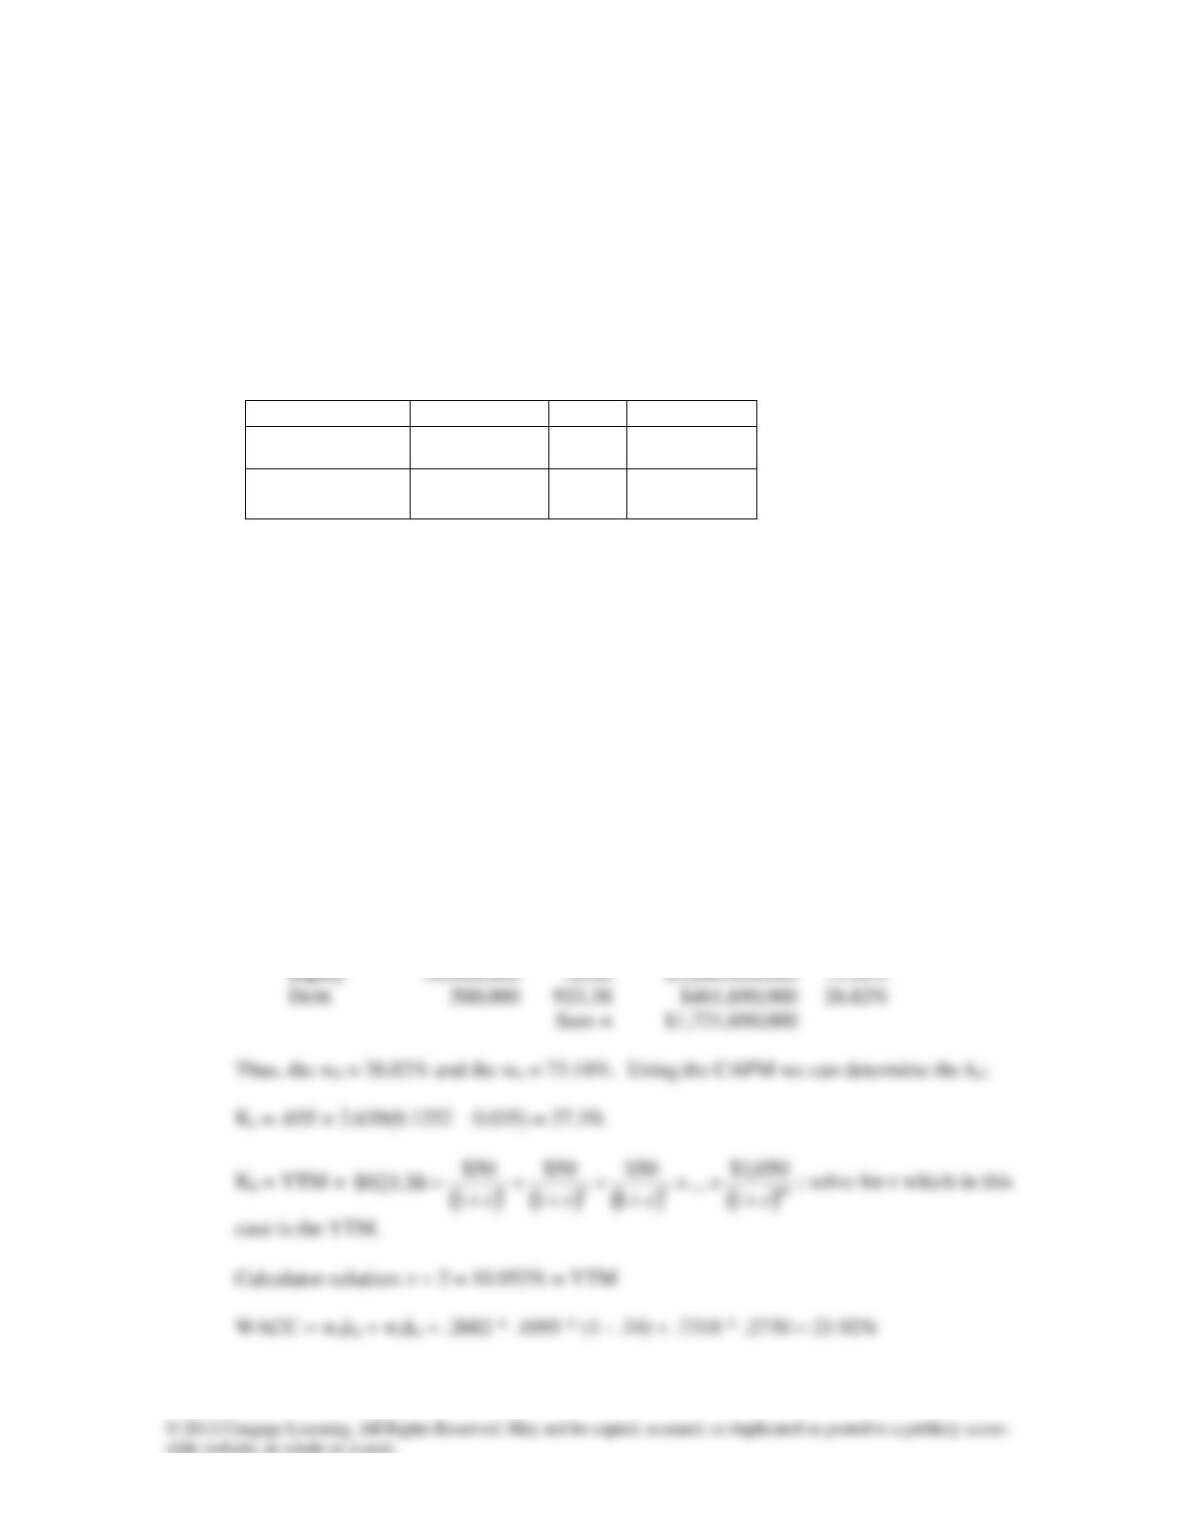
1.
# of securities
Price
per se-
curity
Total Market Val-
ue
Weight
Equity
2.
Firm
Equity Beta
D/E
Tax Rate
Asset Beta
Fruity Water
1.72
0.43
34%
1.72/(1+(1-.34)*0.43)=1.339773
Ladybug Drinks
1.84
0.35
36%
1.84/(1+(1-.36)*0.35)=1.503268
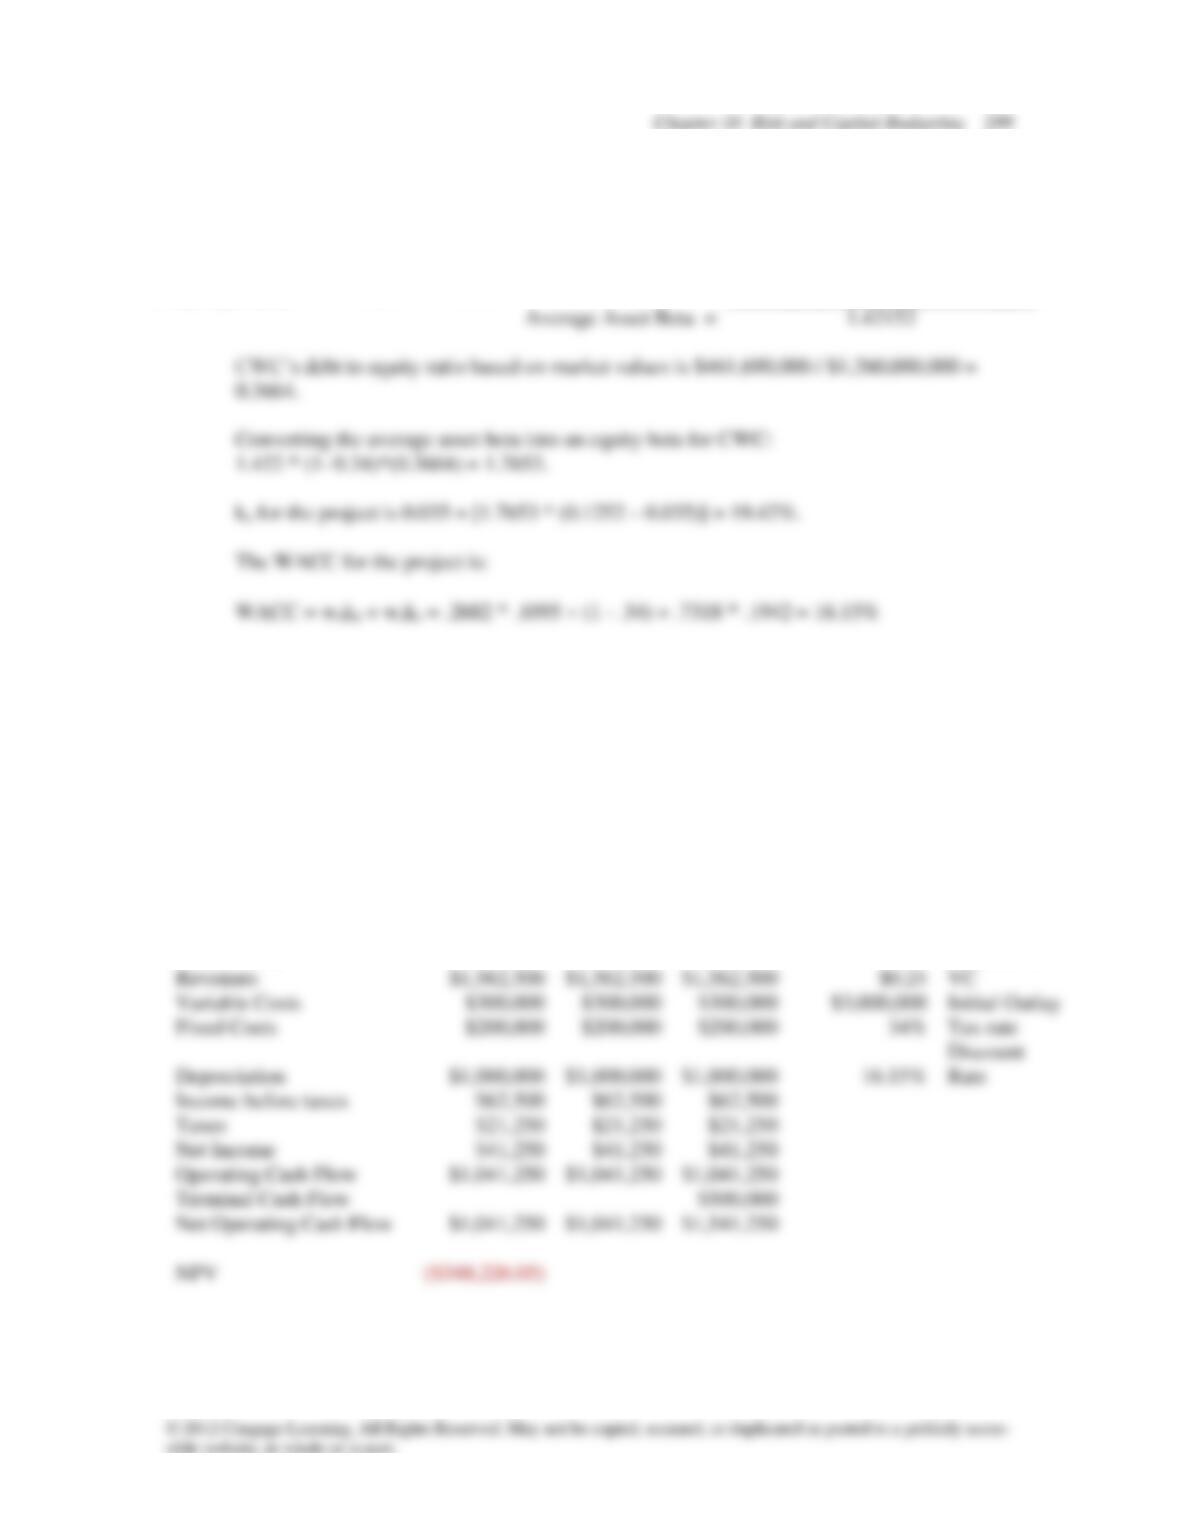
3. Based upon the information calculated below, I would not accept the project. The base
case has a negative NPV. According to the Sensitivity Analysis, the project is rather sensi-
tive to the Sales Price and Unit Sales. Unit Sales would have to be approximately 20%
higher than expected before the project is expected to generate a positive NPV and the
Sales Price would have to be approximately 15% higher. Even if Variable Costs and Fixed
Costs drop by 30% (independently of each other) the project is not expected to have a posi-
tive NPV. Also, if there is a chance that, should the worse case occur, the firm would be
forced into bankruptcy, the project should not be undertaken.
Base Case:
1
2
3
Sales (units)
1,250,000
1,250,000
1,250,000
$1.25
Sales Price
Revenues
$1,562,500
$1,562,500
Variable Costs
$3,000,000
Initial Outlay
Fixed Costs
Tax rate
Depreciation
$1,000,000
$1,000,000
Income before taxes
Taxes
Net Income
Operating Cash Flow
$1,041,250
$1,041,250
Terminal Cash Flow
Net Operating Cash Flow
$1,041,250
$1,541,250
NPV
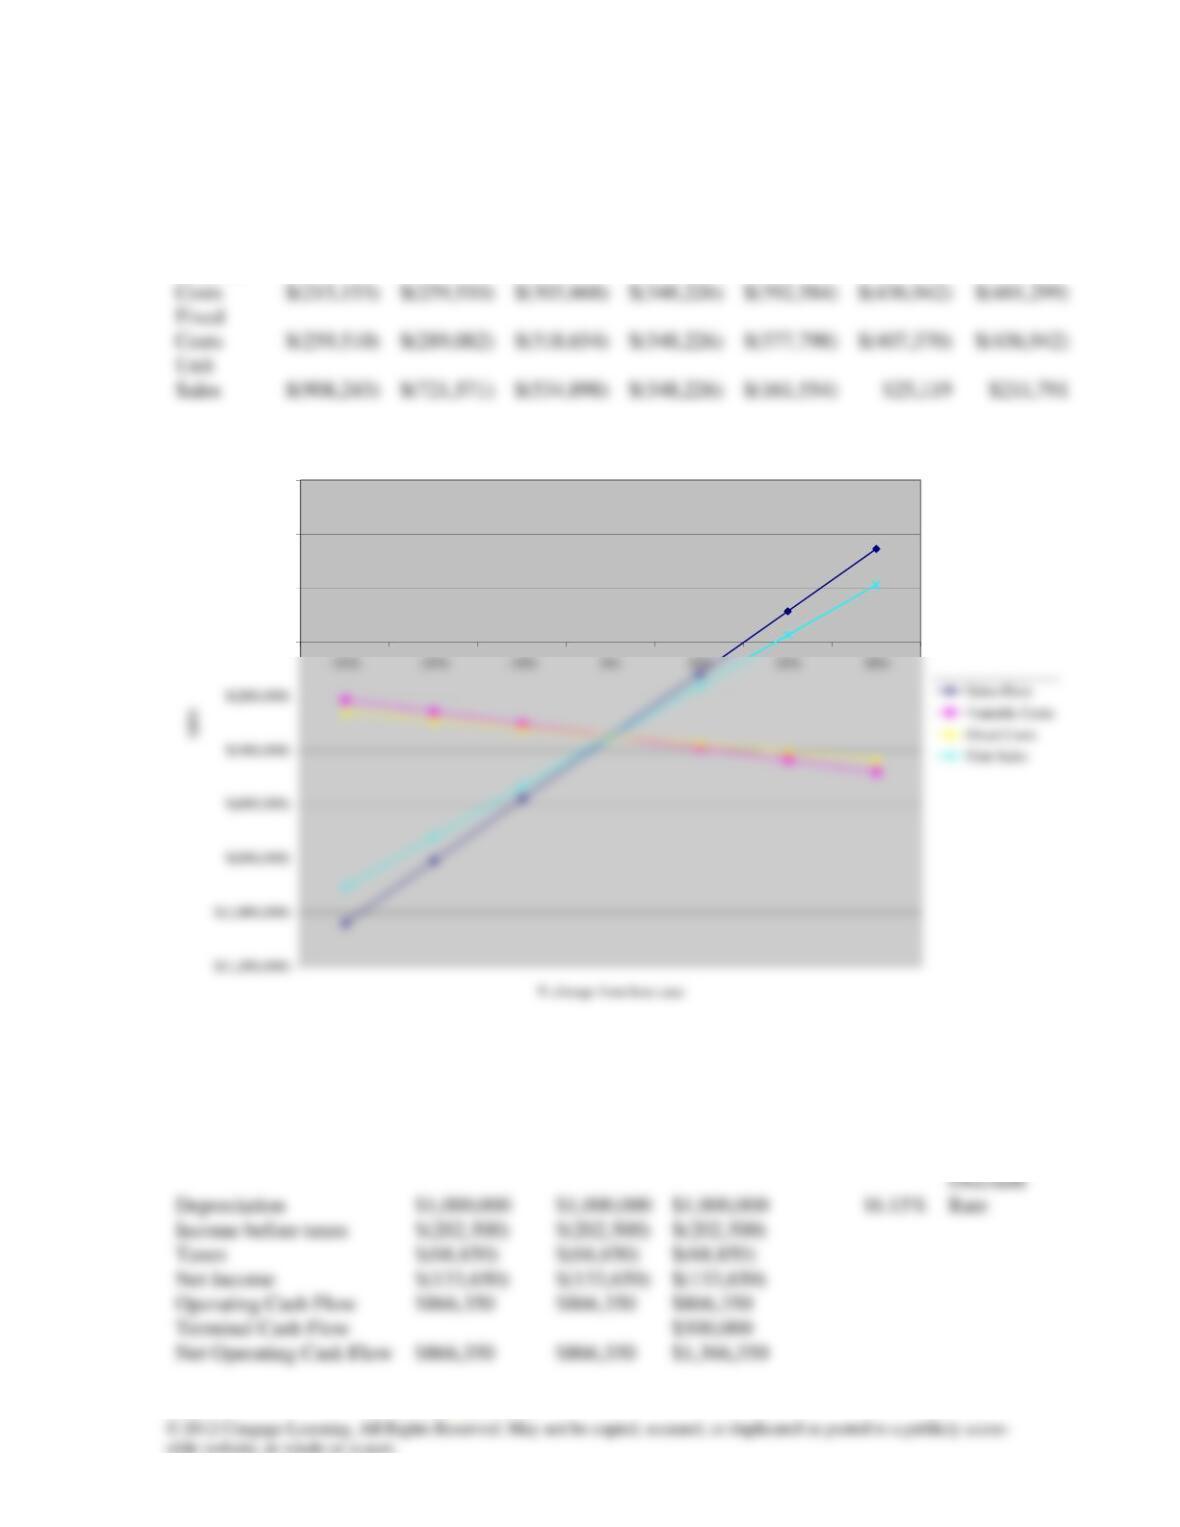
300 Instructor’s Manual
-30%
-20%
-10%
0%
10%
20%
30%
Sales
Price
$(1,041,316)
$(810,286)
$(579,256)
$(348,226)
$(117,196)
$113,834
$344,864
Costs
$(259,510)
$(303,868)
$(348,226)
$(392,584)
$(436,942)
Costs
$(259,510)
$(289,082)
$(318,654)
$(348,226)
$(377,798)
$(407,370)
Unit
$(908,243)
$(721,571)
$(534,898)
$(348,226)
$(161,554)
Variable
Sensitivity Analysis
$-
$200,000
$400,000
$600,000
Worst Case
1
2
3
Sales (units)
950,000
950,000
950,000
$1.32
Sales Price
Revenues
$1,254,000
$1,254,000
$1,254,000
$0.27
VC
Variable Costs
$256,500
$256,500
$256,500
$3,000,000
Initial Outlay
Fixed Costs
$200,000
$200,000
$200,000
34%
Tax rate
Depreciation
$1,000,000
$1,000,000
$1,000,000
Discount
Income before taxes
$(202,500)
$(202,500)
$(202,500)
Taxes
$(68,850)
$(68,850)
$(68,850)
Net Income
$(133,650)
$(133,650)
$(133,650)
Operating Cash Flow
$866,350
$866,350
$866,350
Net Operating Cash Flow
$866,350
$866,350
$1,366,350
NPV
($740,053.13)
Chapter 10 Risk and Capital Budgeting 301
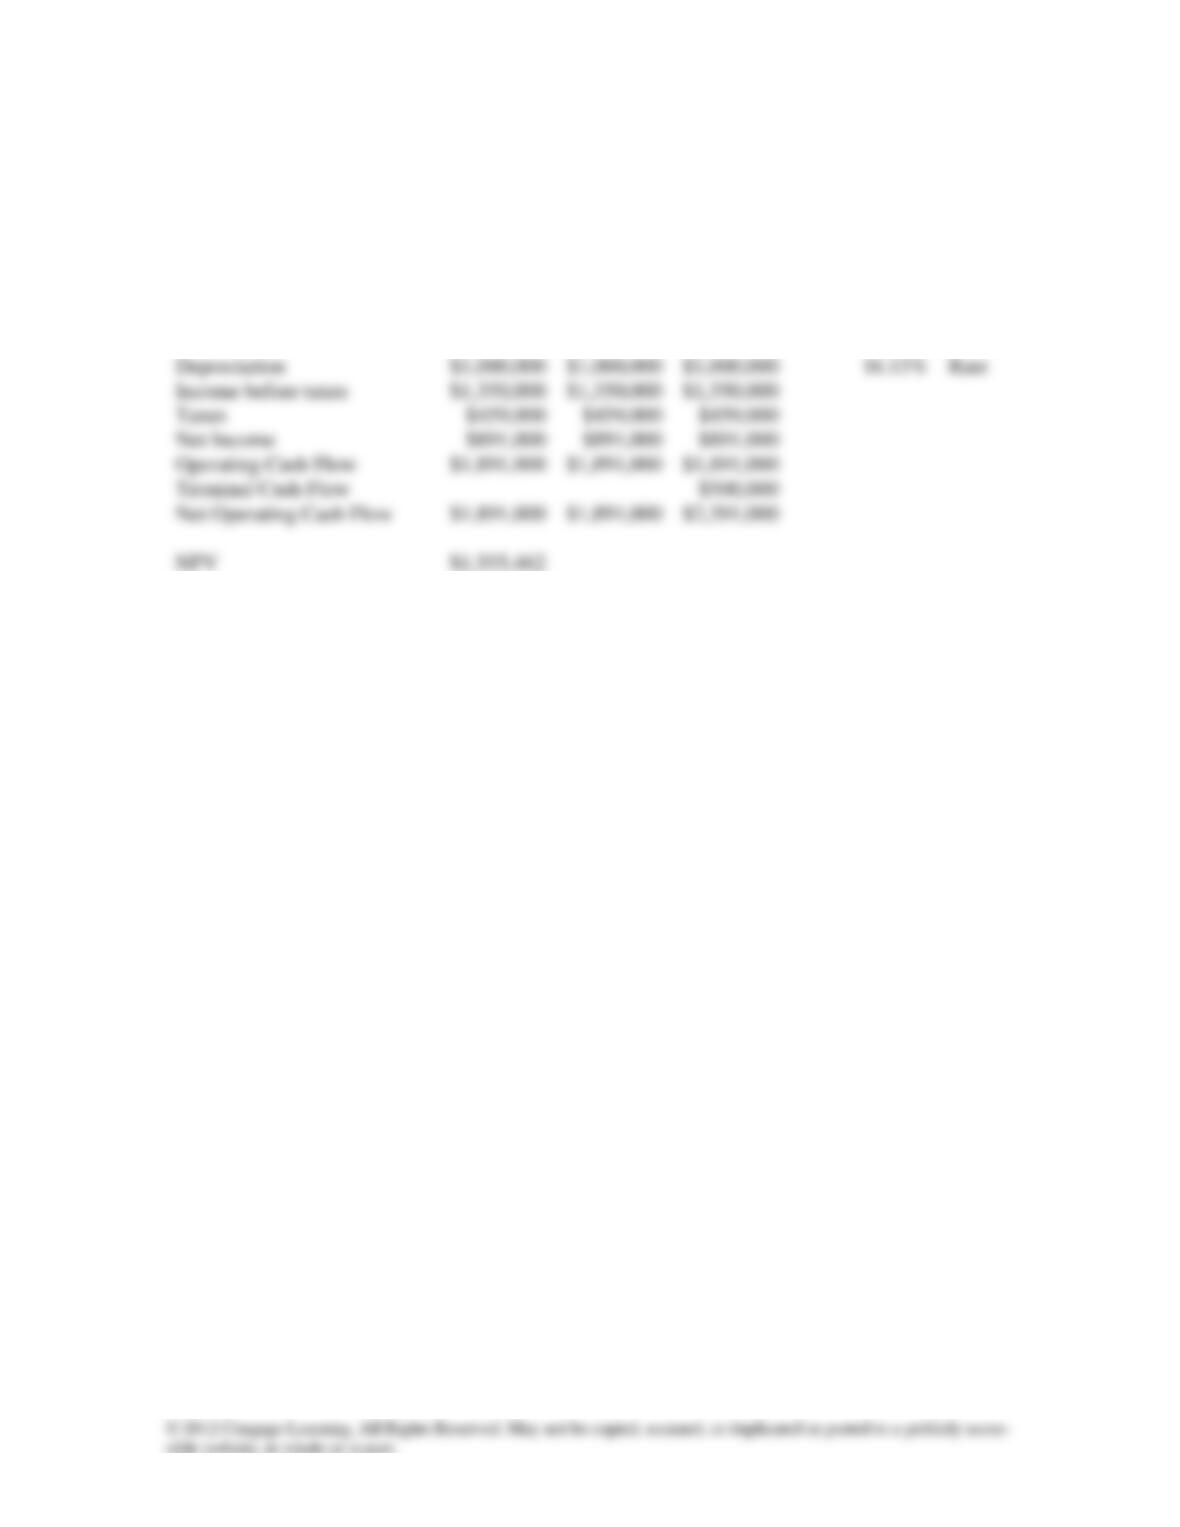
Best Case
1
2
3
Sales (units)
2,500,000
2,500,000
2,500,000
$1.24
Sales Price
Revenues
$3,100,000
$3,100,000
$3,100,000
$0.22
VC
Variable Costs
$550,000
$550,000
$550,000
$3,000,000
Initial Outlay
Fixed Costs
$200,000
$200,000
$200,000
34%
Tax rate
Depreciation
$1,000,000
$1,000,000
Income before taxes
$1,350,000
$1,350,000
Taxes
Net Income
Terminal Cash Flow
$500,000
Net Operating Cash Flow
$1,891,000
$1,891,000
$2,391,000
NPV
Discount