1
2
3
4
5
6
7
8
9
10
20
21
22
23
24
25
26
27
28
29
30
31
32
33
34
35
36
37
38
39
40
41
42
43
44
45
46
47
48
49
50
51
52
53
54
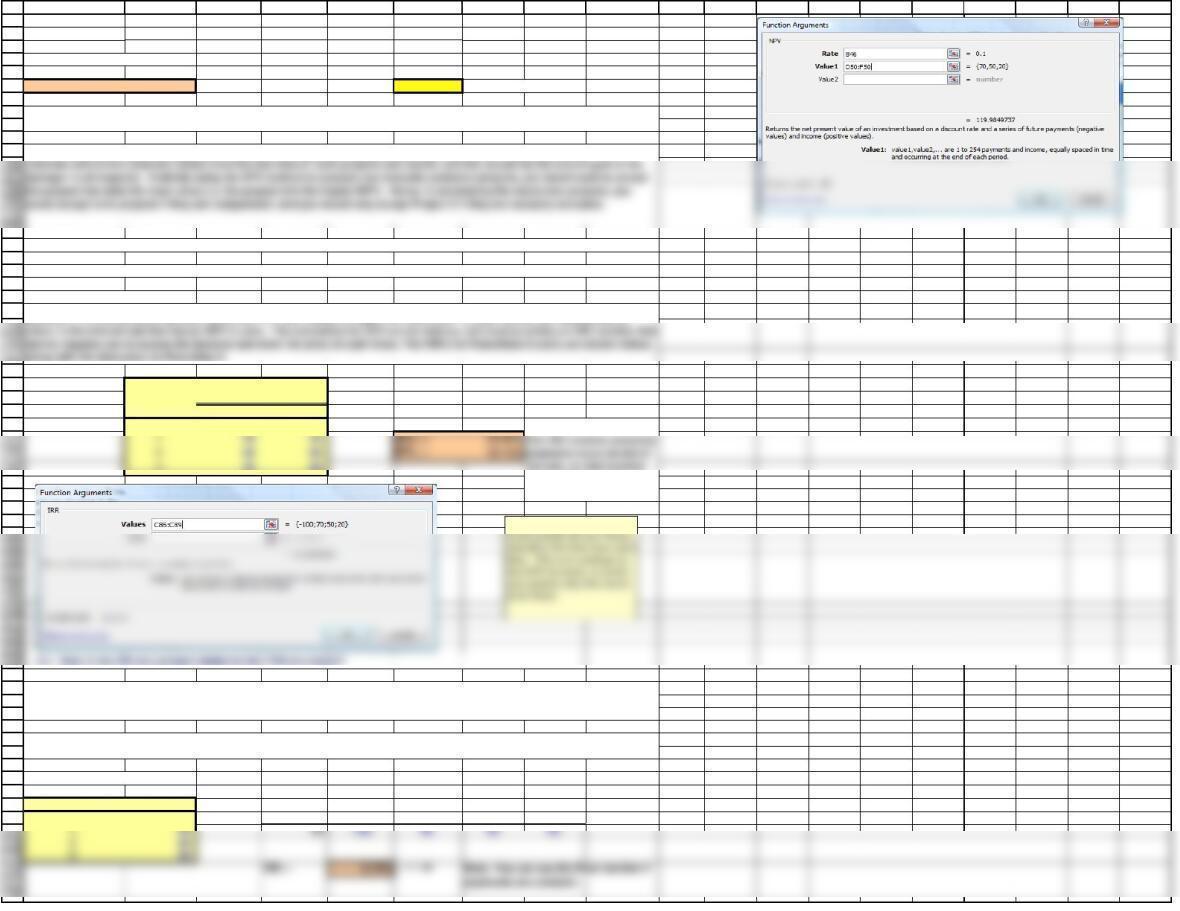
result of the NPV function.
A B C D E F G H I J K L M N O P Q R S
11/20/2018
Situation
Franchise S
Year (t) Franchise S Franchise L Year 0 1 2 3
0-$100 -$100 CF -100 70 50 20
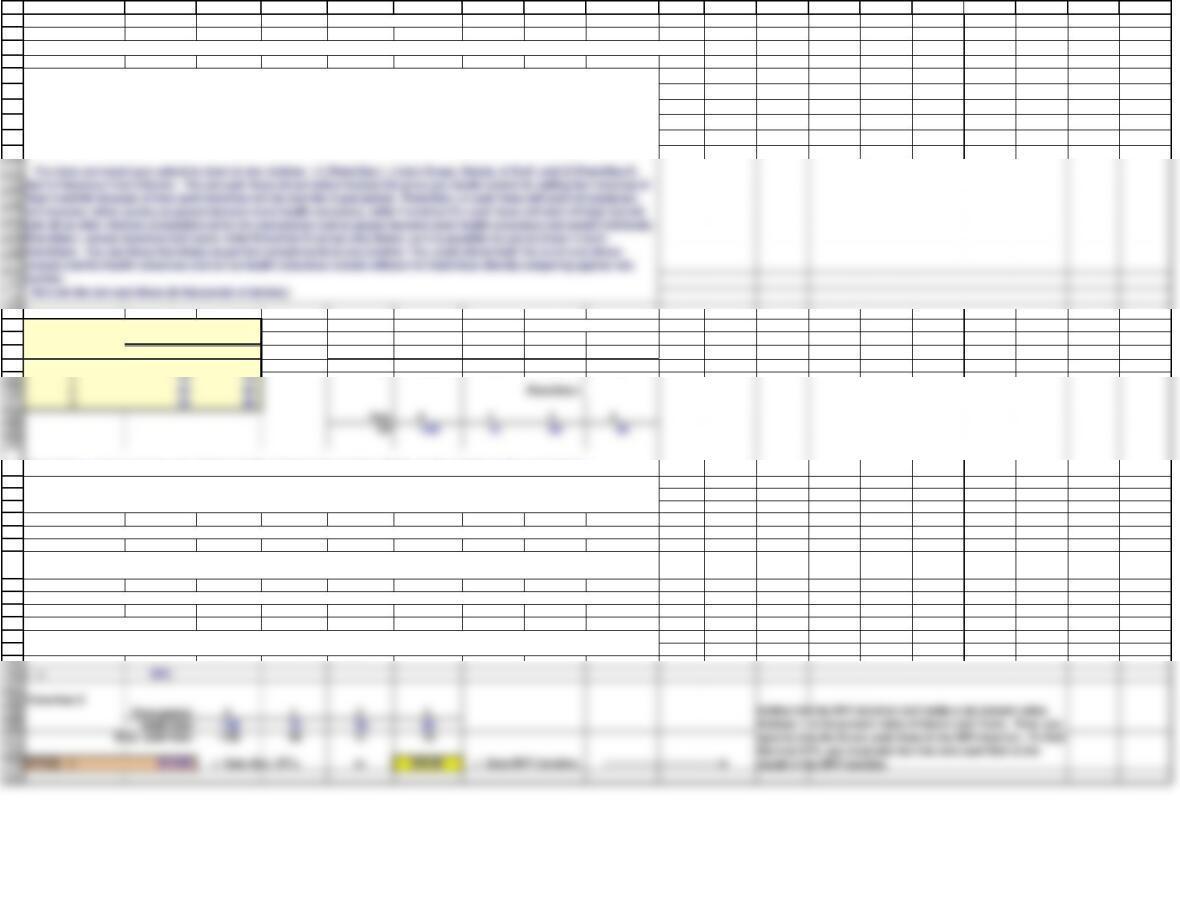
Net Present Value (NPV)
Depreciation, salvage values, net working capital requirements, and tax effects are all included in these cash flows.
You also have made subjective risk assessments of each franchise and concluded that both franchises have risk characteristics
that require a return of 10%. You must now determine whether one or both of the franchises should be accepted.
c. (1.) Define the term net present value (NPV). What is each franchise’s NPV?
To calculate the NPV, we find the present value of the individual cash flows and find the sum of those discounted cash flows.
This value represents the value the project add to shareholder wealth.
a. What is capital budgeting? Answer: See Chapter 10 Mini Case Show
b. What is the difference between independent and mutually exclusive projects? Answer: See Chapter 10 Mini Case Show
Chapter 10. Mini Case
Expected
Net Cash Flows
You have just graduated from the MBA program of a large university, and one of your favorite courses was “Today‘s
Entrepreneurs.” In fact, you enjoyed it so much you have decided you want to “be your own boss.” While you were in the
master’s program, your grandfather died and left you $1 million to do with as you please. You are not an inventor, and you do not
have a trade skill that you can market; however, you have decided that you would like to purchase at least one established
franchise in the fast-foods area, maybe two (if profitable). The problem is that you have never been one to stay with any project
for too long, so you figure that your time frame is three years. After three years you will go on to something else.
55
56
57
58
59
60
61
62
63
64
65
72
73
74
75
76
77
78
82
83
84
85
86
89
90
91
92
93
94
95
96
97
98
99
100
101
102
103
104
(2.) How is the IRR on a project related to the YTM on a bond?
105
106
107
108
109
110
111
112
113
114
115
116
117
118
119
120
121
122
A B C D E F G H I J K L M N O P Q R S
Franchise L
Time period: 0 1 2 3
Cash flow: -100 10 60 80
Disc. cash flow: -100 950 60
NPV(L) = $18.78 $18.78 = Uses NPV function.
Internal Rate of Return (IRR)
Year (t) Franchise S Franchise L
0-$100 -$100
320 80
Constant Cash Flows
Year (t) Cash Flow
0-$100 Year 0 1 2 3
The NPV method of capital budgeting dictates that all independent projects that have positive NPV should accepted. The
(3.) Would the NPVs change if the cost of capital changed? Answer: See Chapter 10 Mini Case Show
The internal rate of return is defined as the discount rate that equates the present value of a project’s cash inflows to its
outflows. It is the discount rate that forces the PV of the inflows to equal the initial cost. In other words, the internal rate of
d. (1.) Define the term internal rate of return (IRR). What is each franchise’s IRR?
net cash flows
(2.) What is the rationale behind the NPV method? According to NPV, which franchise or franchises should be accepted if they
are independent? Mutually exclusive?
Expected
does not have to be
adjusted.
The IRR is the discount rate that forces the PV of a project’s expected future cash flows to equal the initial cash flow. This is
analogous to a bond’s yield because a bond’s yield is the discount rate that forces the present value of a bonds coupons and
maturity value to equal the price of the bond.
Suppose the initial cost of a project is $100 and it has cash flows of $40 at Years 1, 2, and 3. What is its IRR? Use the Excel
RATE function as though the project were a bond.
Notice that for IRR you
66
67
68
69
70
71
would accept both projects if they are independent, and you would only accept Project S if they are mutually exclusive.
123
124
125
126
127
128
129
130
131
132
137
138
139
140
141
142
143
144
145
146
147
148
149
150
151
152
153
154
155
4% 31.32 4% 36.21
6% 27.33 6% 30.00
156
157
158
159
160
161
162
163
164
165
166
167
168
169
170
171
172
173
174
175
176
177
178
179
180
181
182
183
184
185
186
187
A B C D E F G H I J K L M N O P Q R S
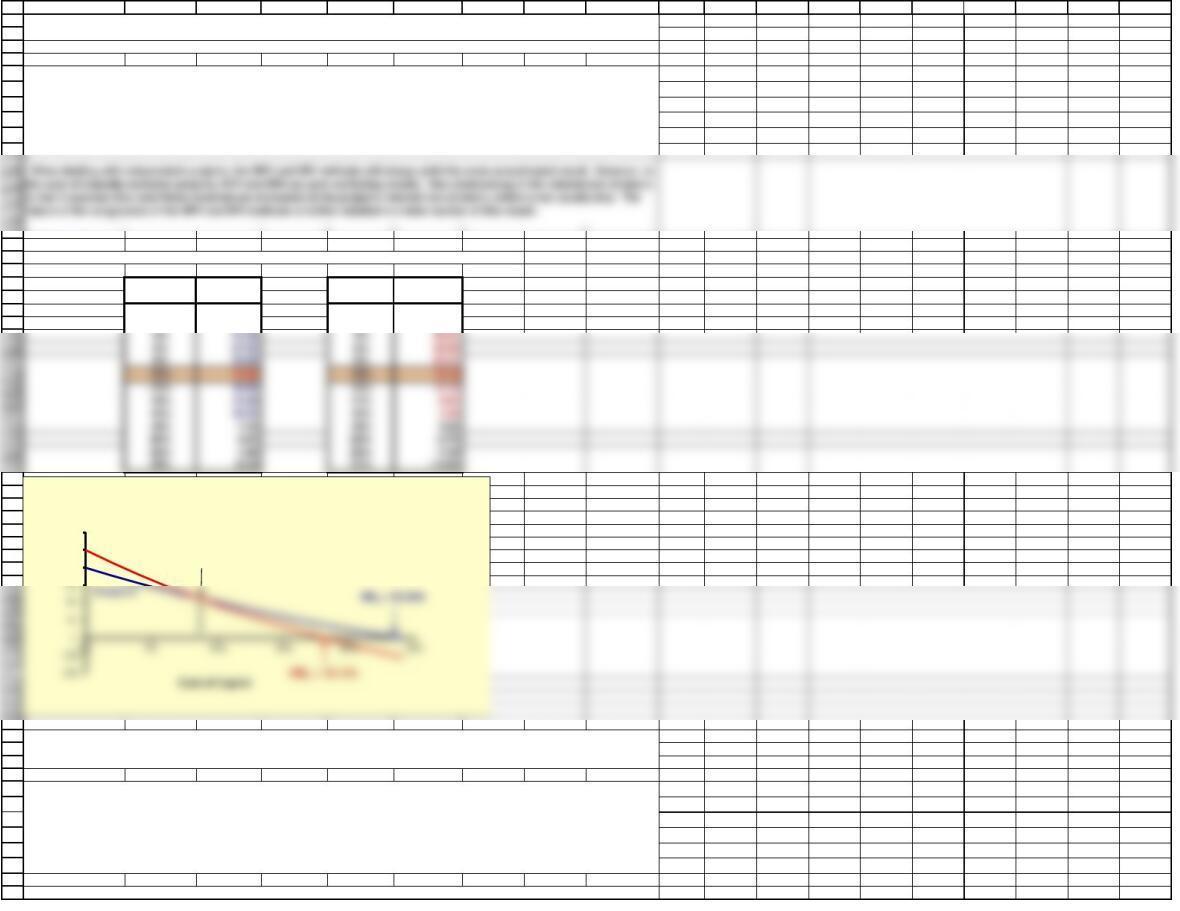
NPV Profiles
e. Draw NPV profiles for Franchises L and S. At what discount rate do the profiles cross?
Franchise S Franchise L
r$19.98 r$18.78
0% 40.00 0% 50.00
2% 35.53 2% 42.86
f. What is the underlying cause of ranking conflicts between NPV and IRR?
The IRR method of capital budgeting maintains that projects should be accepted if their IRR is greater than the cost of capital.
Strict adherence to the IRR method would further dictate that mutually exclusive projects should be chosen on the basis of the
greatest IRR. In this scenario, both franchises have IRRs that exceed the cost of capital (10%) and both should be accepted, if
they are independent. If, however, the franchises are mutually exclusive, we would choose Franchise S. Recall, that this was our
determination using the NPV method as well. The question that naturally arises is whether or not the NPV and IRR methods will
always arrive at the same conclusion.
Previously, we had discussed that in some instances the NPV and IRR methods can give conflicting results. First, we should
attempt to define what we see in this graph. Notice, that the two franchises’ profiles (S and L) intersect the X-axis at costs of
capital of 18.13% and 23.56%, respectively. Not coincidently, those are the IRRs of the franchises. If we think about the
definition of IRR, we remember that the internal rate of return is the cost of capital at which a project will have an NPV of zero.
Looking at our graph, it is a logical conclusion that the project IRR is defined as the point at which its profile intersects the
X-axis.
(4.) Would the franchises’ IRRs change if the cost of capital changed?
(2.) Look at your NPV profile graph without referring to the actual NPVs and IRRs. Which franchise or franchises should be
accepted if they are independent? Mutually exclusive? Explain. Are your answers correct at any cost of capital less than
23.6%?
(3.) What is the logic behind the IRR method? According to IRR, which franchises should be accepted if they are
independent?
40
50
60
NPV ($)
NPV Profile of Franchises S and L
Project L
Crossover
Rate = 8.7%
188
189
190
195
196
197
198
199
200
201
202
203
204
205
206
207
208
209
210
211
high values of t. (2) Long-term projects like L have most of their cash flows coming in the later years, when the discount penalty
is largest; hence, they are most severely impacted by high capital costs. (3) Therefore, Franchise L’s NPV profile is steeper than
212
213
214
215
216
217
218
219
220
221
222
223
224
225
226
229
230
232
233
234
235
236
237
238
239
240
242
244
245
246
247
249
A B C D E F G H I J K L M N O P Q R S
Cash Flow
Year (t) Franchise S Franchise L Differential
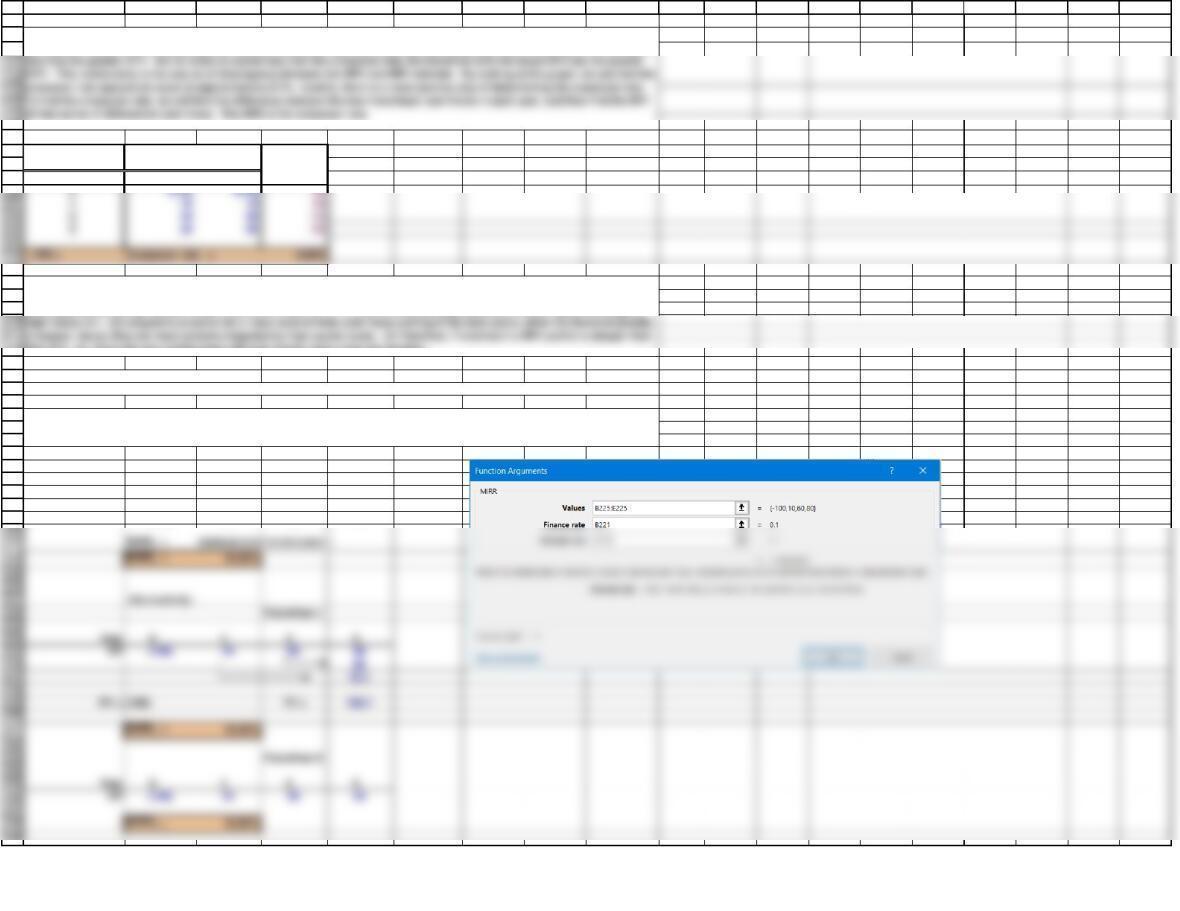
Modified Internal Rate of Return (MIRR)
WACC = 10%
Franchise L
Year 0 1 2 3
CF (100) 10 60 80
g. Define the term modified IRR (MIRR). Find the MIRRs for Franchises L and S.
Expected
Net Cash Flows
The intuition behind the relationship between the NPV profile and the crossover rate is as follows: (1) Distant cash flows are
heavily penalized by high discount rates–the denominator is (1 + r)t, and it increases geometrically; hence, it gets very large at
that of S. (4) Since the two profiles have different slopes, they cross one another.
Looking further at the NPV profiles, we see that the two franchises profiles intersect at a point we shall call the crossover rate.
We observe that at costs of capital greater than the crossover rate, the franchise with the greater IRR (Franchise S, in this case)
The modified internal rate of return is the discount rate that causes a project‘s cost (or cash outflows) to equal the present value
of the project’s terminal value. To find MIRR, use Excel’s MIRR function. Alternatively, calculate the PV of the outflows and the
FV of the inflows and then find the discount rate that equates the two.
250
251
252
253
254
255
256
268
269
270
271
272
273
274
275
276
277
278
279
280
281
282
283
284
285
286
287
288
289
Payback: 1.600
Payback: 1.600
290
291
292
293
294
295
296
297
298
299
300
301
302
303
304
305
306
307
308
309
310
311
312
313
314
315
Franchise S
Time period: 0 1 2 3
Cash flow: -100 70 50 20
Discounted payback period uses the project’s cost of capital to discount the expected cash flows. The calculation of discounted
payback period is identical to the calculation of regular payback period, except you must base the calculation on a new row of
cash flows discounted at r back to t = 0. Note that both projects have a cost of capital of 10%.
316
A B C D E F G H I J K L M N O P Q R S
PROFITABILITY INDEX
h. What does the profitability index (PI) measure? What are the PI’s for Franchises S and L?
Payback Period
Franchise S
Time period: 0 1 2 3
Cash flow: -100 70 50 20
Cumulative cash flow: -100 -30 20 40
Franchise L
Time period: 0 1 2 3
Cash flow: -100 10 60 80
Cumulative cash flow: -100 -90 -30 50
Payback: 2.375
Discounted Payback Period
Disc. cum. cash flow: -100 -36 520
The profitability index is the present value of all future cash flows divided by the intial cost. It measures the PV per dollar of
investment.
(3.) What is the difference between the regular and discounted payback periods?
The payback period is defined as the expected number of years required to recover the investment, and it was the first formal
method used to evaluate capital budgeting projects. First, we identify the year in which the cumulative cash inflows exceed the
initial cash outflows. That is the payback year. Then we take the previous year and add to it the fraction calculated as the
unrecovered balance at the end of that year divided by the following year’s cash flow. Generally speaking, the shorter the
payback period, the better the investment.
(2.) What is the rationale for the payback method? According to the payback criterion, which franchise or franchises should
be accepted if the firm’s maximum acceptable payback is 2 years, and if Franchise L and S are independent? If they are
mutually exclusive? Answer: See Chapter 12 Mini Case Show
Intermediate calculation to
257
260
261
262
265
266
267
i. (1.) What is the payback period? Find the paybacks for Franchises L and S.