
ANSWERS TO END-OF-CHAPTER QUESTIONS
10-1 a. Capital budgeting is the whole process of analyzing projects and deciding whether they
should be included in the capital budget. This process is of fundamental importance to
the success or failure of the firm as the fixed asset investment decisions chart the course
of a company for many years into the future. The payback, or payback period, is the
number of years it takes a firm to recover its project investment. Payback may be
calculated with either raw cash flows (regular payback) or discounted cash flows
(discounted payback). In either case, payback does not capture a project’s entire cash
c. The net present value (NPV) and internal rate of return (IRR) techniques are discounted
cash flow evaluation techniques because they explicitly recognize the time value of
money. NPV is the present value of the project’s expected future cash flows (both
inflows and outflows), discounted at the appropriate cost of capital. NPV is a direct
measure of the value of the project to shareholders. The internal rate of return (IRR) is
the discount rate that equates the present value of the expected future cash inflows and
outflows. IRR measures the rate of return on a project, but it assumes that all cash
flows can be reinvested at the IRR rate. The profitability index is the ratio of the present
value of future cash flows to the project’s initial cost. It shows the relative profitability
Chapter 10
The Basics of Capital Budgeting: Evaluating Cash
Flows
e. An NPV profile is the plot of a project’s NPV versus its cost of capital. The crossover
rate is the cost of capital at which the NPV profiles for two projects intersect indicating
that at that point their NPVs are equal.
g. The mathematics of the NPV method imply that project cash flows are reinvested at
the cost of capital while the IRR method assumes reinvestment at the IRR. Since
project cash flows can be replaced by new external capital that costs r, the proper
reinvestment rate assumption is the cost of capital, and thus the best capital budget
decision rule is NPV.
10-2 Projects requiring greater investments or that have greater risk should be given detailed
analysis the capital budgeting process.
10-3 The NPV is obtained by discounting future cash flows, and the discounting process actually
10-4 This question is related to Question 10-3 and the same rationale applies. With regard to
the second part of the question, the answer is no; the IRR rankings are constant and
independent of the firm’s cost of capital.

10-5 Generally, the failure to employ common-life analysis in such situations will bias the NPV
against the shorter project because it “gets no credit” for profits beyond its initial life, even
though it could possibly be “renewed” and thus provide additional NPV.
SOLUTIONS TO END-OF-CHAPTER PROBLEMS
10-1 NPV = -$40,000 + $9,000[(1/I) – (1/(I × (1 + I)N)]
= -$40,000 + $9,000[(1/0.11) – (1/(0.11 × (1 + 0.11)7)]
= $2,409.77.
Financial calculator solution: Input CF0 = -40000, CF1-7 = 9000, I/YR = 11, and then
solve for NPV = $2,409.77.
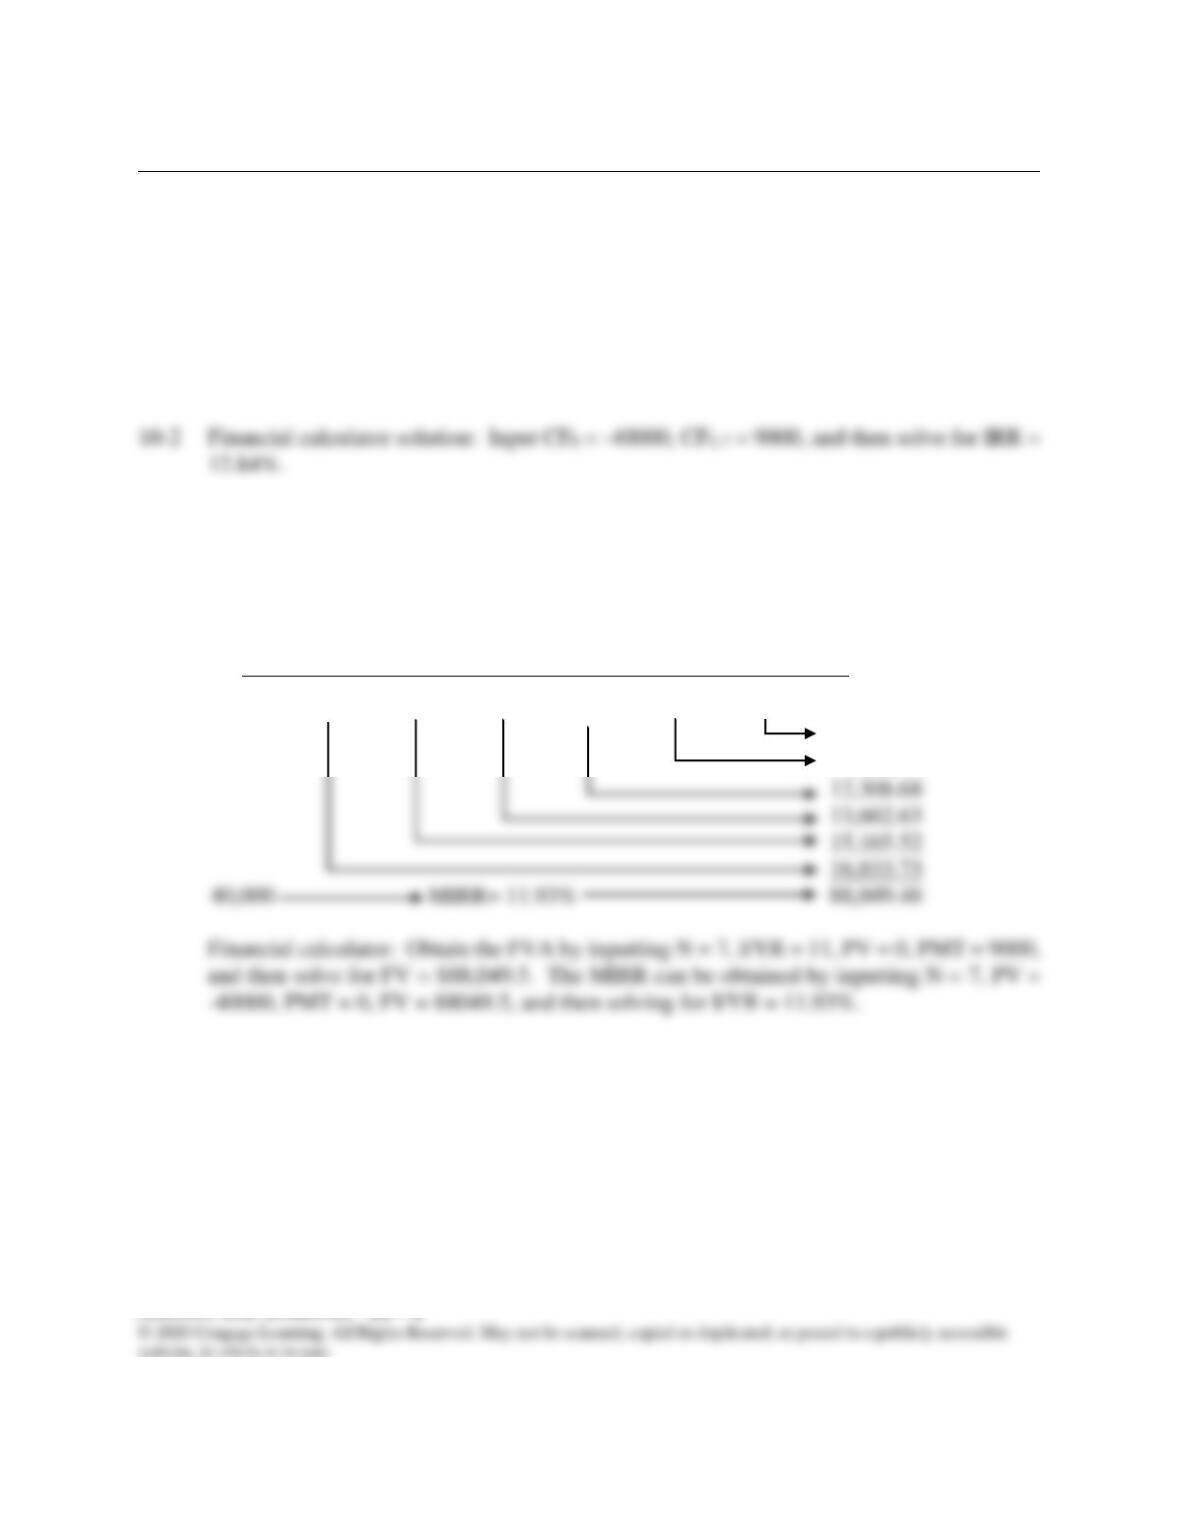
10-3 MIRR: PV Costs = $40000.
FV Inflows:
PV FV
0 1 2 3 4 5 6 7
| | | | | | | |
9,000 9,000 9,000 9,000 9,000 9,000 9,000.00
9,900.00
11,088.90
12%
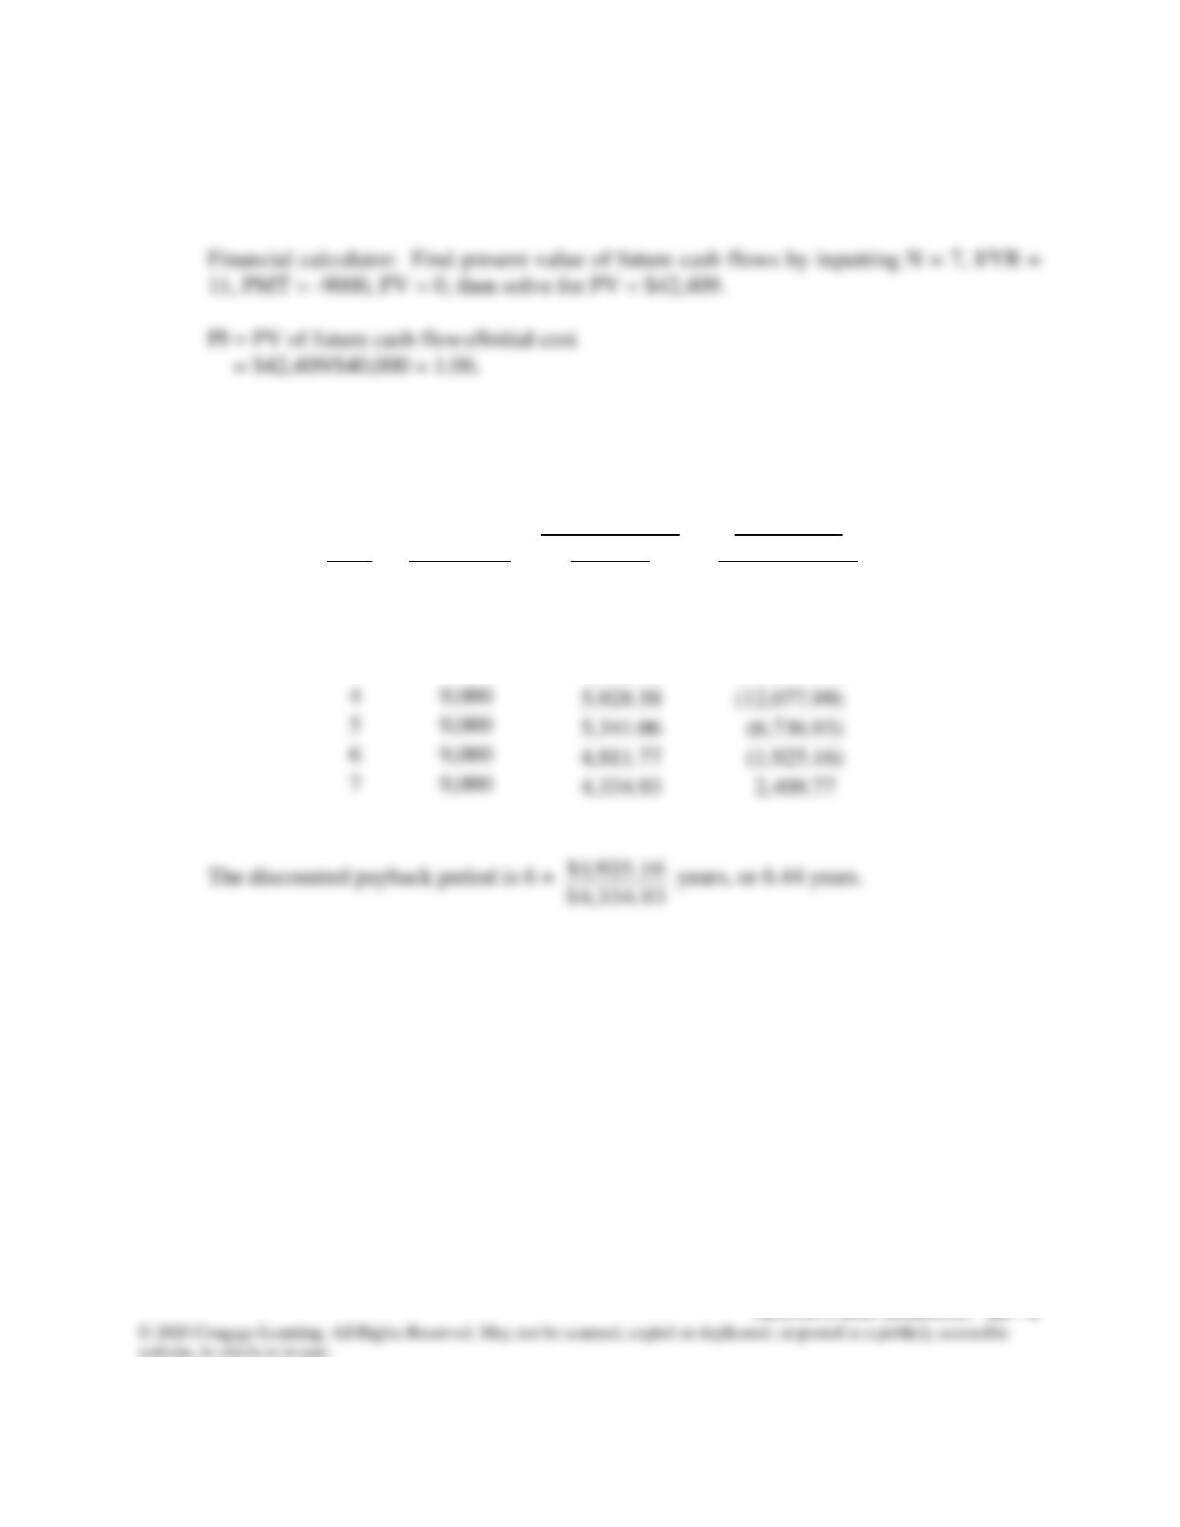
10-4 PV = $9,000[(1/I) – (1/(I × (1 + I)N)]
= $9,000[(1/0.11) – (1/(0.11 × (1 + 0.11)7)]
= $42,410.
10-5 Since the cash flows are a constant $9,000, calculate the payback period as:
$40,000/$9,000 = 4.44, so the payback is about 4 years.
10-6 The project’s discounted payback period is calculated as follows:
Year
Annual CF
Discounted CF
(@11%)
Cumulative
Discounted CF
0
-40,000
-40,000.00
1
9,000
8,108.11
(31,891.89)
2
9,000
7,304.60
(24,587.29)
3
9,000
6,580.72
(18,006.57)
4
9,000
5,928.58
(12,077.99)
5
9,000
5,341.06
(6,736.93)
6
9,000
4,811.77
(1,925.16)
4,334.93
10-7 a. Project A: Using a financial calculator, enter the following:
CF0 = -15000000
CF1 = 5000000
CF2 = 10000000
CF3 = 20000000
Project B: Using a financial calculator, enter the following:
CF0 = -15000000
CF1 = 20000000
CF2 = 10000000
CF3 = 6000000
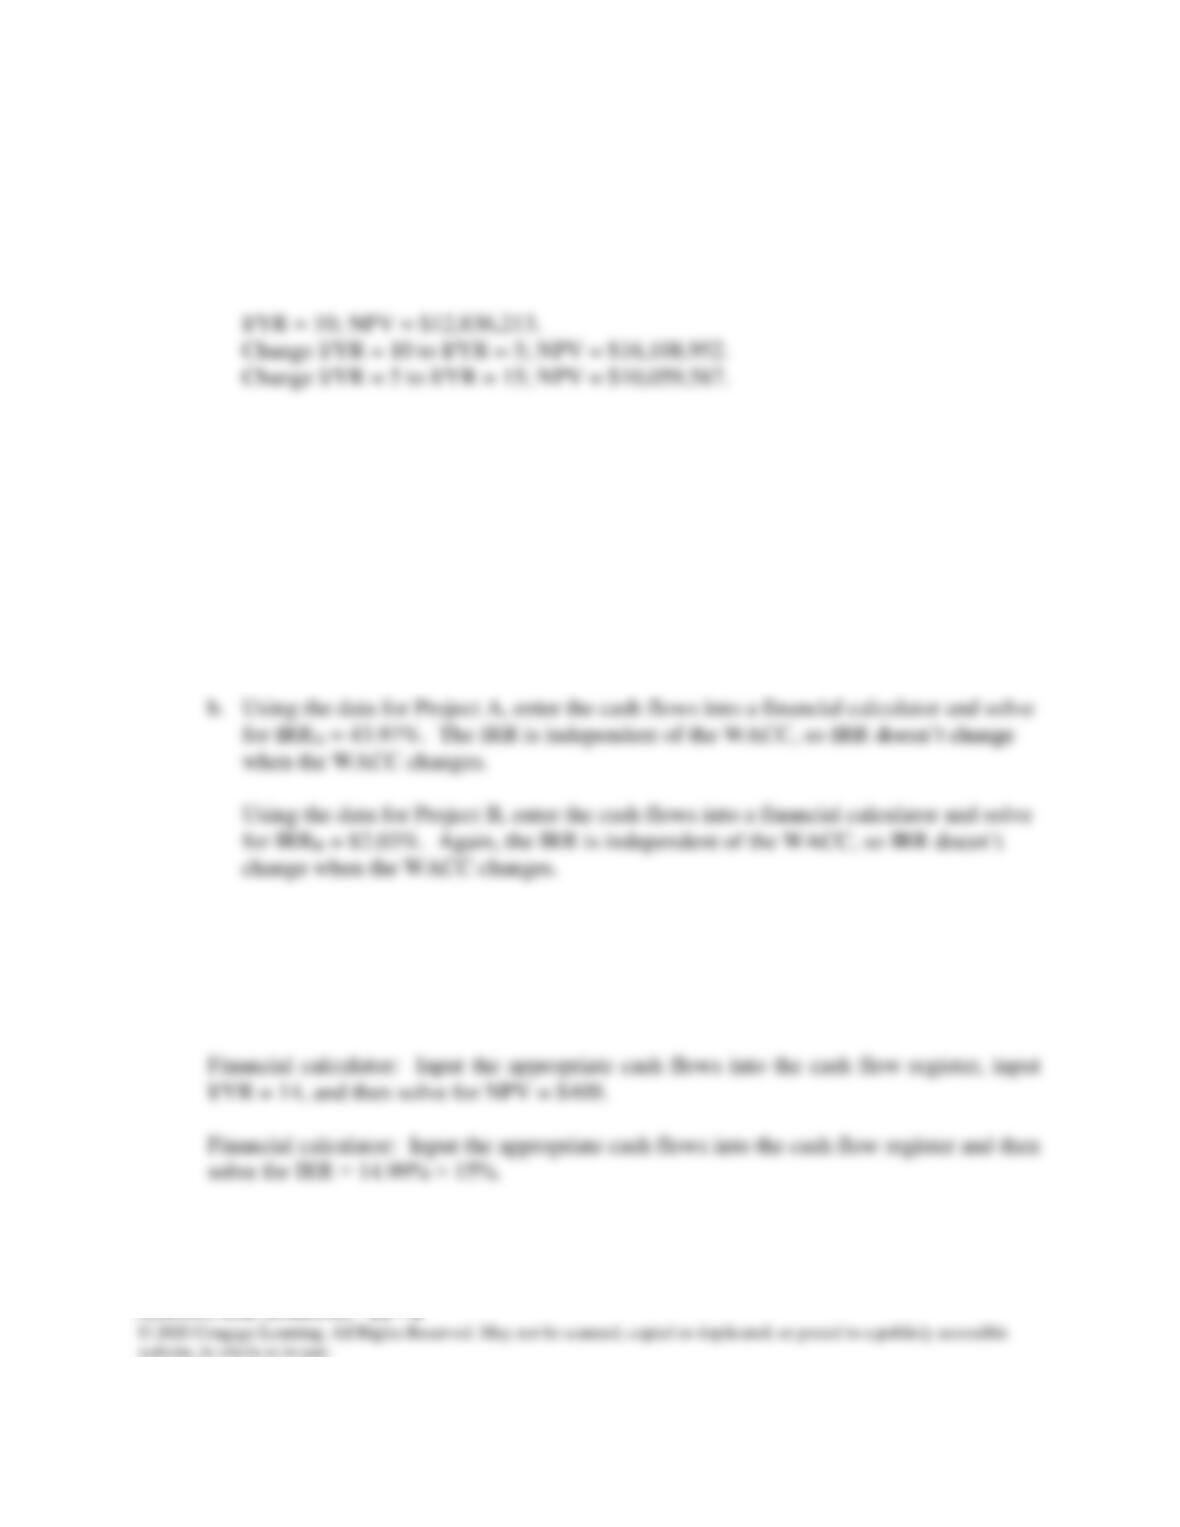
I/YR = 10; NPV = $15,954,170.
Change I/YR = 10 to I/YR = 5; NPV = $18,300,939.
Change I/YR = 5 to I/YR = 15; NPV = $13,897,838.
10-8 Truck:
NPV = -$17,100 + $5,100(PVIFA14%,5)
= -$17,100 + $5,100(3.4331) = -$17,100 + $17,509
= $409. (Accept)
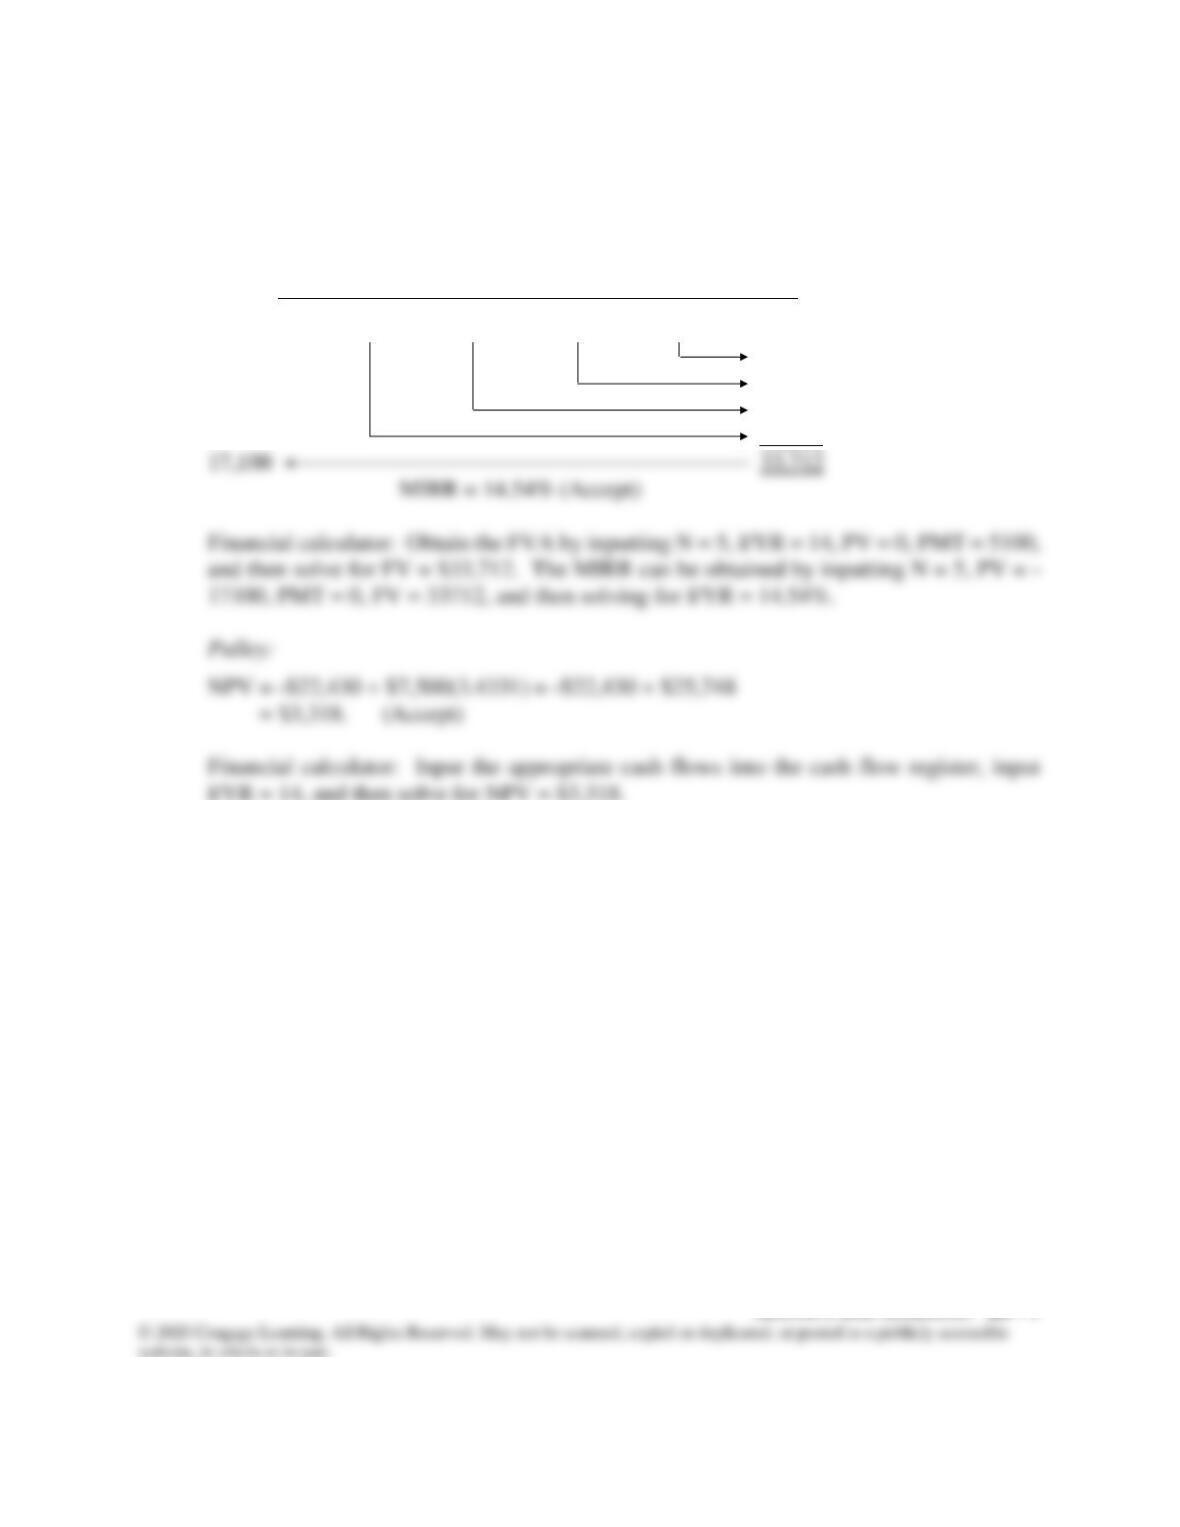
MIRR: PV Costs = $17,100.
FV Inflows:
PV FV
0 1 2 3 4 5
| | | | | |
5,100 5,100 5,100 5,100 5,100
5,814
6,628
7,556
8,614
Financial calculator: Input the appropriate cash flows into the cash flow register and then
solve for IRR = 20%.
MIRR: PV Costs = $22,430.
14%
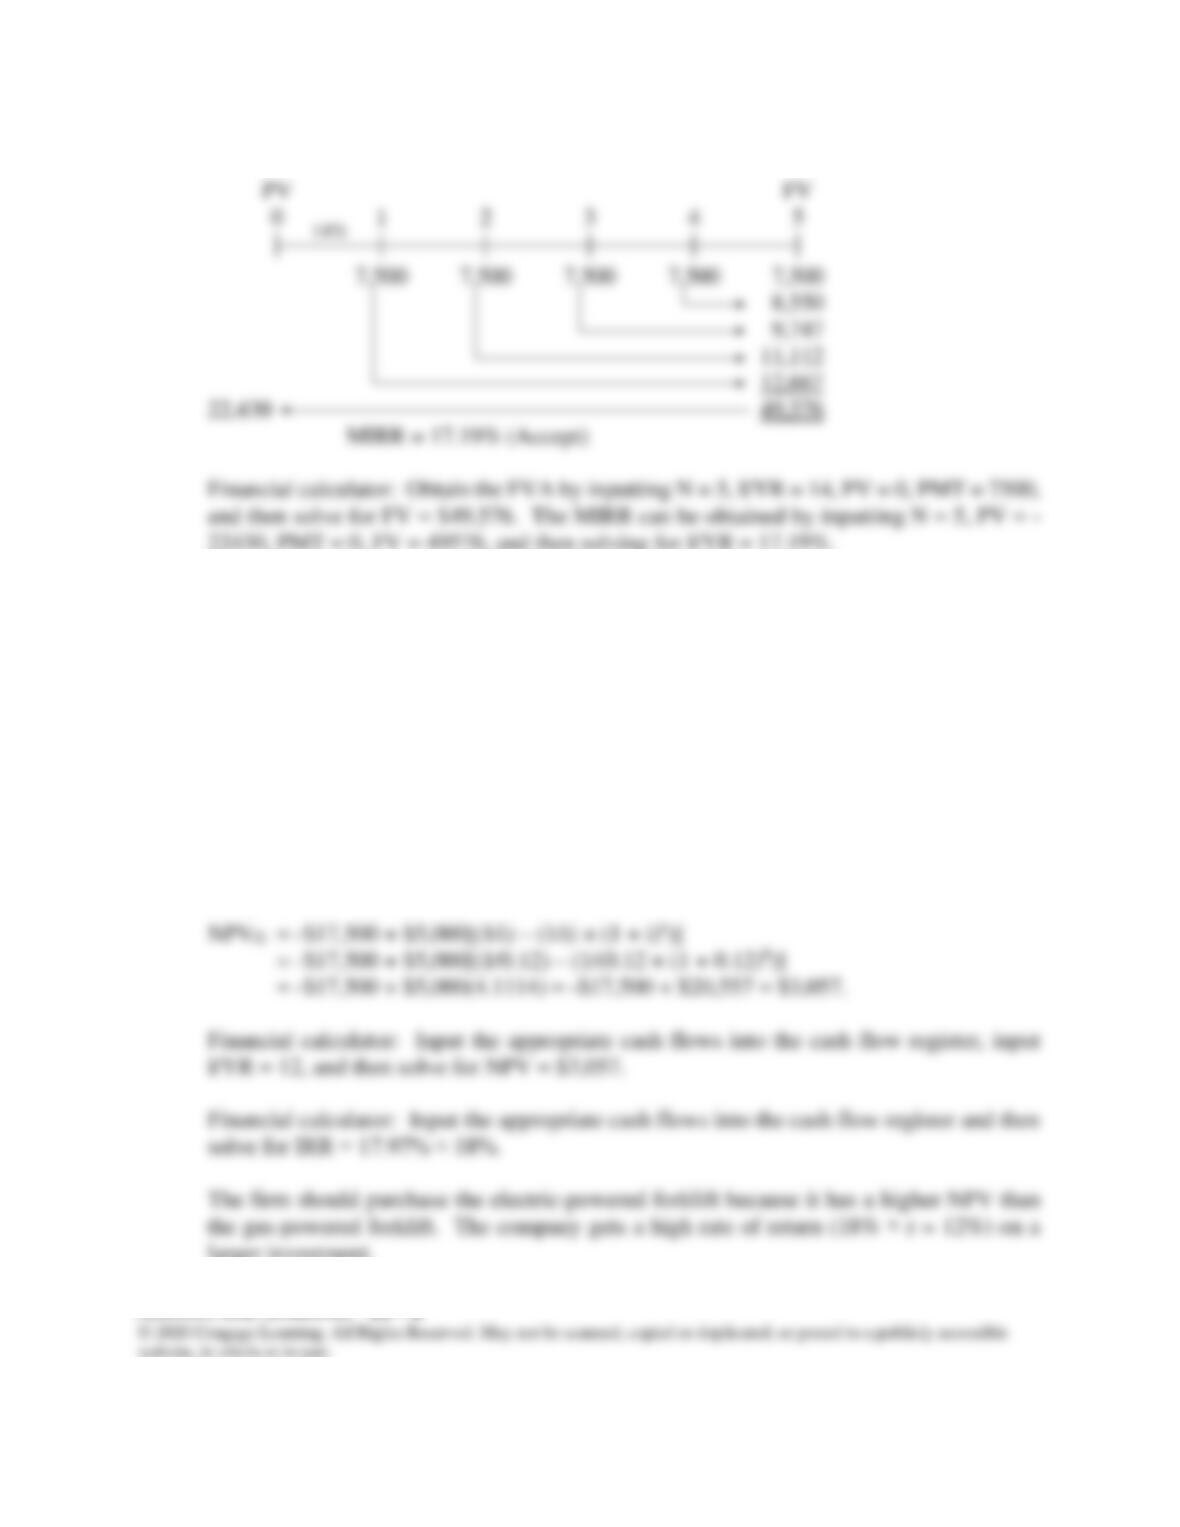
FV Inflows:
10-9 Electric-powered:
NPVE = -$22,000 + $6,290[(1/i) – (1/(i × (1 + i)n)]
= -$22,000 + $6,290[(1/0.12) – (1/(0.12 × (1 + 0.12)6)]
= -$22,000 + $6,290(4.1114) = -$22,000 + $25,861 = $3,861.
Financial calculator: Input the appropriate cash flows into the cash flow register, input
I/YR = 12, and then solve for NPV = $3,861.
Financial calculator: Input the appropriate cash flows into the cash flow register and then
solve for IRR = 18%.
Gas-powered:
larger investment.
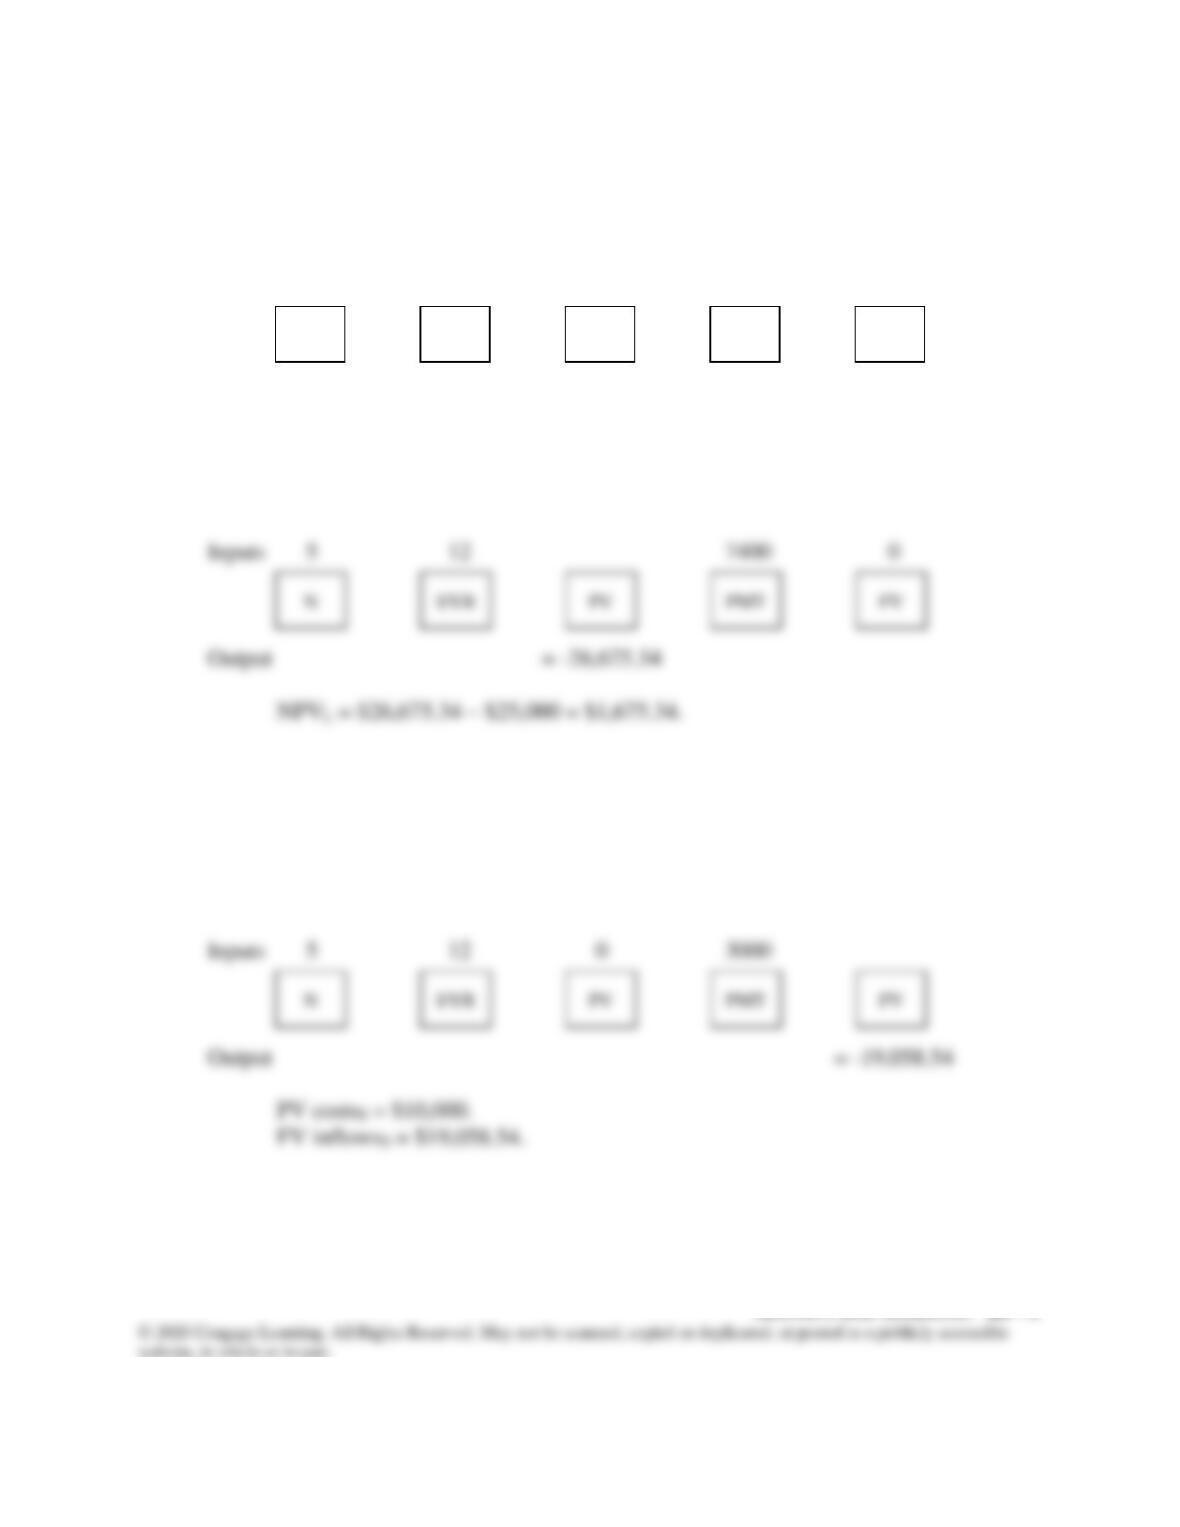
10-10 Financial calculator solution, NPV:
Project S
Inputs 5 12 3000 0
Output = -10,814.33
NPVS = $10,814.33 – $10,000 = $814.33.
Project L
Financial calculator solution, IRR:
Input CF0 = -10000, CF1 = 3000, Nj = 5, IRRS = ? IRRS = 15.24%.
Input CF0 = -25000, CF1 = 7400, Nj = 5, IRRL = ? IRRL = 14.67%.
Financial calculator solution, MIRR:
Project S
N
I/YR
FV
PMT
PV
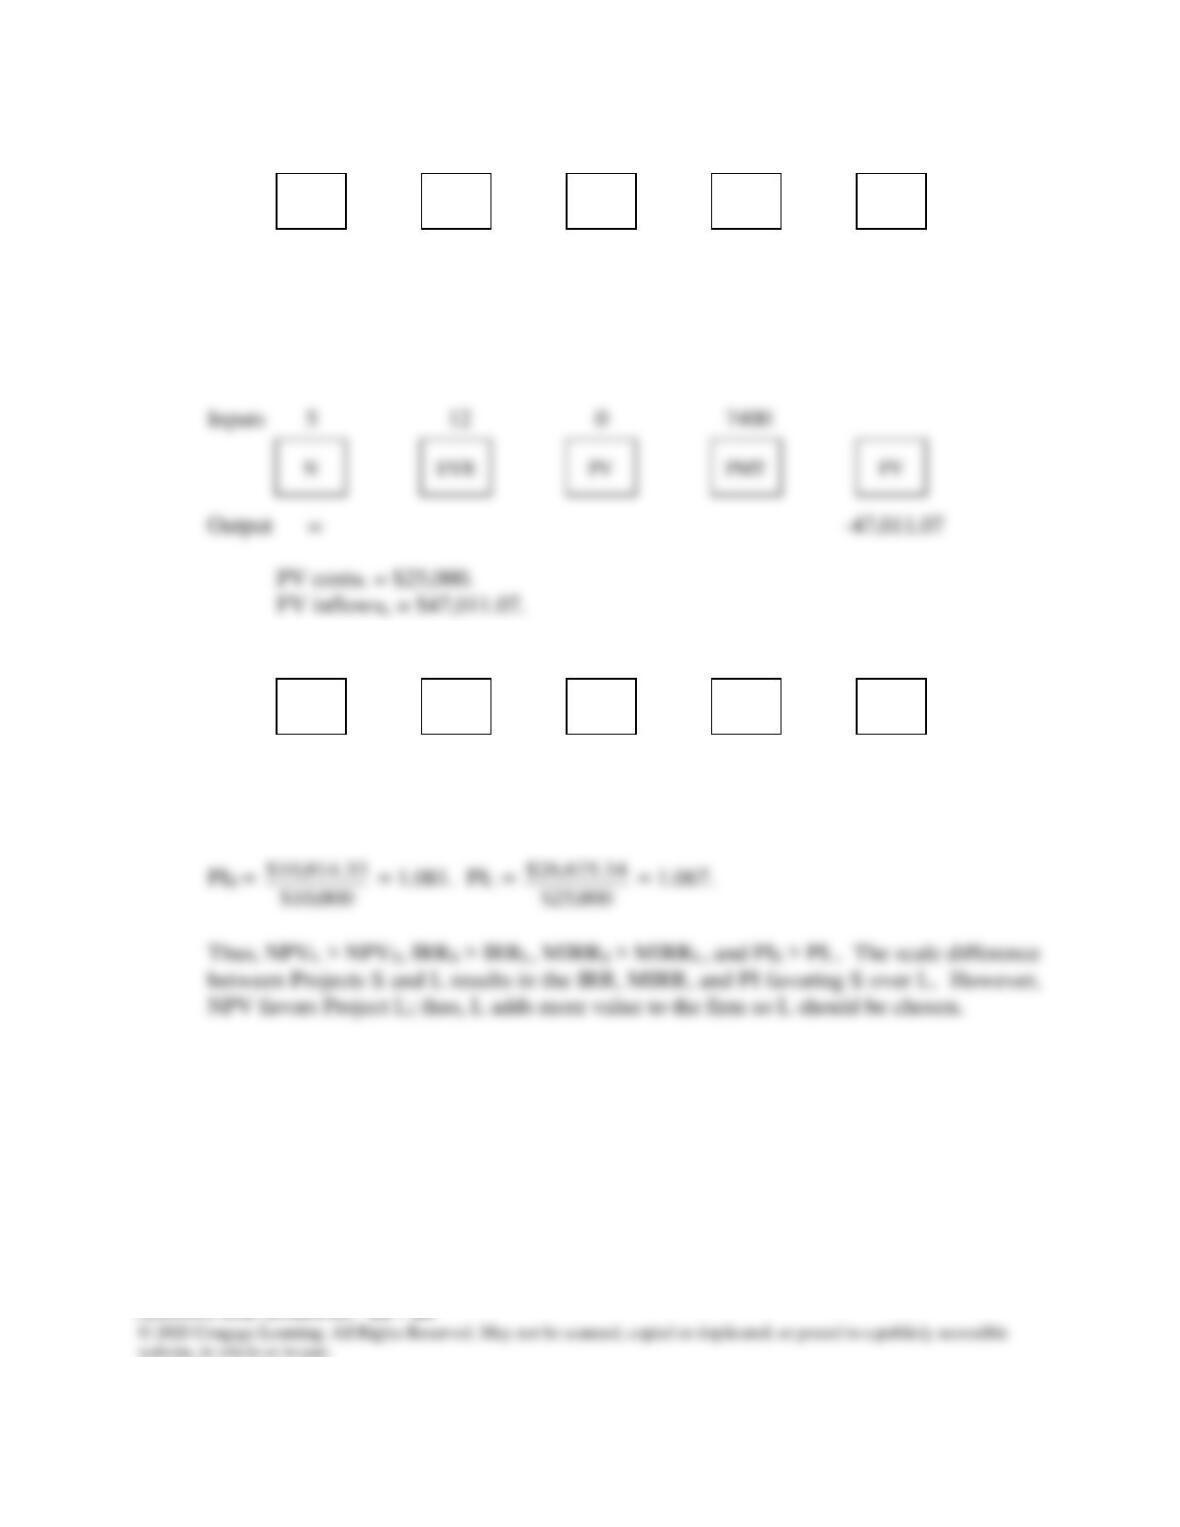
Inputs 5 -10000 0 19058.54
Output = 13.77
MIRRS = 13.77%.
Project L
N
I/YR
FV
PMT
PV
Inputs 5 -25000 0 47011.07
Output = 13.46
MIRRL = 13.46%.
N
I/YR
FV
PMT
PV
N
I/YR
FV
PMT
PV
10-11 Because both projects are the same size you can just calculate each project’s MIRR and
choose the project with the higher MIRR. (Remember, MIRR gives conflicting results
from NPV when there are scale differences between the projects.)
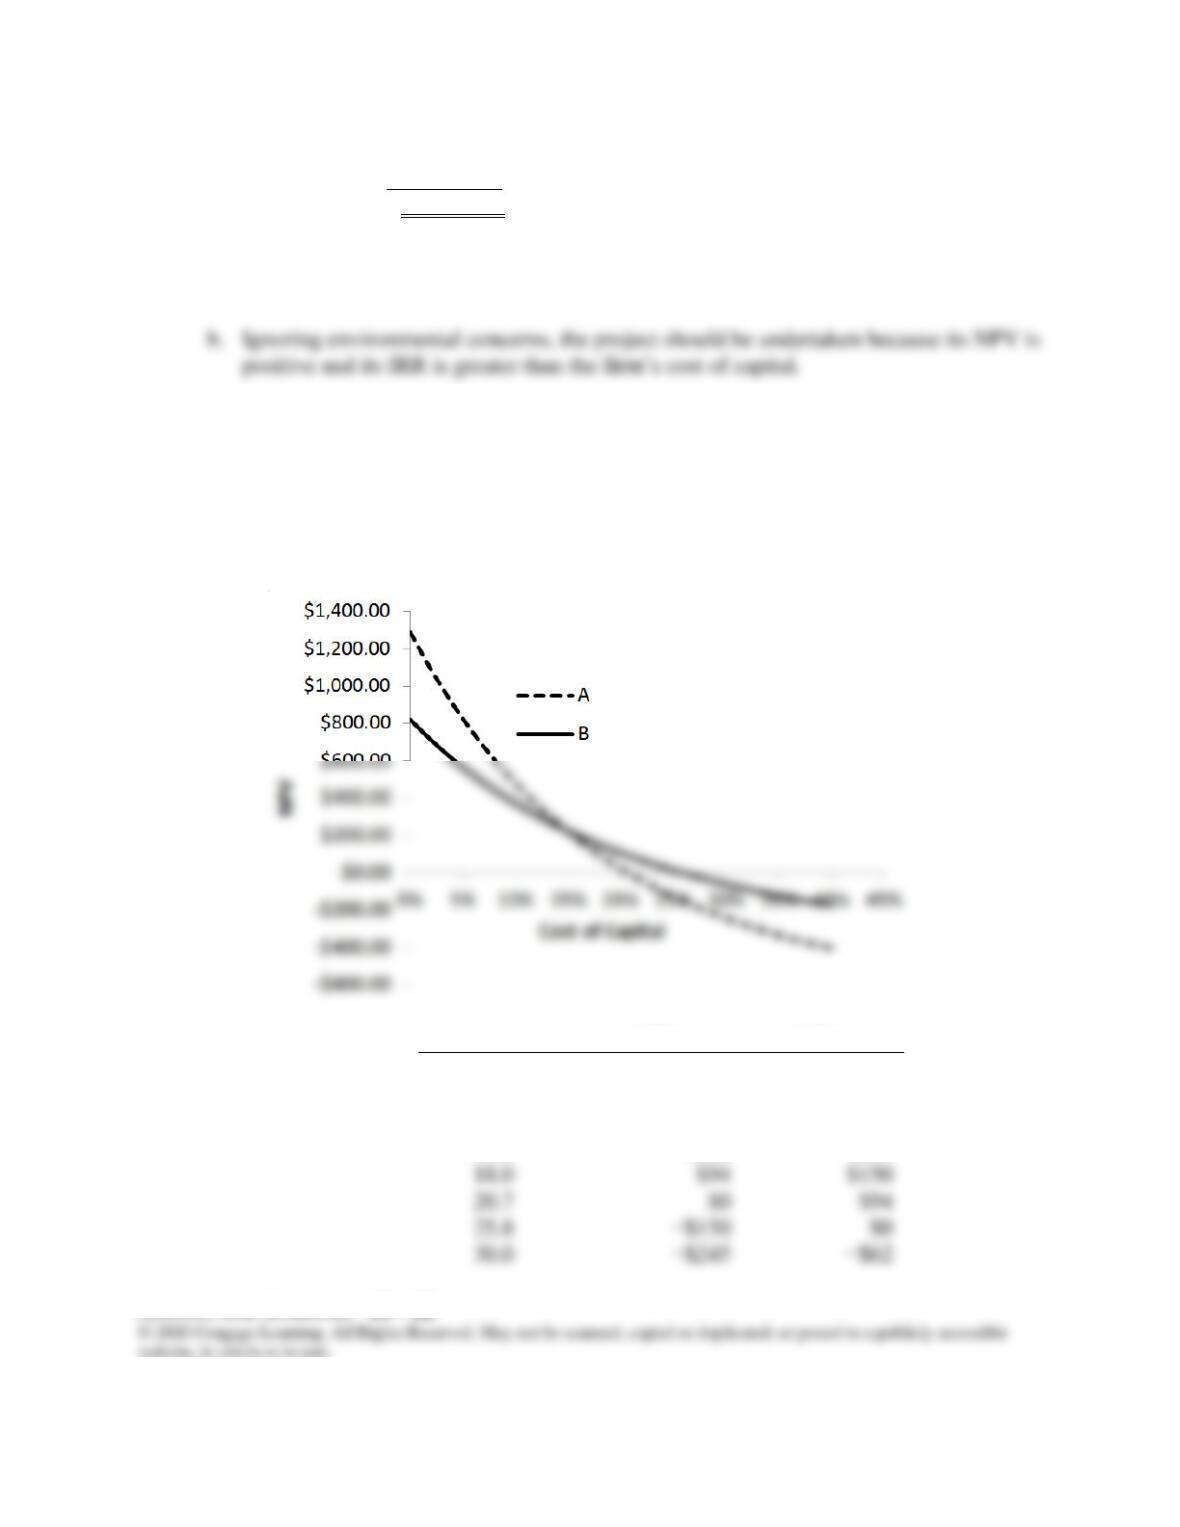
Project X: 0 1 2 3 4
| | | | |
-5,000 1,000 1,500 2,000 4,000.00
2,240.00
1,881.60
1,404.93
9,526.53
5,000 17.49% = MIRRX
$5,000 = $9,529/(1 + MIRRX)4.
12%
12%
10-12 a. Purchase price $ 900,000
Installation 165,000
Initial outlay $1,065,000
CF0 = -1065000; CF1-5 = 350000; I/YR = 14; NPV = ?
NPV = $136,578; IRR = 19.22%.
c. Environmental effects could be added by estimating penalties or any other cash
outflows that might be imposed on the firm to help return the land to its previous state
(if possible). These outflows could be so large as to cause the project to have a negative
NPV—in which case the project should not be undertaken.
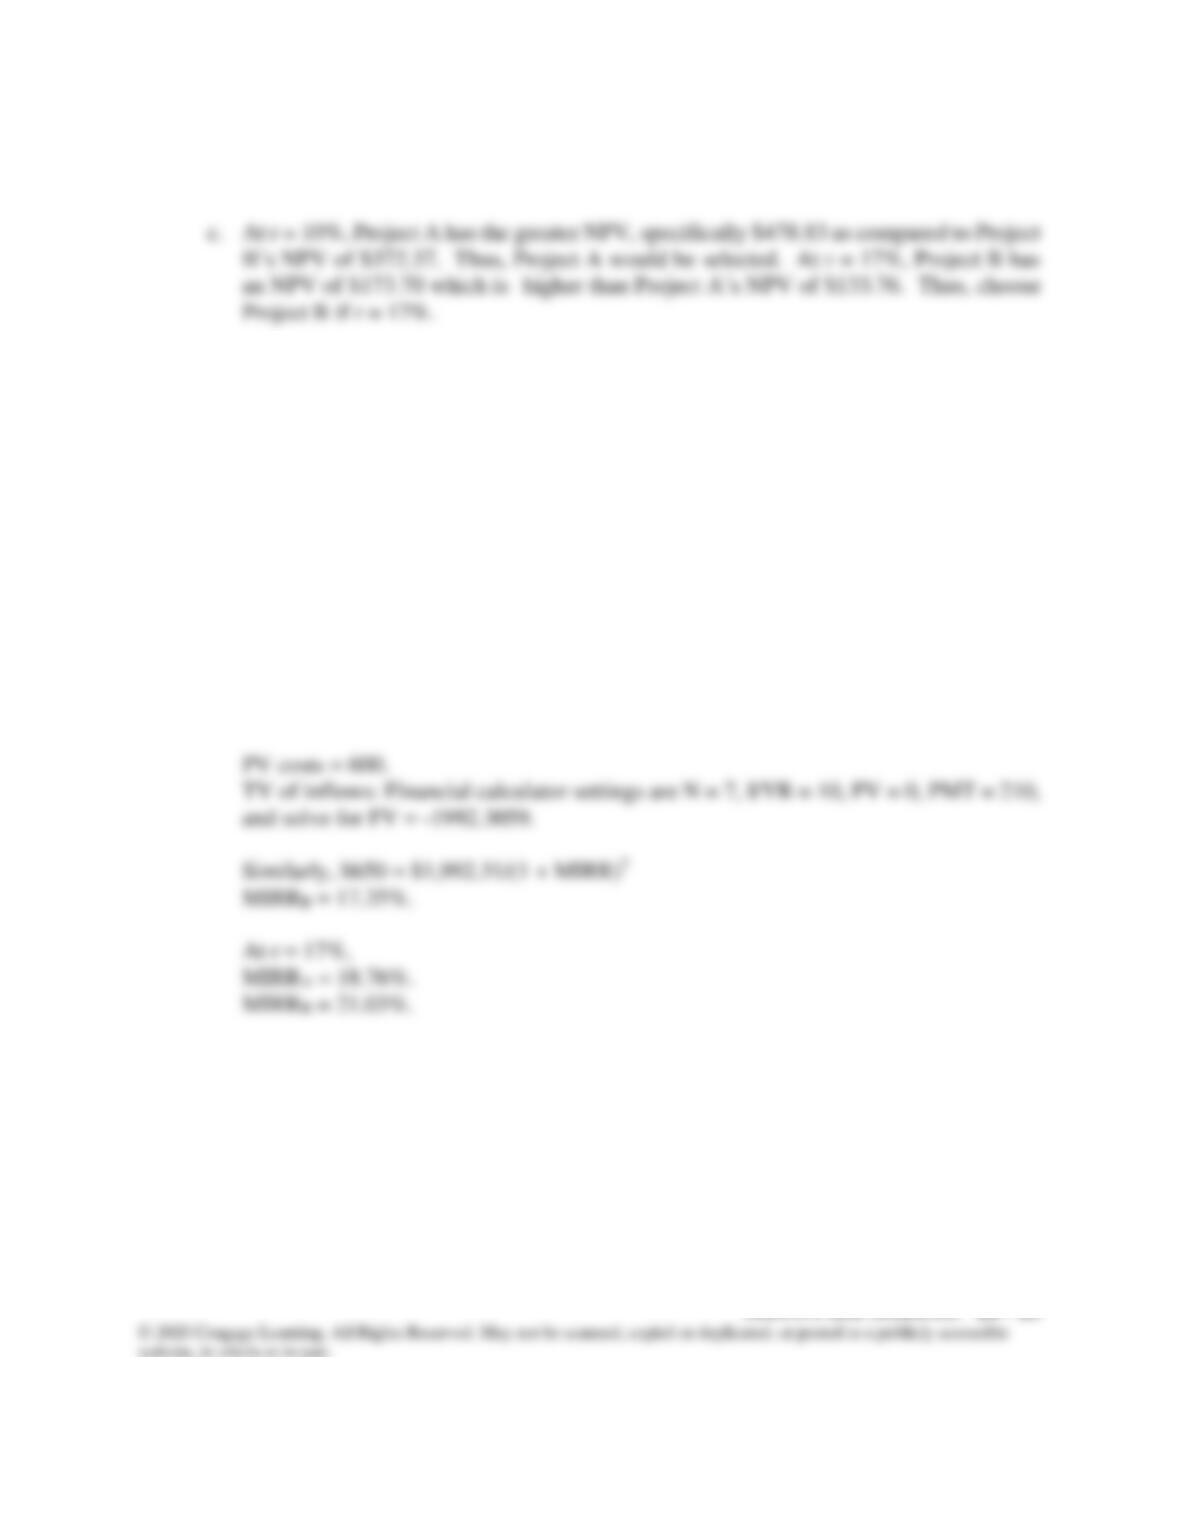
10-13 a.
r
NPVA
NPVB
0.0%
$1,288
$820
10.0
$479
$372
12.0
$366
$308
14.8
$228
$229
18.0
$150
20.7
25.8
30.0
b. IRRA = 20.7%; IRRB = 25.8%.
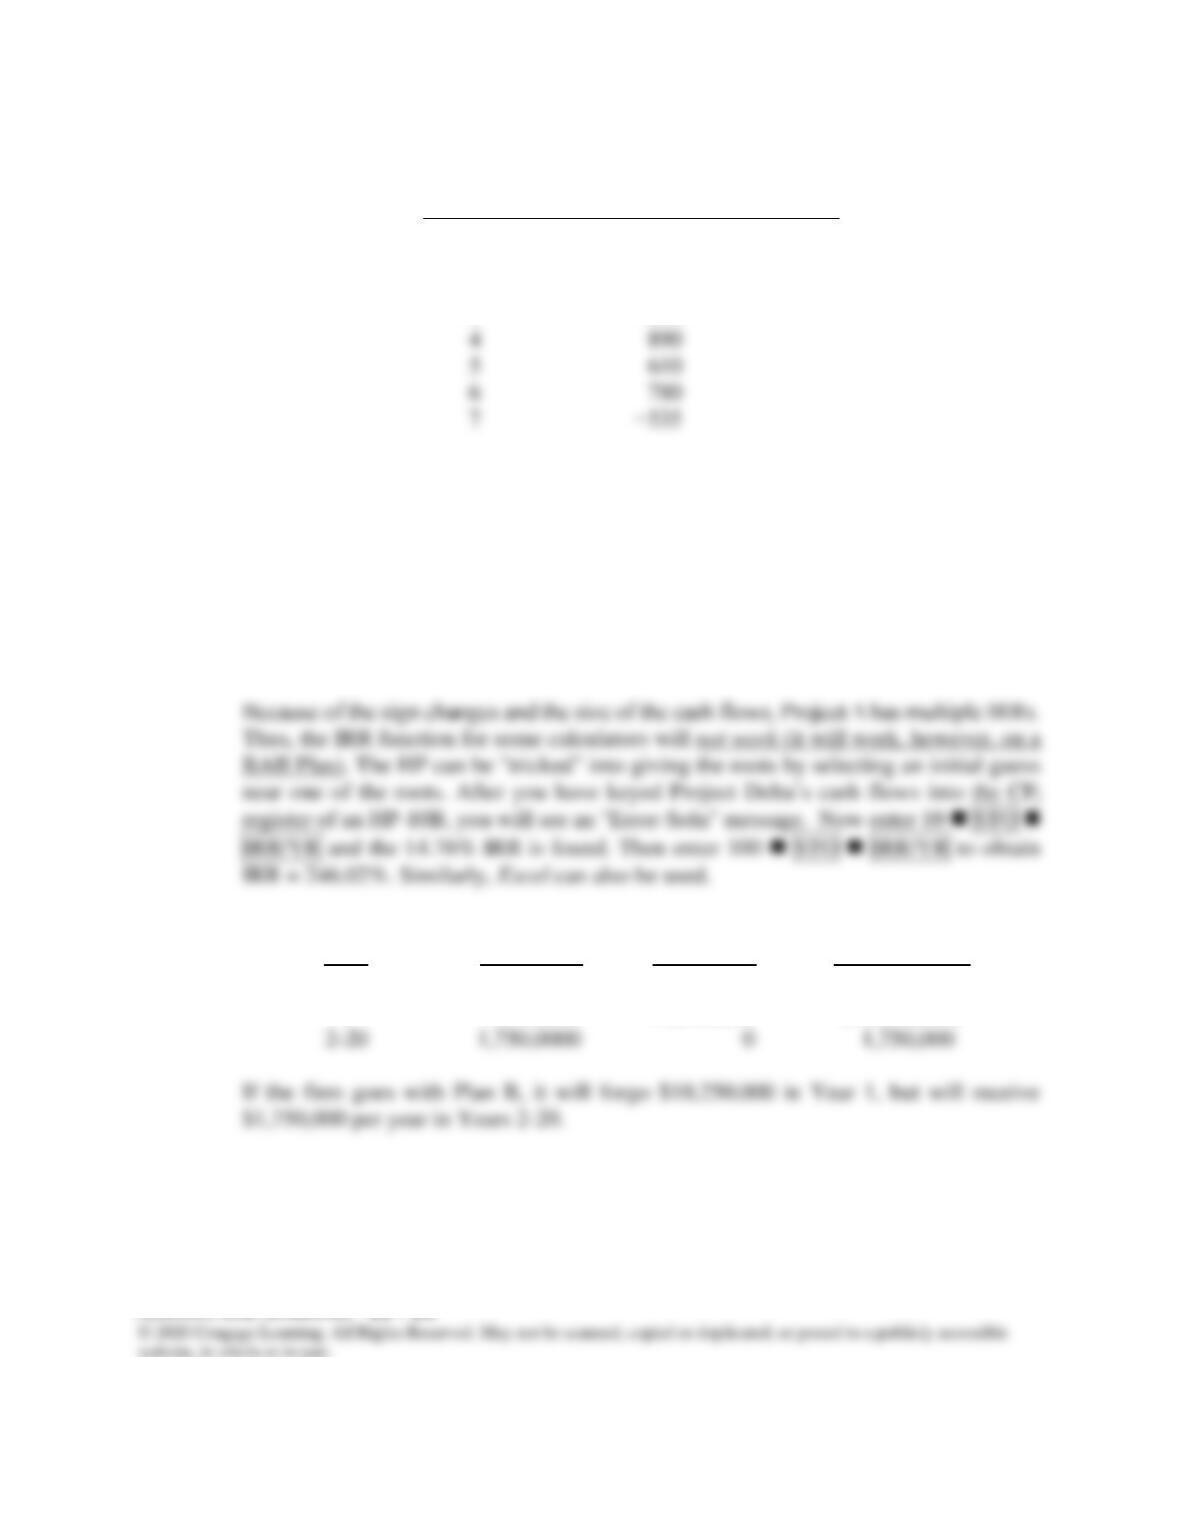
d. Here is the MIRR for Project A when r = 10%:
PV costs = $400 + $528/(1.10)1 + $219/(1.10)2
+ $150/(1.10)3 + $325/(1.10)7 = $1,340.47
TV inflows = $1,100(1.10)3 + $820(1.10)2 + $990(1.10)1 = $3,545.30.
Now, MIRR is that discount rate which forces the PV of $3,545.30 in 7 years to equal
$1,340.47:
$1,340.47 = $3,545.30/(1 + MIRR)7
MIRRA = 14.91%.
Here is the MIRR for Project B when r = 10%:
e. To find the crossover rate, construct a Project ∆ which is the difference in the two
projects’ cash flows:
Year
Project ∆ = CFA – CFB
0
$250
1
−738
2
−429
3
−360
4
5
6
7
−535
IRR∆ = Crossover rate = 14.76%.
Projects A and B are mutually exclusive, thus, only one of the projects can be chosen.
As long as the cost of capital is greater than the crossover rate, both the NPV and IRR
methods will lead to the same project selection. However, if the cost of capital is less
than the crossover rate the two methods lead to different project selections—a conflict
exists. When a conflict exists the NPV method must be used.
10-14 a. Incremental Cash
Year Plan B Plan A Flow (B – A)
0 ($10,000,000) ($10,000,000) $ 0
1 1,750,000 12,000,000 (10,250,000)
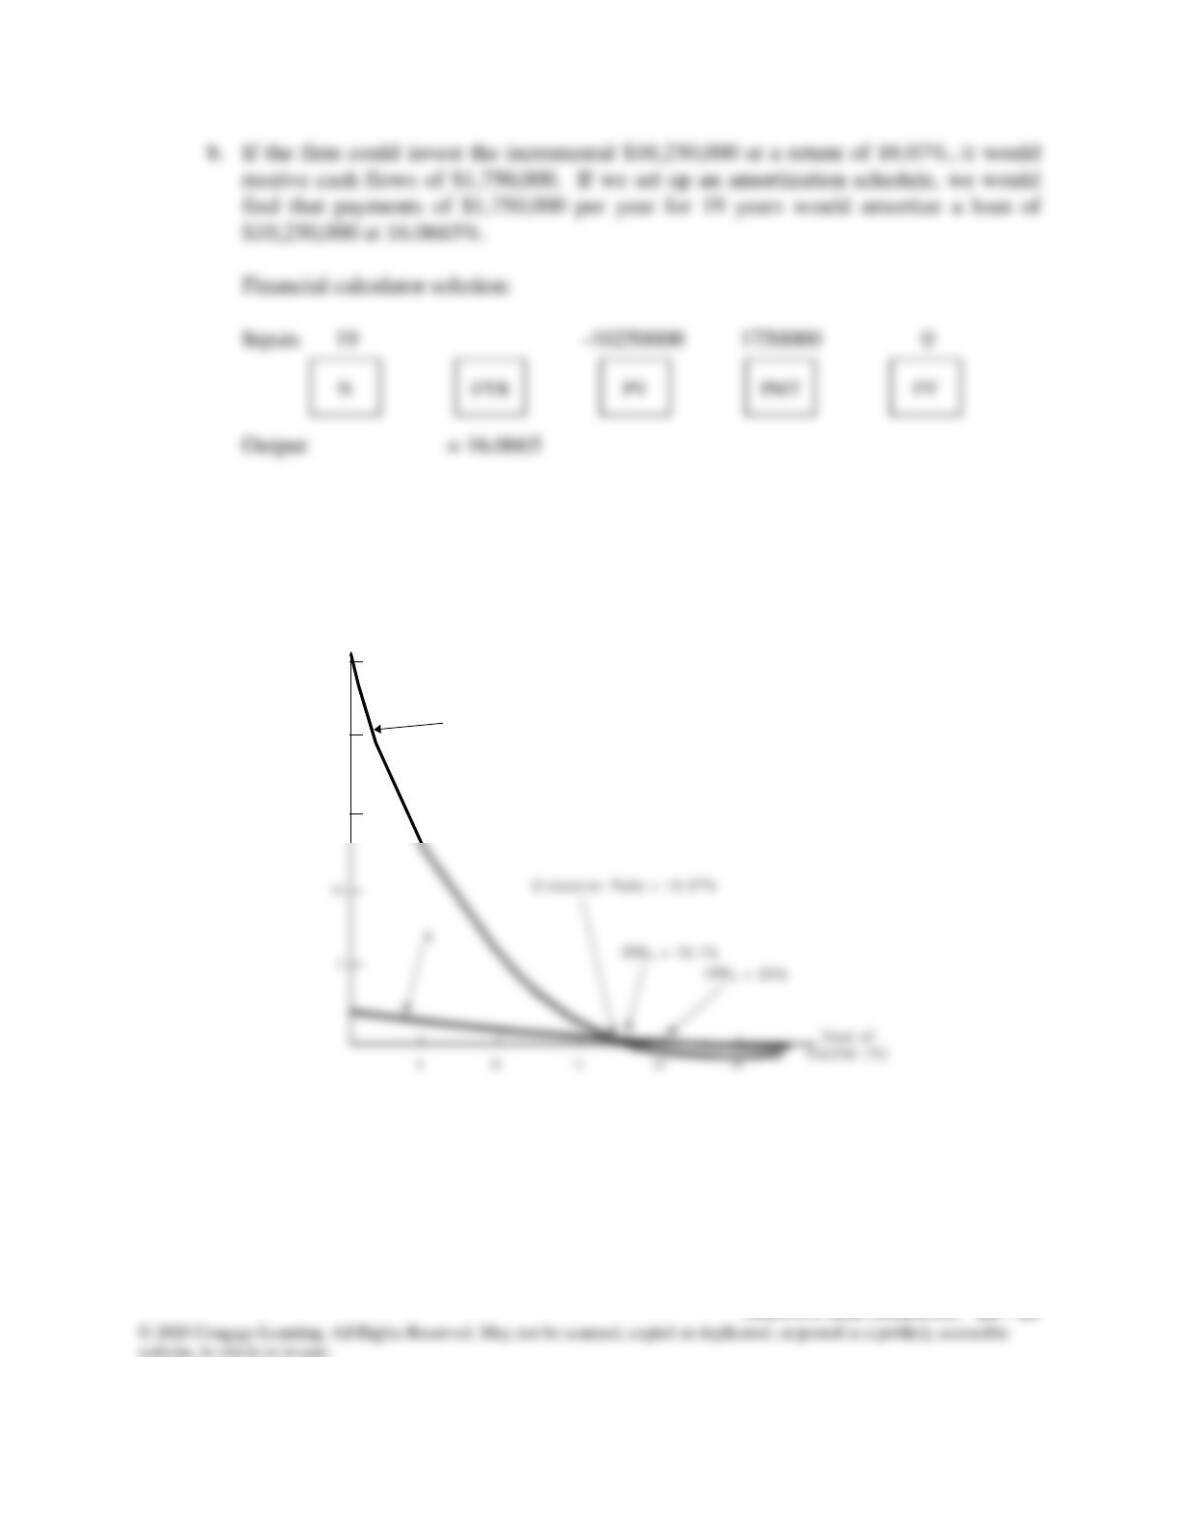
c. Yes, assuming (1) equal risk among projects, and (2) that the cost of capital is a constant
and does not vary with the amount of capital raised.
d. See graph. If the cost of capital is less than 16.07%, then Plan B should be accepted;
if r > 16.07%, then Plan A is preferred.
A
N P V ( M i l l i o n s o f D o l l a r s )
B
25
20
15
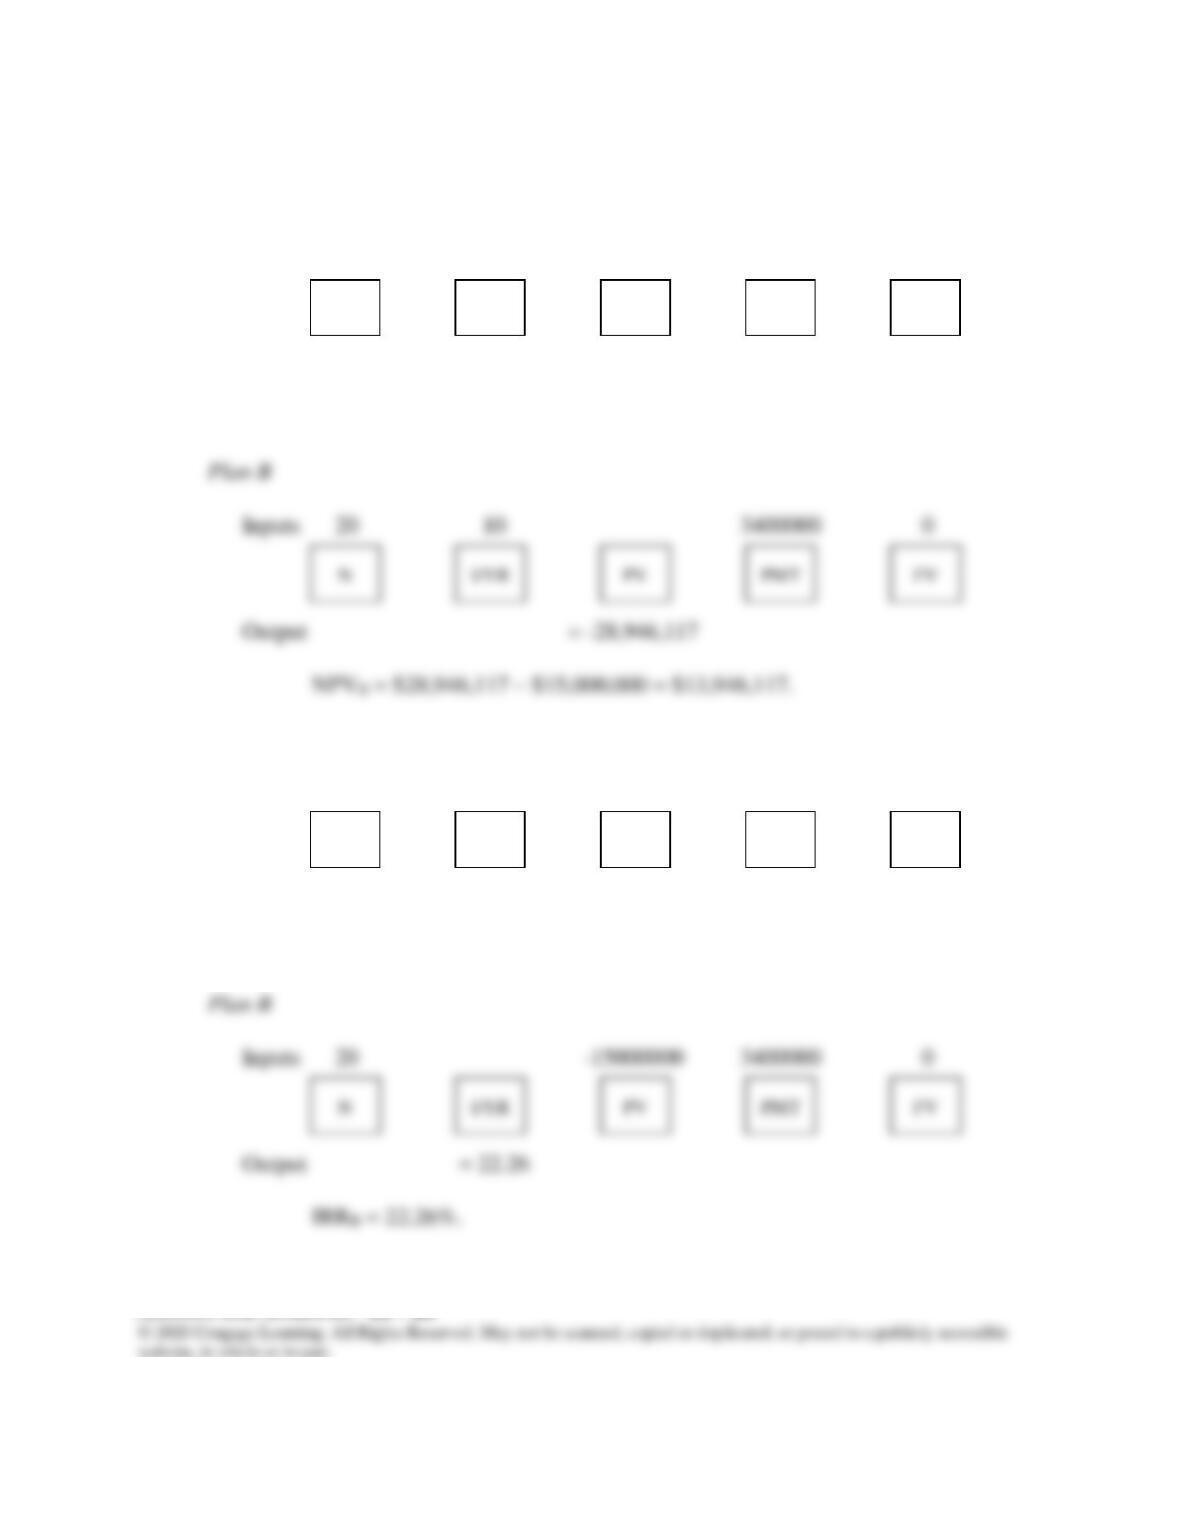
10-15 a. Financial calculator solution:
Plan A
Inputs 20 10 8000000 0
Output = -68,108,510
NPVA = $68,108,510 – $50,000,000 = $18,108,510.
Plan A
Inputs 20 -50000000 8000000 0
Output = 15.03
IRRA = 15.03%.
N
I/YR
FV
PMT
PV
N
I/YR
FV
PMT
PV
N
I/YR
FV
PMT
PV

b. If the company takes Plan A rather than B, its cash flows will be (in millions of dollars):
Cash Flows Cash Flows Project ∆
Year from A from B Cash Flows
0 ($50) ($15.0) ($35.0)
1 8 3.4 4.6
2 8 3.4 4.6
– – – –
Inputs 20 10 4600000 0
Output = -39,162,393
NPV = $39,162,393 – $35,000,000 = $4,162,393.
Inputs 20 -35000000 4600000 0
N
I/YR
FV
PMT
PV
N
I/YR
FV
PMT
PV
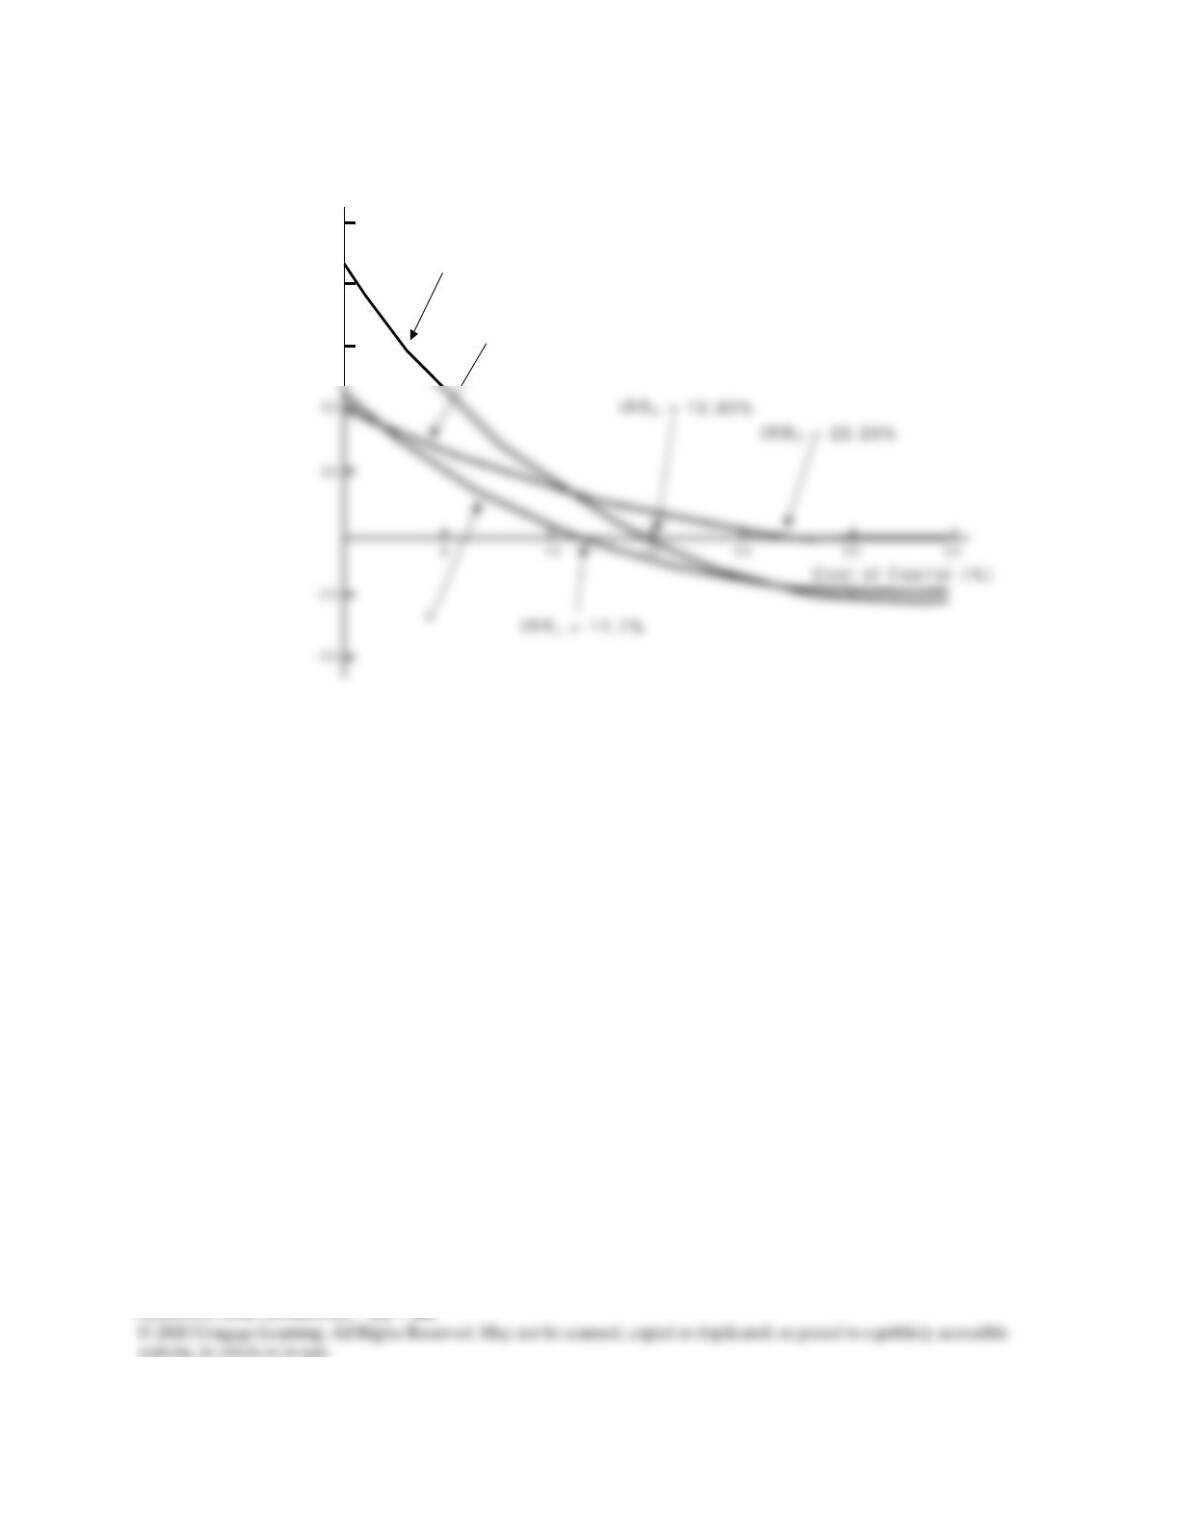
c.
N P V ( M i l l i o n s o f D o l l a r s )
C r o s s o v e r R a t e = 1 1 . 7 %
A
B
1 2 5
1 0 0
75
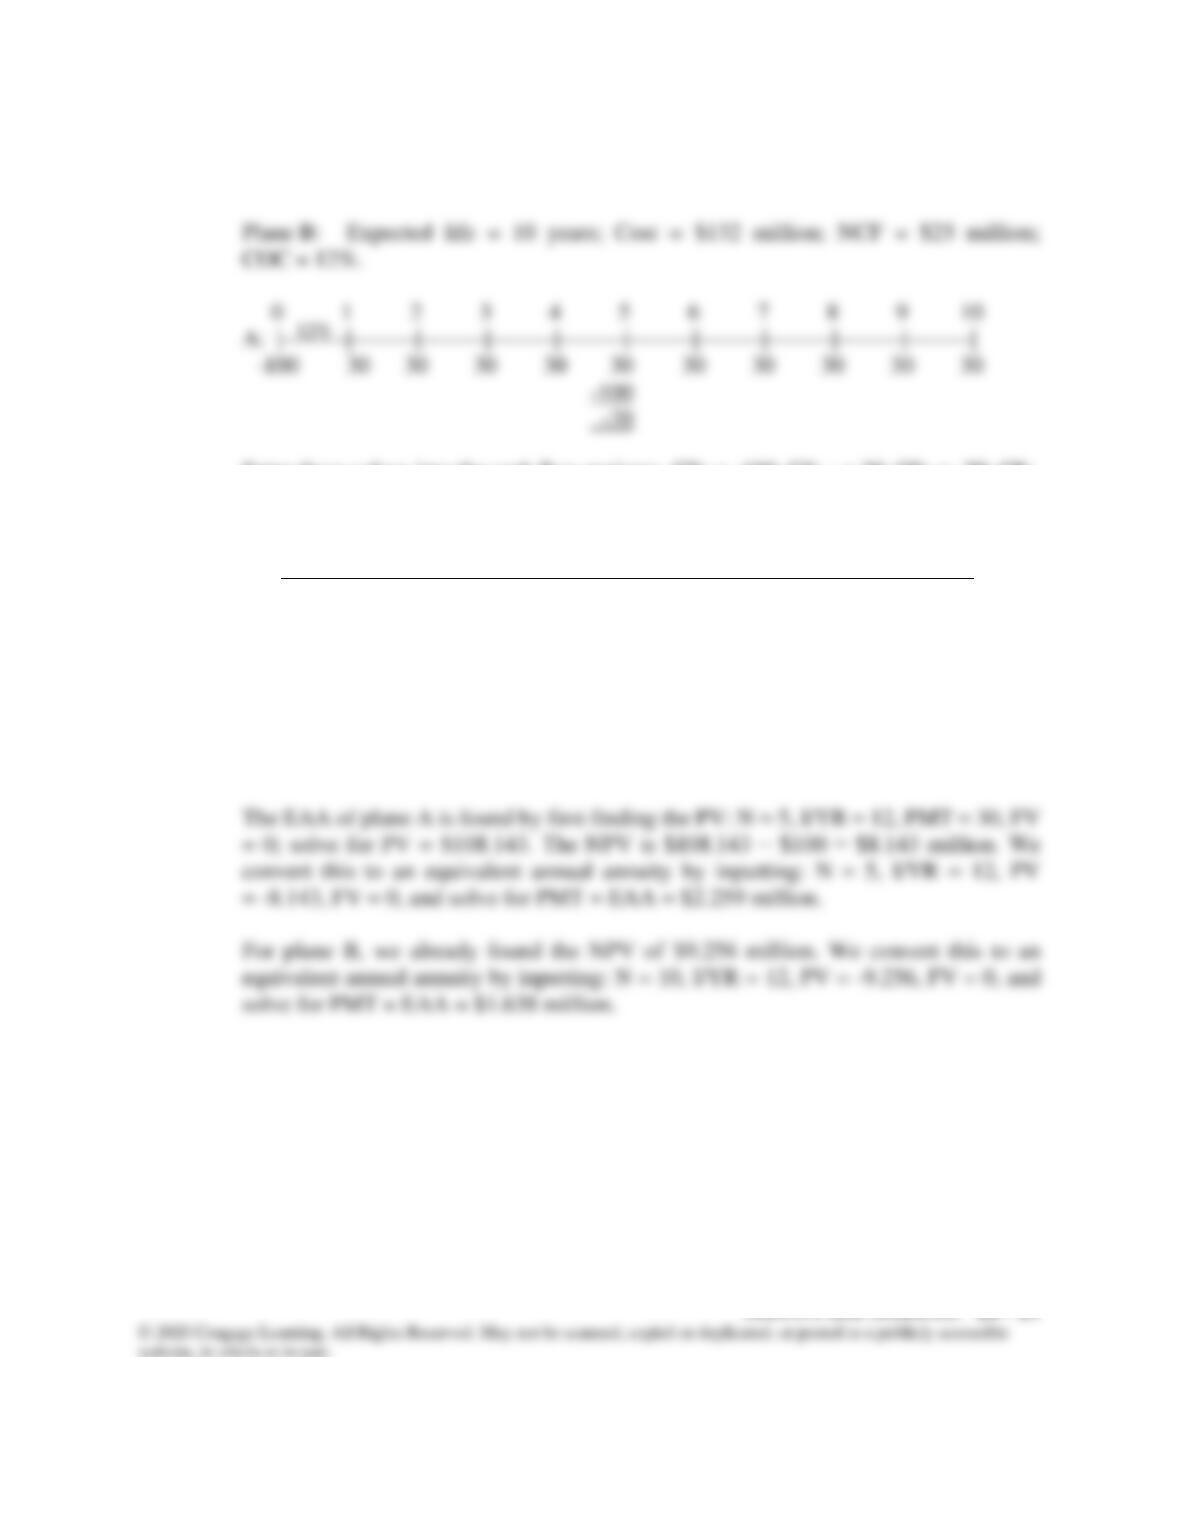
10-16 Plane A: Expected life = 5 years; Cost = $100 million; NCF = $30 million;
COC = 12%.
12%
Enter these values into the cash flow register: CF0 = -100; CF1-4 = 30; CF5 = -70; CF6-
10 = 30. Then enter I/YR = 12, and press the NPV key to get NPVA = $12.764 million.
0 1 2 3 4 5 6 7 8 9 10
B: | | | | | | | | | | |
-132 25 25 25 25 25 25 25 25 25 25
Enter these cash flows into the cash flow register, along with the interest rate, and press
the NPV key to get NPVB = $9.256 million.
Project A is the better project and will increase the company’s value by $12.764
million.
12%
10-17 0 1 2 3 4 5 6 7 8
A: | | | | | | | | |
-10 4 4 4 4 4 4 4 4
-10
-6
10%
For Machine B’s NPV, enter these cash flows into the cash flow register, along with
the interest rate, and press the NPV key to get NPVB = $3.672 ≈ $3.67 million.
Machine A is the better project and will increase the company’s value by $4.51 million.
The EAA of Machine A is found by first finding the PV: N = 4, I/YR = 10, PMT =
4, FV = 0; solve for PV = $12.679. The NPV is $12.679 − $10 = $2.679 million. We
convert this to an equivalent annual annuity by inputting: N = 4, I/YR = 10, PV
= -2.679, FV = 0, and solve for PMT = EAAA = 0.845 ≈ $0.85 million.
10%